Single-molecule analysis of transcription factor binding at transcription sites in live cells - PubMed (original) (raw)
Single-molecule analysis of transcription factor binding at transcription sites in live cells
Tatsuya Morisaki et al. Nat Commun. 2014.
Abstract
Although numerous live-cell measurements have shown that transcription factors (TFs) bind chromatin transiently, no measurements of transient binding have been reported at the endogenous response elements (REs) where transcription is normally induced. Here we show that at endogenous REs the transcriptionally productive specific binding of two TFs, p53 and the glucocorticoid receptor (GR), is transient. We also find that the transient residence times of GR at endogenous REs are roughly comparable to those at an artificial, multi-copy array of gene regulatory sites, supporting the use of multi-copy arrays for live-cell analysis of transcription. Finally, we find that at any moment only a small fraction of TF molecules are engaged in transcriptionally productive binding at endogenous REs. The small fraction of bound factors provides one explanation for gene bursting and it also indicates that REs may often be unoccupied, resulting in partial responses to transcriptional signals.
Figures
Figure 1
Images of GR single molecules in the nucleus of a live cell. HaloTMR-tagged GR molecules at selected time points (upper left corner) are presented from a 60 s movie. Projection of 85 successive timepoints from the movie defines the boundary of the nucleus (first frame). Color coding in subsequent panels indicates three separate segments of the movie illustrating a bound molecule (yellow - residence time of 10 s), a molecule that appears for only one timepoint (green) and a free molecule that diffuses in the plane of focus (red). Arrows indicate the molecule of interest. Red dotted line indicates the path of the diffusing molecule. Scale bar 1 µm.
Figure 2
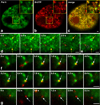
Single molecule tracking within and outside of transcription domains. Fixed cells showing GFP-tagged polymerase II puncta (a) with BrUTP incorporation marking sites of transcription (b). Many polymerase II puncta are sites of BrUTP incorporation (overlay, c). Four time points (shown in upper left corner) of a GFP-polymerase II movie taken in live cells (d), and the projection image from that movie (e). Yellow arrows indicate examples of polymerase II foci that appear in multiple frames and give rise to well-defined domains in the averaged movie. Red arrow indicates a region largely devoid of polymerase. Dotted circles (0.6 µm diameter) provide examples of regions where single molecule tracking would be performed. (f) Selected time points from a movie showing association of a single GR molecule (red) with an averaged projection of a polymerase II movie (green). White arrows indicate the frames (0.4 s – 8.0 s) during which the GR molecule remains bound within the transcription domain. (g) Selected time points from a movie showing a bound GR molecule away from a transcription domain, with binding occurring from 0.2 – 2.0 s. Scale bars 1 µm.
Figure 3
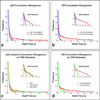
Cumulative histograms with semi-log plots (insets). Dwell times of molecules in transcription domains are significantly longer than dwell times of molecules away from transcription domains for both p53 (a) and GR (b). The tail of the histogram for the seven-amino-acid specific-site binding mutant p53 mSB disappears, while a reduction in the height of the tail is seen for the single-amino-acid mutant p53 R273H (c).The tail of the historgram of GR activated with corticosterone fell to zero earlier compared to dexamethasone activation (d). We collected 20 – 30 time-lapse movies for each experimental condition. From this set of movies we selected 2 – 3 representative movies in which the number and brightness of the single molecules were optimal for tracking, and then from these movies we tracked a total of 400 – 700 single molecules for each condition. See Fig. S6 for histograms of p53 mSB, p53 R273H and GR outside of transcription domains, and Fig. S5 for representative fits to these data.
Figure 4
GR binding at the MMTV tandem array. The MMTV tandem array (bright green puncta in a) is typically associated with a distinct cluster of polymerase II puncta (b,c). This cluster of polymerase II at the array can also be discerned in live cells (white box in d), and used to define a transcriptionally active zone at the array (yellow outline in the inset). (e) A much higher fraction of molecules with longer dwell times are found at the array compared to randomly selected transcription sites. Scale bars 1 µm.
Similar articles
- P53 and p73 differ in their ability to inhibit glucocorticoid receptor (GR) transcriptional activity.
Zhang L, Nie L, Maki CG. Zhang L, et al. Mol Cancer. 2006 Dec 6;5:68. doi: 10.1186/1476-4598-5-68. Mol Cancer. 2006. PMID: 17150106 Free PMC article. - Transcription factor assisted loading and enhancer dynamics dictate the hepatic fasting response.
Goldstein I, Baek S, Presman DM, Paakinaho V, Swinstead EE, Hager GL. Goldstein I, et al. Genome Res. 2017 Mar;27(3):427-439. doi: 10.1101/gr.212175.116. Epub 2016 Dec 28. Genome Res. 2017. PMID: 28031249 Free PMC article. - Live-cell p53 single-molecule binding is modulated by C-terminal acetylation and correlates with transcriptional activity.
Loffreda A, Jacchetti E, Antunes S, Rainone P, Daniele T, Morisaki T, Bianchi ME, Tacchetti C, Mazza D. Loffreda A, et al. Nat Commun. 2017 Aug 22;8(1):313. doi: 10.1038/s41467-017-00398-7. Nat Commun. 2017. PMID: 28827596 Free PMC article. - A conserved role for transcription factor sumoylation in binding-site selection.
Rosonina E. Rosonina E. Curr Genet. 2019 Dec;65(6):1307-1312. doi: 10.1007/s00294-019-00992-w. Epub 2019 May 15. Curr Genet. 2019. PMID: 31093693 Review. - How glucocorticoid receptors modulate the activity of other transcription factors: a scope beyond tethering.
Ratman D, Vanden Berghe W, Dejager L, Libert C, Tavernier J, Beck IM, De Bosscher K. Ratman D, et al. Mol Cell Endocrinol. 2013 Nov 5;380(1-2):41-54. doi: 10.1016/j.mce.2012.12.014. Epub 2012 Dec 23. Mol Cell Endocrinol. 2013. PMID: 23267834 Review.
Cited by
- DNA binding triggers tetramerization of the glucocorticoid receptor in live cells.
Presman DM, Ganguly S, Schiltz RL, Johnson TA, Karpova TS, Hager GL. Presman DM, et al. Proc Natl Acad Sci U S A. 2016 Jul 19;113(29):8236-41. doi: 10.1073/pnas.1606774113. Epub 2016 Jul 5. Proc Natl Acad Sci U S A. 2016. PMID: 27382178 Free PMC article. - Regulation of circadian rhythms by clock protein nuclear bodies.
Yuan Y, Yadlapalli S. Yuan Y, et al. Proc Natl Acad Sci U S A. 2024 Jan 30;121(5):e2321334121. doi: 10.1073/pnas.2321334121. Epub 2024 Jan 17. Proc Natl Acad Sci U S A. 2024. PMID: 38232300 Free PMC article. No abstract available. - Nonequilibrium models of optimal enhancer function.
Grah R, Zoller B, Tkačik G. Grah R, et al. Proc Natl Acad Sci U S A. 2020 Dec 15;117(50):31614-31622. doi: 10.1073/pnas.2006731117. Epub 2020 Dec 2. Proc Natl Acad Sci U S A. 2020. PMID: 33268497 Free PMC article. - Estimating binding properties of transcription factors from genome-wide binding profiles.
Zabet NR, Adryan B. Zabet NR, et al. Nucleic Acids Res. 2015 Jan;43(1):84-94. doi: 10.1093/nar/gku1269. Epub 2014 Nov 28. Nucleic Acids Res. 2015. PMID: 25432957 Free PMC article. - Steroid Receptors Reprogram FoxA1 Occupancy through Dynamic Chromatin Transitions.
Swinstead EE, Miranda TB, Paakinaho V, Baek S, Goldstein I, Hawkins M, Karpova TS, Ball D, Mazza D, Lavis LD, Grimm JB, Morisaki T, Grøntved L, Presman DM, Hager GL. Swinstead EE, et al. Cell. 2016 Apr 21;165(3):593-605. doi: 10.1016/j.cell.2016.02.067. Epub 2016 Apr 7. Cell. 2016. PMID: 27062924 Free PMC article.
References
- Mueller F, Stasevich TJ, Mazza D, McNally JG. Quantifying transcription factor kinetics: at work or at play? Crit Rev Bioch Mol Biol. 2013;48:492–514. - PubMed
- McNally JG, Müller WG, Walker D, Wolford R, Hager GL. The glucocorticoid receptor: rapid exchange with regulatory sites in living cells. Science. 2000;287:1262–1265. - PubMed
- Sharp ZD, et al. Estrogen-receptor-alpha exchange and chromatin dynamics are ligand- and domain-dependent. J. Cell Sci. 2006;119:4101–4116. - PubMed
Publication types
MeSH terms
Substances
LinkOut - more resources
Full Text Sources
Other Literature Sources
Research Materials
Miscellaneous


