A quantitative chaperone interaction network reveals the architecture of cellular protein homeostasis pathways - PubMed (original) (raw)
A quantitative chaperone interaction network reveals the architecture of cellular protein homeostasis pathways
Mikko Taipale et al. Cell. 2014.
Abstract
Chaperones are abundant cellular proteins that promote the folding and function of their substrate proteins (clients). In vivo, chaperones also associate with a large and diverse set of cofactors (cochaperones) that regulate their specificity and function. However, how these cochaperones regulate protein folding and whether they have chaperone-independent biological functions is largely unknown. We combined mass spectrometry and quantitative high-throughput LUMIER assays to systematically characterize the chaperone-cochaperone-client interaction network in human cells. We uncover hundreds of chaperone clients, delineate their participation in specific cochaperone complexes, and establish a surprisingly distinct network of protein-protein interactions for cochaperones. As a salient example of the power of such analysis, we establish that NUDC family cochaperones specifically associate with structurally related but evolutionarily distinct β-propeller folds. We provide a framework for deciphering the proteostasis network and its regulation in development and disease and expand the use of chaperones as sensors for drug-target engagement.
Copyright © 2014 Elsevier Inc. All rights reserved.
Figures
Figure 1. Two-pronged approach for characterizing the proteostasis network in human cells
A) 67 chaperones, co-chaperones or quality control factors tagged with either 3xFLAG tag or Renilla luciferase were stably expressed in 293T cells. Interactors were identified either by affinity purification followed by mass spectrometry (APMS; 3xFLAG tagged proteins) or by LUMIER assay (_Renilla_-tagged proteins). B) Chaperones, co-chaperones, protein quality control factors and other proteins characterized in this study. See also Figure S1.
Figure 2. The proteostasis network in human cells characterized by mass spectrometry
Protein-protein interactions were identified by affinity-purification followed by mass spectrometry (AP-MS), and filtered using the SAINT algorithm with cutoff AvgP ≥ 0.85. Proteins are shown as rectangles, and lines represent interactions between the proteins. Bait proteins are indicated by dark edges. The width of the edges corresponds to the number of spectral counts identified for each interaction. Examples of biologically coherent interactions are indicated in colors. See also Figure S1 and S2.
Figure 3. Unique associations of FKBP and BAG family co-chaperones
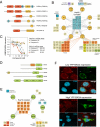
A) The FKBP (FK506-binding protein) family of Hsp90 co-chaperones are characterized by one or more TPR domains that can interact with Hsp90 and the FKBP domainchk. B) The interaction network of FKBP family co-chaperones. Selected unique interaction partners and protein classes are indicated. C) The natural compound OSW-1 disrupts the interaction between OSBP and FKBP36. 3xFLAG-tagged OSBP was transfected into 293T cells stably expressing FKBP36-Renilla luciferase fusion. One hour before cell lysis, cells were treated with a dilution series of the indicated compounds. The interaction between OSBP and FKBP36 was then measured with LUMIER. Error bars indicate standard deviation. D) BAG proteins are a family of homologous Hsp70 co-factors that interact with Hsp70 through their BAG domain. E) The interaction network of BAG family co-chaperones. Selected unique interaction partners are indicated. F) BAG4 co-localizes with the P body component DCP1A and regulates P body assembly. Top panel: YFP-BAG4 (green) was transfected into HeLa cells, which were then fixed and stained for endogenous DCP1A (red), a component of P bodies. DNA was stained with Hoechst 33342 (cyan). Bottom panel: in cells where YFP-BAG4 is expressed at high levels, endogenous DCP1A appears diffuse. See also Figure S3
Figure 4. Effect of transient Hsp90 inhibition on chaperone interactions
A) Hsp90 inhibition leads to dissociation of most clients from Hsp90β. Hsp90β was surveyed for interaction with 800 proteins with LUMIER assay. Cells were treated for 1 hour with 1 µM ganetespib or left untreated before the assay. Hsp90 co-chaperones are shown as green circles. Interaction strength was quantitated as LUMIER scores. B) Hsp90 inhibition leads to stronger association of some proteins with Hsc70. Hsc70 was assayed for interaction with 800 proteins as in (A). Hsp70 cochaperones are shown as green circles. C) Comparison of the effects of ganetespib on Hsp90β and Hsc70 interactions. The plot shows the change in interaction of 800 tested proteins with Hsp90β and Hsc70 (change is defined as LUMIER score drug – LUMIER score control). Proteins that show differential association with both chaperones are indicated in orange (both increase), blue (both decrease) or red (decrease in Hsp90β interaction, increase in Hsc70 interaction). Selected proteins are labeled.
Figure 5. Clustering of chaperones, co-chaperones and quality control based on similarities in client interaction profiles
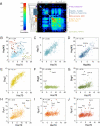
A) Chaperones, co-chaperones and protein quality control factors were clustered based on their interaction profiles with 800 query proteins. Clustering corresponds well to known biological complexes. Three components of the 19S proteasome (purple) cluster together, as do two prefoldin subunits (green). Hsp70 and its cofactors (yellow) and BAG proteins (red) cluster separately from Hsp90 and its cochaperones (blue). B) Significant correlation between Hsc70 and Hsp90 client interaction profiles. 800 proteins (light blue) were assayed for interaction with Hsc70 or Hsp90 by LUMIER. Hsp90 co-chaperones (red) interact exclusively with Hsp90 and Hsp70 co-chaperones (ochre) with Hsc70. Kinases (filled blue circles) interact generally more strongly with Hsp90 than with Hsc70, whereas p53 and HSF1 (green) prefer Hsc70. C) The client interaction profiles of Hsp70 isoforms Hsc70 and Hsp70 are highly similar. D) The client interaction profiles of Hsp90 isoforms Hsp90α and Hsp90β are highly similar. Most clients (blue) interact with Hsp90α and Hsp90β to a similar degree. The co-chaperones UNC45A and FKBP38 (filled blue circles) interact more strongly with Hsp90β. In contrast, UNC45A paralog UNC45B interacts with both isoforms to a similar degree. E) BAG2 interaction profile is almost identical to that of Hsc70, suggesting that it is a general co-factor for Hsp70 chaperones. In contrast, BAG3 (F) and BAG4 (G) are more specific, interacting primarily with small heat shock proteins Hsp22 and Hsp27 (BAG3) and the mRNA decapping factor DCP1B (BAG4) H) Rpn1 is a component of the proteasome regulatory particle and its interaction profile correlates significantly with that of Hsc70. In contrast, Rpn10 (I) and Rpn13 (J), also components of the core particle, mainly interact with other subunits of the proteasome. See also Figure S4
Figure 6. Quantitative view of the human protein folding landscape
800 query proteins (arranged in columns) were assayed for interaction with 60 different chaperones, co-chaperones and quality control factors (rows) with a quantitative LUMIER assay. Query proteins were clustered based on their interaction profiles. Some of the biologically coherent clusters are highlighted in more detail. Proteins that share the same fold or are part of the same biological complex in each cluster are indicated in color. (A) LRR proteins (red) and Argonaute proteins (orange) form distinct clusters. LRR proteins interact strongly with SGT1, while Argonaute proteins associate with PP5. (B) The R2TP complex members (purple) form two separate clusters. (C) Hsp90 co-chaperone cluster. (D) Kinases (orange) cluster together and interact specifically with CDC37 but not with CDC37L1. (E) NUDCD1 associates with DEAH/DEAD box helicases (green). (F) BAG proteins that cluster together interact strongly with Hsp70 proteins, Rpn1, Hsf1 and Hsf2. (G) Kelch domain protein cluster (brown) with NUDCD3. (H) Proteasome cluster. (I) RCC1 repeat protein FBXO24 (purple) interacts with NUDCD2. (J) G protein [.gamma] subunits (green) interact with prefoldins.
Figure 7. NUDC family proteins are specific co-chaperones for β-propeller domains
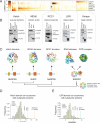
A) NUDC family co-chaperones, SGT1, and CDC37 were assayed with a quantitative LUMIER assay for interaction with 80 kinases, 156 LRR domain proteins, and 275 proteins with a β-propeller domain. Bait proteins are organized by domain (annotated below) and rank-sorted based on their interaction with a specific co-chaperone (kinases with CDC37, LRRs with SGT1, WD40 with NUDC, RCC1 with NUDCD2, Kelch with NUDCD3). B) Co-chaperones recognize specific domains in their clients. Indicated full-length proteins or truncated constructs were tagged with a 3xFLAG epitope and transfected into 293T cells. Their interaction with endogenous Hsp90 (top panel) or with endogenous, specific co-chaperone (middle panel) was assayed by co-immunoprecipitation. For NUDCD2, a 3xHA tagged construct was co-transfected with FBXO24 and the blot probed with an anti-HA antibody. C) Evolution of the NUDC protein family and their client specificity. NUDC, NUDCD2 and NUDCD3 each recognize distinct β-propeller folds. NUDCD1, in contrast, associates with proteins with an unrelated fold (RNA helicases and the COPI complex), but it itself contains a β-propeller domain. The COPI complex image used with permission from Science Magazine. D) Genomes that encode the Kelch-domain specific co-chaperone NUDCD3 contain significantly more proteins with Kelch domains than genomes without NUDCD3. The number of Kelch domains was analyzed in each of 147 fully sequenced eukaryotic proteomes. Normalized Kelch domain abundance (as a fraction of total number of proteins) was compared between species that have NUDCD3 ortholog and those that do not. Histograms display the t-statistic distribution for 10,000 random eukaryotic proteins that were assayed for similar evolutionary cooccurrence with Kelch domains. Orange line shows the t-statistic for NUDCD3 and black lines show the t-statistic for three other co-chaperones that are not Kelch-specific. E) Evolutionary analysis of LRR domain evolution with LRR-specific co-chaperone SGT1, performed as in D. See also Figure S5.
Similar articles
- Specific Binding of Tetratricopeptide Repeat Proteins to Heat Shock Protein 70 (Hsp70) and Heat Shock Protein 90 (Hsp90) Is Regulated by Affinity and Phosphorylation.
Assimon VA, Southworth DR, Gestwicki JE. Assimon VA, et al. Biochemistry. 2015 Dec 8;54(48):7120-31. doi: 10.1021/acs.biochem.5b00801. Epub 2015 Nov 25. Biochemistry. 2015. PMID: 26565746 Free PMC article. - Interplay between the Hsp90 Chaperone and the HslVU Protease To Regulate the Level of an Essential Protein in Shewanella oneidensis.
Honoré FA, Maillot NJ, Méjean V, Genest O. Honoré FA, et al. mBio. 2019 May 14;10(3):e00269-19. doi: 10.1128/mBio.00269-19. mBio. 2019. PMID: 31088919 Free PMC article. - The Hsp70-Hsp90 Chaperone Cascade in Protein Folding.
Morán Luengo T, Mayer MP, Rüdiger SGD. Morán Luengo T, et al. Trends Cell Biol. 2019 Feb;29(2):164-177. doi: 10.1016/j.tcb.2018.10.004. Epub 2018 Nov 28. Trends Cell Biol. 2019. PMID: 30502916 Review. - Evolution and function of diverse Hsp90 homologs and cochaperone proteins.
Johnson JL. Johnson JL. Biochim Biophys Acta. 2012 Mar;1823(3):607-13. doi: 10.1016/j.bbamcr.2011.09.020. Epub 2011 Oct 8. Biochim Biophys Acta. 2012. PMID: 22008467 Review. - Interaction of the Hsp90 cochaperone cyclophilin 40 with Hsc70.
Carrello A, Allan RK, Morgan SL, Owen BA, Mok D, Ward BK, Minchin RF, Toft DO, Ratajczak T. Carrello A, et al. Cell Stress Chaperones. 2004 Summer;9(2):167-81. doi: 10.1379/csc-26r.1. Cell Stress Chaperones. 2004. PMID: 15497503 Free PMC article.
Cited by
- Recruitment of Ahsa1 to Hsp90 is regulated by a conserved peptide that inhibits ATPase stimulation.
Hussein SK, Bhat R, Overduin M, LaPointe P. Hussein SK, et al. EMBO Rep. 2024 Aug;25(8):3532-3546. doi: 10.1038/s44319-024-00193-8. Epub 2024 Jun 27. EMBO Rep. 2024. PMID: 38937628 Free PMC article. - Structural Communication between the E. coli Chaperones DnaK and Hsp90.
Grindle MP, Carter B, Alao JP, Connors K, Tehver R, Kravats AN. Grindle MP, et al. Int J Mol Sci. 2021 Feb 23;22(4):2200. doi: 10.3390/ijms22042200. Int J Mol Sci. 2021. PMID: 33672263 Free PMC article. - A specific role for importin-5 and NASP in the import and nuclear hand-off of monomeric H3.
Pardal AJ, Bowman AJ. Pardal AJ, et al. Elife. 2022 Sep 6;11:e81755. doi: 10.7554/eLife.81755. Elife. 2022. PMID: 36066346 Free PMC article. - On the evolution of chaperones and cochaperones and the expansion of proteomes across the Tree of Life.
Rebeaud ME, Mallik S, Goloubinoff P, Tawfik DS. Rebeaud ME, et al. Proc Natl Acad Sci U S A. 2021 May 25;118(21):e2020885118. doi: 10.1073/pnas.2020885118. Proc Natl Acad Sci U S A. 2021. PMID: 34001607 Free PMC article. - HSP90β controls NLRP3 autoactivation.
Spel L, Hou C, Theodoropoulou K, Zaffalon L, Wang Z, Bertoni A, Volpi S, Hofer M, Gattorno M, Martinon F. Spel L, et al. Sci Adv. 2024 Mar;10(9):eadj6289. doi: 10.1126/sciadv.adj6289. Epub 2024 Feb 28. Sci Adv. 2024. PMID: 38416826 Free PMC article.
References
- Barrios-Rodiles M, Brown KR, Ozdamar B, Bose R, Liu Z, Donovan RS, Shinjo F, Liu Y, Dembowy J, Taylor IW, et al. High-throughput mapping of a dynamic signaling network in mammalian cells. Science. 2005;307:1621–1625. - PubMed
- Briknarová K, Takayama S, Homma S, Baker K, Cabezas E, Hoyt DW, Li Z, Satterthwait AC, Ely KR. BAG4/SODD protein contains a short BAG domain. J Biol Chem. 2002;277:31172–31178. - PubMed
Publication types
MeSH terms
Substances
Grants and funding
- GM081871/GM/NIGMS NIH HHS/United States
- P30 CA014051/CA/NCI NIH HHS/United States
- R01 GM094231/GM/NIGMS NIH HHS/United States
- 5R01GM94231/GM/NIGMS NIH HHS/United States
- R01 GM081871/GM/NIGMS NIH HHS/United States
- MOP-84314/CAPMC/ CIHR/Canada
LinkOut - more resources
Full Text Sources
Other Literature Sources
Molecular Biology Databases
Research Materials


