Autophagy defends pancreatic β cells from human islet amyloid polypeptide-induced toxicity - PubMed (original) (raw)
Autophagy defends pancreatic β cells from human islet amyloid polypeptide-induced toxicity
Jacqueline F Rivera et al. J Clin Invest. 2014 Aug.
Abstract
Type 2 diabetes (T2D) is characterized by a deficiency in β cell mass, increased β cell apoptosis, and extracellular accumulation of islet amyloid derived from islet amyloid polypeptide (IAPP), which β cells coexpress with insulin. IAPP expression is increased in the context of insulin resistance, the major risk factor for developing T2D. Human IAPP is potentially toxic, especially as membrane-permeant oligomers, which have been observed to accumulate within β cells of patients with T2D and rodents expressing human IAPP. Here, we determined that β cell IAPP content is regulated by autophagy through p62-dependent lysosomal degradation. Induction of high levels of human IAPP in mouse β cells resulted in accumulation of this amyloidogenic protein as relatively inert fibrils within cytosolic p62-positive inclusions, which temporarily averts formation of toxic oligomers. Mice hemizygous for transgenic expression of human IAPP did not develop diabetes; however, loss of β cell-specific autophagy in these animals induced diabetes, which was attributable to accumulation of toxic human IAPP oligomers and loss of β cell mass. In human IAPP-expressing mice that lack β cell autophagy, increased oxidative damage and loss of an antioxidant-protective pathway appeared to contribute to increased β cell apoptosis. These findings indicate that autophagy/lysosomal degradation defends β cells against proteotoxicity induced by oligomerization-prone human IAPP.
Figures
Figure 9. mRNA levels of the antioxidant genes Gstm1 and Sod1 in islets from hemizygous h-IAPP transgenic mice deficient in autophagy.
Levels of Gstm1 and Sod1 mRNA were evaluated by RT-qPCR in islets isolated from control (9 weeks, n = 4), h-IAPP+/– (9 weeks, n = 3), Atg7Δβcell (9 weeks, n = 3), and h-IAPP+/–:Atg7Δβcell (9 weeks, n = 3) mice. Cyclophilin was used as housekeeping gene. Data are expressed as mean ± SEM; *P < 0.05; **P < 0.01; #P < 0.05, versus Atg7Δβcell mice.
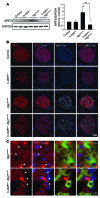
Figure 8. Antioxidant NRF2 is reduced in hemizygous h-IAPP transgenic mice deficient in autophagy.
(A) Protein levels of NRF2 were assessed by Western blot using islet lysates obtained from control (9 weeks, n = 3), h-IAPP+/– (9 weeks, n = 3), Atg7Δβcell (9 weeks, n = 3), and h-IAPP+/–:Atg7Δβcell mice (9 weeks, n = 3). GAPDH was used as loading control. The graph represents the quantification of NRF2 protein levels. Data are expressed as mean ± SEM; *P < 0.05; #P < 0.05, versus control and h-IAPP+/– mice. (B) NRF2 and p62 levels were assessed by immunofluorescence in pancreatic sections from control, h-IAPP+/–, Atg7Δβcell, and h-IAPP+/–:Atg7Δβcell mice (NRF2, red; p62, white; nuclei, blue). Scale bar: 50 μm. (C) Images of islets from Atg7Δβcell and h-IAPP+/–:Atg7Δβcell mice showing cytosolic and nuclear staining of NRF2 (NRF2, red; IAPP, green; nuclei, blue). Arrows indicate nuclei. Scale bar: 12 μm.
Figure 7. Deficiency in autophagy increases the oxidative damage in β cells of hemizygous h-IAPP transgenic mice.
(A) Nitrotyrosine levels were assessed by immunofluorescence in pancreatic tissue from control, h-IAPP+/–, Atg7Δβcell, and h-IAPP+/–:Atg7Δβcell mice (nitrotyrosine, red; IAPP, white; nuclei, blue). The insets show higher magnification. (B) Quantification of the fractional area of β cell positive for nitrotyrosine (signal above background) in Atg7Δβcell (15 weeks, n = 3) and h-IAPP+/–:Atg7Δβcell mice (12 ± 1 weeks, n = 3) (expressed in percentage). 10–17 islets per section were analyzed. Data are expressed as mean ± SEM; **P < 0.01. Scale bar: 50 μm.
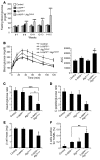
Figure 6. Deficiency in autophagy induces diabetes, impaired β cell function, loss of β cell mass, and increased β cell apoptosis in hemizygous h-IAPP transgenic mice.
(A) Fasting blood glucose in control, h-IAPP+/–, Atg7Δβcell, and h-IAPP+/–:Atg7Δβcell mice. The number of mice per group of a given age is provided in Supplemental Table 1. ***P < 0.001. (B) IPGTT performed by intraperitoneal injection of 2 g/kg glucose in control and h-IAPP+/–:Atg7Δβcell mice (both 8 weeks, n = 6) and h-IAPP+/– and Atg7Δβcell mice (both 8 weeks, n = 7). The graph represents area under the curve (AUC). #P < 0.05, versus h-IAPP+/– mice; ***P < 0.001, versus Atg7Δβcell mice. (C) Plasma insulin/glucose ratio and (D) C-peptide/glucose ratio in control (14 ± 1 weeks, n = 8), h-IAPP+/– (14 ± 1 weeks, n = 8), Atg7Δβcell (15 weeks, n = 4), and h-IAPP+/–:Atg7Δβcell (12 ± 1 weeks, n = 6) mice. *P < 0.05, versus Atg7Δβcell and h-IAPP+/– mice for C-peptide/glucose ratio; ***P < 0.001. (E) β Cell mass in the 4 groups of mice at given mean age: control (14 ± 1 weeks, n = 4), h-IAPP+/– (14 ± 1 weeks, n = 4), Atg7Δβcell (15 weeks, n = 3), and h-IAPP+/–:Atg7Δβcell mice (12 ± 1 weeks, n = 6). *P < 0.05, versus all groups. (F) β Cell apoptosis (TUNEL) in the 4 groups of mice at given mean age: control (13 ± 1 weeks, n = 3), h-IAPP+/– (13 ± 2 weeks, n = 3), Atg7Δβcell (15 weeks, n = 3), and h-IAPP+/–:Atg7Δβcell (12 ± 1 weeks, n = 3) mice. *P < 0.05, versus Atg7Δβcell mice; **P < 0.01, versus h-IAPP+/– mice. Data are expressed as mean ± SEM.
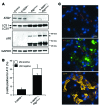
Figure 5. h-IAPP toxic oligomers accumulate in β cells of hemizygous h-IAPP transgenic mice deficient in autophagy.
(A) Protein levels of ATG7, LC3, and p62 were assessed by Western blot using islet protein lysates obtained from Atg7Δβcell (9 weeks, n = 3) mice and control, h-IAPP+/–, and h-IAPP+/–:Atg7Δβcell (all 9 weeks, n = 4) mice. GAPDH was used as loading control. The asterisk indicates tightly aggregated p62. (B) Quantification of the percentage of β cells positive for cytosolic A11 labeling in h-IAPP+/–:Atg7Δβcell and h-IAPP+/– mice. Included are the percentages of β cells positive (white) or negative (black) for p62 among A11-positive β cells. Data are expressed as mean ± SEM. (C) Confocal images of a representative islet from a h-IAPP+/–:Atg7Δβcell mouse pancreatic section stained with anti-oligomer antibody A11 (oligomers, red; p62, green; IAPP, yellow; nuclei, blue). Scale bar: 24 μm.
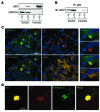
Figure 4. Insoluble p62-sequestered IAPP is targeted for lysosomal degradation.
(A) Islets were isolated from 9- to 10-week-old r-TG and h-TG mice. Islet lysates were used to separate total cellular protein into soluble and insoluble fractions. Levels of p62 and IAPP were assessed by Western blot. GAPDH was used as control. A representative image from 4 independent experiments is shown. (B) Soluble and insoluble fractions from mouse islets were subjected to immunoprecipitation with anti-p62 antibody. Immunoprecipitated proteins were resolved by SDS-PAGE and immunoblotted with anti-IAPP antibody. (C) Thioflavine S staining in pancreatic sections from 9- to 10-week-old h-TG mice (Thioflavin S, green; p62, red; insulin, yellow; nuclei, blue) (scale bar: 20 μm). A higher magnification of an inclusion is presented on the right (scale bar: 10 μm). The dotted outlines on the insulin panel indicate the position of thioflavin S– and p62-positive inclusions. (D) Fluorescent confocal images of p62-positive inclusion using (p62, yellow; LC3, red; cathepsin D, green) in pancreatic tissue from h-TG mice (original magnification, ×63). Scale bar: 10 μm.
Figure 3. IAPP is ubiquitinated.
(A) Islets were isolated from 4- to 6-month-old WT and HIP rats. Islet lysates were subjected to immunoprecipitation with a rabbit anti-IAPP antibody. Immunoprecipitated proteins were resolved by SDS-PAGE and immunoblotted with a mouse anti-ubiquitin antibody. Levels of IAPP are shown as control. Arrows indicate polyubiquitinated IAPP (n = 3). (B) Islets were isolated from 4- to 6-month-old HIP rats. Insoluble fraction was obtained by a detergent extraction protocol and dissolved in 6 M guanidine plus 0.5 M DTT for 1 hour at 37°C. Fractions were collected by HPLC and then immunoblotted with a rabbit anti-IAPP antibody. The membrane was then stripped and immunoblotted with a mouse anti-ubiquitin antibody. A representative blot from 2 independent experiments is shown. Boxes indicate bands detected by both anti-IAPP and anti-ubiquitin antibodies.
Figure 2. IAPP interacts with p62 in β cells.
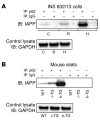
(A) INS 832/13 cells were transduced at 400 MOI for 36 hours with r-IAPP (R) or h-IAPP (H) adenoviruses. Cell lysates were subjected to immunoprecipitation (IP) with anti-p62 antibody or IgG as control. Immunoprecipitated proteins were resolved by SDS-PAGE and immunoblotted (IB) with anti-IAPP antibody. Levels of GAPDH are shown as internal and loading control. A representative image from 5 independent experiments is shown. C, nontransduced cells (B) Islets were isolated from 9- to 10-week-old WT, r-IAPP (r-TG), and homozygous h-IAPP transgenic (h-TG) mice. Islet lysates were subjected to immunoprecipitation with anti-p62 antibody or IgG as control. Immunoprecipitated proteins were resolved by SDS-PAGE and immunoblotted with anti-IAPP antibody. Levels of GAPDH are shown as internal and loading control. A representative image from 3 independent experiments is shown.
Figure 1. Intracellular IAPP levels are modulated by regulators of autophagy.
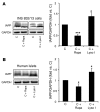
(A) INS 832/13 cells were treated with rapamycin (Rapa, 10 nM) for 40 hours, lysosomal inhibitors (Lyso I) (E-64-d, 10 μg/ml and pepstatin A, 10 μg/ml) for 24 hours, or left untreated (C). Levels of IAPP were assessed by Western blot. GAPDH was used as loading control. The graph represents the quantification of the processed/mature form of IAPP (n = 4). (B) Human islets were treated with rapamycin (10 nM) for 30 hours, lysosomal inhibitors (E-64-d, 10 μg/ml and pepstatin A, 10 μg/ml) for 30 hours, or left untreated. Levels of IAPP were assessed by Western blot. GAPDH was used as loading control. The graph represents the quantification of IAPP protein levels (n = 3). Data are expressed as mean ± SEM; *P < 0.05; ***P < 0.001.
Comment in
- Islet amyloid and type 2 diabetes: overproduction or inadequate clearance and detoxification?
Gupta D, Leahy JL. Gupta D, et al. J Clin Invest. 2014 Aug;124(8):3292-4. doi: 10.1172/JCI77506. Epub 2014 Jul 18. J Clin Invest. 2014. PMID: 25036704 Free PMC article. - Diabetes: Protective role of autophagy in pancreatic β cells.
Osório J. Osório J. Nat Rev Endocrinol. 2014 Oct;10(10):575. doi: 10.1038/nrendo.2014.144. Epub 2014 Aug 12. Nat Rev Endocrinol. 2014. PMID: 25112233 No abstract available.
Similar articles
- Human-IAPP disrupts the autophagy/lysosomal pathway in pancreatic β-cells: protective role of p62-positive cytoplasmic inclusions.
Rivera JF, Gurlo T, Daval M, Huang CJ, Matveyenko AV, Butler PC, Costes S. Rivera JF, et al. Cell Death Differ. 2011 Mar;18(3):415-26. doi: 10.1038/cdd.2010.111. Epub 2010 Sep 3. Cell Death Differ. 2011. PMID: 20814419 Free PMC article. - UCHL1 deficiency exacerbates human islet amyloid polypeptide toxicity in β-cells: evidence of interplay between the ubiquitin/proteasome system and autophagy.
Costes S, Gurlo T, Rivera JF, Butler PC. Costes S, et al. Autophagy. 2014 Jun;10(6):1004-14. doi: 10.4161/auto.28478. Autophagy. 2014. PMID: 24879150 Free PMC article. - Human IAPP-induced pancreatic β cell toxicity and its regulation by autophagy.
Shigihara N, Fukunaka A, Hara A, Komiya K, Honda A, Uchida T, Abe H, Toyofuku Y, Tamaki M, Ogihara T, Miyatsuka T, Hiddinga HJ, Sakagashira S, Koike M, Uchiyama Y, Yoshimori T, Eberhardt NL, Fujitani Y, Watada H. Shigihara N, et al. J Clin Invest. 2014 Aug;124(8):3634-44. doi: 10.1172/JCI69866. Epub 2014 Jul 18. J Clin Invest. 2014. PMID: 25036706 Free PMC article. - Islet amyloid polypeptide (IAPP) transgenic rodents as models for type 2 diabetes.
Matveyenko AV, Butler PC. Matveyenko AV, et al. ILAR J. 2006;47(3):225-33. doi: 10.1093/ilar.47.3.225. ILAR J. 2006. PMID: 16804197 Review. - Causative factors for formation of toxic islet amyloid polypeptide oligomer in type 2 diabetes mellitus.
Jeong HR, An SS. Jeong HR, et al. Clin Interv Aging. 2015 Nov 19;10:1873-9. doi: 10.2147/CIA.S95297. eCollection 2015. Clin Interv Aging. 2015. PMID: 26604727 Free PMC article. Review.
Cited by
- Involvement of TGF-β and Autophagy Pathways in Pathogenesis of Diabetes: A Comprehensive Review on Biological and Pharmacological Insights.
Heydarpour F, Sajadimajd S, Mirzarazi E, Haratipour P, Joshi T, Farzaei MH, Khan H, Echeverría J. Heydarpour F, et al. Front Pharmacol. 2020 Sep 15;11:498758. doi: 10.3389/fphar.2020.498758. eCollection 2020. Front Pharmacol. 2020. PMID: 33041786 Free PMC article. Review. - Research progress on the mechanism of beta-cell apoptosis in type 2 diabetes mellitus.
You S, Zheng J, Chen Y, Huang H. You S, et al. Front Endocrinol (Lausanne). 2022 Aug 18;13:976465. doi: 10.3389/fendo.2022.976465. eCollection 2022. Front Endocrinol (Lausanne). 2022. PMID: 36060972 Free PMC article. Review. - Amyloid Proteins and Peripheral Neuropathy.
Asiri MMH, Engelsman S, Eijkelkamp N, Höppener JWM. Asiri MMH, et al. Cells. 2020 Jun 26;9(6):1553. doi: 10.3390/cells9061553. Cells. 2020. PMID: 32604774 Free PMC article. Review. - β Cell-specific increased expression of calpastatin prevents diabetes induced by islet amyloid polypeptide toxicity.
Gurlo T, Costes S, Hoang JD, Rivera JF, Butler AE, Butler PC. Gurlo T, et al. JCI Insight. 2016 Nov 3;1(18):e89590. doi: 10.1172/jci.insight.89590. JCI Insight. 2016. PMID: 27812546 Free PMC article. - PRKAA2, MTOR, and TFEB in the regulation of lysosomal damage response and autophagy.
Shariq M, Khan MF, Raj R, Ahsan N, Kumar P. Shariq M, et al. J Mol Med (Berl). 2024 Mar;102(3):287-311. doi: 10.1007/s00109-023-02411-7. Epub 2024 Jan 6. J Mol Med (Berl). 2024. PMID: 38183492 Review.
References
Publication types
MeSH terms
Substances
Grants and funding
- AG033069/AG/NIA NIH HHS/United States
- 2P30DK04301/DK/NIDDK NIH HHS/United States
- F32 DK090995/DK/NIDDK NIH HHS/United States
- DK059579/DK/NIDDK NIH HHS/United States
- R01 AG033069/AG/NIA NIH HHS/United States
- CA-016042/CA/NCI NIH HHS/United States
- P30 CA016042/CA/NCI NIH HHS/United States
- P30 DK041301/DK/NIDDK NIH HHS/United States
- DK090995/DK/NIDDK NIH HHS/United States
- R01 DK059579/DK/NIDDK NIH HHS/United States
LinkOut - more resources
Full Text Sources
Other Literature Sources
Molecular Biology Databases

