Functional polarization of tumour-associated macrophages by tumour-derived lactic acid - PubMed (original) (raw)
. 2014 Sep 25;513(7519):559-63.
doi: 10.1038/nature13490. Epub 2014 Jul 13.
Ngoc-Quynh Chu 2, Alison L Szabo 2, Thach Chu 2, Anne Marie Rhebergen 2, Vikram Jairam 2, Nika Cyrus 2, Carolyn E Brokowski 2, Stephanie C Eisenbarth 3, Gillian M Phillips 4, Gary W Cline 5, Andrew J Phillips 4, Ruslan Medzhitov 6
Affiliations
- PMID: 25043024
- PMCID: PMC4301845
- DOI: 10.1038/nature13490
Functional polarization of tumour-associated macrophages by tumour-derived lactic acid
Oscar R Colegio et al. Nature. 2014.
Abstract
Macrophages have an important role in the maintenance of tissue homeostasis. To perform this function, macrophages must have the capacity to monitor the functional states of their 'client cells': namely, the parenchymal cells in the various tissues in which macrophages reside. Tumours exhibit many features of abnormally developed organs, including tissue architecture and cellular composition. Similarly to macrophages in normal tissues and organs, macrophages in tumours (tumour-associated macrophages) perform some key homeostatic functions that allow tumour maintenance and growth. However, the signals involved in communication between tumours and macrophages are poorly defined. Here we show that lactic acid produced by tumour cells, as a by-product of aerobic or anaerobic glycolysis, has a critical function in signalling, through inducing the expression of vascular endothelial growth factor and the M2-like polarization of tumour-associated macrophages. Furthermore, we demonstrate that this effect of lactic acid is mediated by hypoxia-inducible factor 1α (HIF1α). Finally, we show that the lactate-induced expression of arginase 1 by macrophages has an important role in tumour growth. Collectively, these findings identify a mechanism of communication between macrophages and their client cells, including tumour cells. This communication most probably evolved to promote homeostasis in normal tissues but can also be engaged in tumours to promote their growth.
Conflict of interest statement
Author InformationThe authors declare no competing financial interests. Readers are welcome to comment on the online version of the paper.
Figures
Extended Data Figure 1. Tissue density and histological features of TAMs
a, LLC and B16 tumours excised at day 19 and stained for F4/80 reveal a similar distribution pattern of macrophages at the periphery and within the centre of the tumours. b, Immunohistochemistry of B16 and LLC cells injected subcutaneously and harvested on day 19. Stains are for F4/80 (B16) and CD11b (LLC). c, d, The density of TAMs within tumours is conserved and depends on the tumour type. LLC (n = 10), B16 (n = 10) and CT26 (n = 5) tumours were harvested 19 days after subcutaneous injection. c, The percentage of macrophages that were F4/80+CD11b+ was determined by FACS analysis. (#, P = 0.0128; *P < 0.0001 using a two-tailed, unpaired _t_-test). The histograms represent the mean ± s.e.m. Whereas an F test revealed no significant difference in the variance between B16 and CT26, there was a significant difference (P = 0.0128) in the variance between B16 and LLC. Non-parametric analysis using the Mann–Whitney test revealed a significant difference in the percentage of macrophages between LLC and B16 tumours (P = 0.0007) and between CT26 and B16 tumours (P = 0.0007). d, FACS plot of B16 and LLC tumours harvested at day 19 after subcutaneous injection and stained for F4/80 and CD11b. e, Cytology of sorted peritoneal macrophages (PMΦ) and TAMs. The cytology is representative often different experiments.
Extended Data Figure 2. Tumour-conditioned medium stabilizes HIF1α and induces expression of Vegf and Arg1
a. Western blotting of HIF1α and actin on cells grown under conditions of normoxia (N; 20.0% O2) or hypoxia (H; 0.1% O2) or stimulated with control DMEM (C) or LLC-tumour-conditioned medium (LLC). b, c, Luciferase reporter assay of 293T cells transfected with a HIF1α oxygen-dependent domain–luciferase reporter (for protein stabilization) and a Vegf promoter–luciferase reporter (for gene expression). d, e, Expression analysis by qPCR of Hif1a I.1, Hif1a I.2, Pgc1a and Pgc1b mRNA in bone-marrow-derived macrophages stimulated with LLC tumour-conditioned medium, f–h, The active factor in tumour-conditioned medium is <3 kDa and is heat stable. Western blotting for ARG1 in bone-marrow-derived macrophages (f). Expression analysis by qPCR of Vegf mRNA in bone-marrow-derived macrophages (g). Expression analysis by qPCR of Vegf and Arg1 mRNA in bone-marrow-derived macrophages stimulated with boiled (100 °C) or non-boiled LLC tumour-conditioned medium (h). i, j, Adenosine and low pH do not induce the Vegf gene. Expression analysis by qPCR of Vegf mRNA in bone-marrow-derived macrophages stimulated as follows: control medium (DMEM), 50ng ml−1 lipopolysaccharide (LPS) plus the adenosine agonist NECA (10 μM 5′_-N_-ethylcarboxamidoadenosine), LLC-tumour-conditioned medium, and boiled LLC tumour-conditioned medium, all ± 1 μM ZM241385 (an adenosine A2A receptor inhibitor) (i); macrophage growth medium titrated to a range of pHs using sterile HCl (j). LLC-tumour-conditioned medium has a pH of 6.8. Where indicated, the relative expression histograms represent three biological replicates displayed as the mean ± s.e.m.
Extended Data Figure 3. The splice isoform PKM2 is the predominant isoform expressed in tumour cell lines that produce high concentrations of lactic acid in vitro and in vivo
a, b, Expression analysis by qPCR of Pkm1 and Pkm2 mRNA in tissues from wild-type mice and from four tumour cell lines, normalized to Actb and Rpl13a as housekeeping genes. c, Expression analysis by qPCR of Pkm1 and Pkm2 mRNA in tissues from wild-type mice and from six tumour cell lines. qPCR results were normalized to the housekeeping gene Rpl13a. d, e, The in vivo intratumoral lactate levels in LLC and B16 tumours correspond to the concentrations that have been determined to activate macrophages in vitro. Lactate concentration (mM) in control (DMEM) or LLC-tumour-conditioned medium (unfractionated, <3-kDa fraction and >3-kDa fraction). Most of the lactic acid is present in the <3-kDa fraction (d). The mean in vivo lactic acid concentrations in LLC and B16 tumours were measured using hydrophilic interaction chromatography and mass spectroscopy (e). All relative expression histograms represent three biological replicates displayed as mean ± s.e.m. BAT, brown adipose tissue; WAT, white adipose tissue.
Extended Data Figure 4. Lactic acid induces Vegf at 6 h and Arg1 at 24 h in bone-marrow-derived macrophages
a, Expression analysis by qPCR of Vegf mRNA in bone-marrow-derived macrophages stimulated with LLC-tumour-conditioned medium at 0 h, 1 h, 6 h and 24 h. b, Expression analysis by qPCR of Arg1 mRNA in bone-marrow-derived macrophages cultured under normoxic conditions (20% O2), hypoxic conditions (0.1% O2) and with 25 mM lactic acid, at 6 h and 24 h. c, Time course of Vegf and Arg1 induction by lactic acid (25 mM), hypoxia (0.1% O2) and lactic acid plus hypoxia in bone-marrow-derived macrophages. Expression analysis by qPCR of Vegf and Arg1 mRNA in wild-type (WT) or Hif1a knockout (KO) bone-marrow-derived macrophages at 0 h, 6 h, 24 h and 48 h. Where indicated, the relative expression histograms represent three biological replicates displayed as mean ± s.e.m.
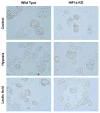
Extended Data Figure 5. Neither lactic acid nor hypoxia induces foamy cell morphology in peritoneal macrophages
Wild-type (WT) or Hif1a knockout (KO) peritoneal macrophages were plated in control medium (DMEM) or stimulated with lactic acid (25 mM) or hypoxia (0.1%) for 24 h.
Extended Data Figure 6. Inhibition of monocarboxylate transporters abrogates the activity of lactic acid
a, Expression analysis by qPCR of bone-marrow-derived macrophages stimulated with unfractionated or fractionated (<3kDa and >3kDa) control or LLC-tumour-conditioned medium ±5 mM CHC (α-cyano-4-hydroxycinnamate), a monocarboxylate channel transporter inhibitor. b, Acidic pH is necessary for the effect of lactate on bone-marrow-derived macrophages. Expression analysis by qPCR of bone-marrow-derived macrophages stimulated for 6 h with lactic acid, calcium lactate, HCl plus calcium chloride, or HCl plus calcium lactate. c, Effect of lactic acid on LLC, B16 and CT26 tumour cells. Expression analysis by qPCR of LLC, B16 and CT26 tumour cells stimulated for 6h (Vegf, left) and 24h (Arg1, right). Where indicated, the relative expression histograms represent three biological replicates displayed as mean ± s.e.m.
Extended Data Figure 7. TAMs from LLC tumours express a unique profile of TAM-associated and M2-associated markers compared with peritoneal macrophages
Expression analysis by qPCR of FACS-sorted peritoneal macrophages and LLC TAMs. Results using either Rpl13a or Actb as a housekeeping gene are shown.
Extended Data Figure 8. A subset of TAM markers can be induced by lactic acid and require HIF1α
Expression analysis by qPCR of MHC II, Mrc1 and Cd11c mRNA from the following cell types: bone-marrow-derived macrophages stimulated with 25 mM lactic acid (a); TAMs from LLC tumours resected from mice with macrophages that are either wild-type (WT; C57BL/6J) or in which Hif1a has been deleted (b). Where indicated, the relative expression histograms represent three biological replicates displayed as mean ± s.e.m.
Extended Data Figure 9. Lactic acid is oxidized by and activates TAMs, characterized by the induction of Arg1, which is important for tumour growth
a, Lactic acid stimulation of bone-marrow-derived macrophages results in larger tumours when these macrophages are co-injected with LLC cells. The growth rate of LLC tumours in which LLC cells were co-injected 1:1 with bone-marrow-derived macrophages that had been stimulated for 24 h with either control DMEM (n = 15) or 25 mM lactic acid (n = 12) is shown. The tumour volumes were calculated using the formula (width)2 × length × 0.52 (ref. 23); *P = 0.0305 on day 14; #P < 0.0001 on day 16, using a two-tailed, unpaired _t_-test. Whereas the F test revealed no significant difference in variance between the groups on day 14, there was a significant difference (P = 0.0477) in the variance between the groups on day 16. Non-parametric analysis using the Mann–Whitney test revealed a significant difference between the groups on both days 14 (P = 0.0240) and 16 (P = 0.0467). The data are presented as the mean volume ± s.e.m. b, TAMs oxidize more 14C-lactic acid to CO2 than bone-marrow-derived macrophages and cultured LLC cells. TAMs, all other tumour cells (AO), bone-marrow-derived macrophages and LLC cells (1 × 10⁶) were cultured for 2 h in DMEM containing 100 μCi of 14C-laclic acid. c, d, Deletion of Arg1 in macrophages slows the growth of LLC and B16 tumours. c, The images are representative of LLC tumours from wild-type (WT) and Arg1 KO mice. d, The growth rate of B16 tumours in mice with WT (n = 9) versus Arg1 KO (n = 9) macrophages. The tumour volumes were calculated using the formula (width)2 × length × 0.52 (ref. 23). The data are presented as the mean ± s.e.m. P < 0.05 on days 9 and 10 using a two-tailed, unpaired _t_-test. The F test revealed no significant difference in variance between the compared groups.
Extended Data Figure 10. TAMs express higher levels of urea cycle enzymes than all other tumour cells from LLC tumours
Expression analysis by qPCR of Cps1, Otc, Ass1, Asl, Arg1, Glul and Gpt mRNA in FACS-sorted TAMs and all other (AO) tumour cells from day 19 LLC tumours.
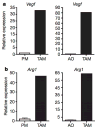
Figure 1. TAMs express high levels of Vegf and Arg1 mRNA
a, b, Expression analysis by quantitative PCR (qPCR) of Vegf and Arg1 mRNA in FACS-sorted peritoneal macrophages (PM), TAMs and all other cells (AO) within the tumour from day 19 LLC tumours. Expression is shown relative to the left histogram bar.
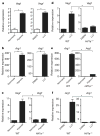
Figure 2. A soluble factor in tumour-conditioned medium induces Vegf and Arg1 via HIF1α
a, b, Expression analysis by qPCR of Vegf (a) and Arg1 (b) mRNA in bone-marrow-derived macrophages grown under conditions of normoxia (20% O2) or hypoxia (0.1% O2) (left panels) or stimulated with control medium (DMEM) or LLC-tumour-conditioned medium (right panels). c–f, Expression analysis by qPCR of Vegf (c, d) and Arg1 (e, f) mRNA in wild-type (WT) and Hif1a−/− bone-marrow-derived macrophages stimulated with LLC-tumour-conditioned medium (d, f) or hypoxia (0.1% O2) (c, e). The histogram bars represent the expression level of three biological replicates (relative to the left histogram bar), displayed as mean ± s.e.m. *P < 0.01, using a two-tailed, unpaired _t_-test. All experiments were performed at least twice.
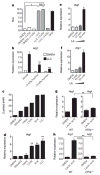
Figure 3. Lactic acid is sufficient to induce Vegf and Arg1 via HIF1α
a, b, Control (DMEM) or LLC-tumour-conditioned medium was used unfractionated (whole) or as <3-kDa or >3-kDa fractions to stimulate cells as follows. A luciferase reporter assay of 293T cells transfected with HIF1α oxygen-dependent domain (ODD)-luciferase was carried out to measure protein stabilization of the ODD; deferoxamine (DFO) was used as a hypoxia mimetic (a). Expression analysis by qPCR of Arg1 mRNA in bone-marrow-derived macrophages (b). c, Lactic acid concentration in the tumour-conditioned media from five tumour cell lines, collected after culturing at confluence for 4 days. d, Expression analysis by qPCR of Vegf mRNA in bone-marrow-derived macrophages stimulated with the tumour-conditioned media in c. e, f, Expression analysis by qPCR of Vegf (e) and Arg1 (f) mRNA in bone-marrow-derived macrophages cultured with a concentration gradient of lactic acid (LA). g, h, Expression analysis by qPCR of Vegf and Arg1 mRNA in wild-type (WT) and Hif1a−/− bone-marrow-derived macrophages. b–h, The histogram bars represent the expression level of three biological replicates (relative to expression in DMEM), displayed as mean ± s.e.m. *P < 0.0001; **P < 0.001, using a two-tailed, unpaired _t_-test. All experiments were performed at least twice. NS, not significant; RLA, relative luciferase activity.
Figure 4. Lactic acid polarizes macrophages to an M2-Iike state that is critical for tumour growth
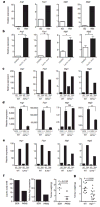
a–e, Expression analysis by qPCR of Arg1, Fizz1, Mgl1 and Mgl2 mRNA in the following cell types: TAMs and all other tumour cells (AO) from LLC tumours resected from wild-type (WT, C57BL/6J) mice (a), bone-marrow-derived macrophages stimulated with 25 mM lactic acid (LA) (b), TAMs and AO from LLC tumours resected from mice with either WT or Hif1a−/− macrophages (c), WT or Hif1a−/− bone-marrow-derived macrophages stimulated with control medium (DMEM) or IL-4 (10 ng ml−1) (d), and TAMs and AO from CT26 colon carcinoma tumours resected from mice with WT (BALB/c) or Il4ra−/− macrophages (e). f, Intratumoral lactic acid concentrations (mM) from tumours of LLC cells that had been stably transfected with a scrambled short hairpin RNA (shRNA) construct (SCR) or an shRNA targeting Pkm2 (centre panel). Expression analysis by qPCR of Arg1 mRNA in TAMs isolated from SCR-transfected and _Pkm2_-knockdown tumours. Weight of LLC tumours from cells bearing an SCR construct (mean ± s.e.m., 2.402 ± 0.310 g; n = 5) or Pkm2 shRNA construct (mean ± s.e.m, 0.8820 ± 0.341 g; n = 4); P = 0.0132 using a two-tailed, unpaired _t_-test (right panel). The F test revealed no significant difference in variance between the compared groups. g, Weight of LLC tumours resected on day 19 from mice with WT macrophages (mean ± s.e.m., 1.74 ± 0.161 g; n = 11) or ARG1-deficient macrophages (mean ± s.e.m., 0.965 ± 0.163 g; n = 13); P < 0.0028 using a two-tailed, unpaired _t_-test. The F test revealed no significant difference in variance between the compared groups. a–f, The histogram bars represent the expression level of three biological replicates, displayed as mean ± s.e.m., relative to AO (a, c, e, f) or DMEM (b, d). *P < 0.05; **P < 0.001, using a two-tailed, unpaired _t_-test. All experiments were performed at least twice. NS, not significant.
Comment in
- Tumor cells hijack macrophages via lactic acid.
Bronte V. Bronte V. Immunol Cell Biol. 2014 Sep;92(8):647-9. doi: 10.1038/icb.2014.67. Epub 2014 Aug 5. Immunol Cell Biol. 2014. PMID: 25091608 No abstract available.
Similar articles
- The supernatant of apoptotic cells causes transcriptional activation of hypoxia-inducible factor-1alpha in macrophages via sphingosine-1-phosphate and transforming growth factor-beta.
Herr B, Zhou J, Werno C, Menrad H, Namgaladze D, Weigert A, Dehne N, Brüne B. Herr B, et al. Blood. 2009 Sep 3;114(10):2140-8. doi: 10.1182/blood-2009-01-201889. Epub 2009 Jun 23. Blood. 2009. PMID: 19549990 - Tumour hypoxia promotes melanoma growth and metastasis via High Mobility Group Box-1 and M2-like macrophages.
Huber R, Meier B, Otsuka A, Fenini G, Satoh T, Gehrke S, Widmer D, Levesque MP, Mangana J, Kerl K, Gebhardt C, Fujii H, Nakashima C, Nonomura Y, Kabashima K, Dummer R, Contassot E, French LE. Huber R, et al. Sci Rep. 2016 Jul 18;6:29914. doi: 10.1038/srep29914. Sci Rep. 2016. PMID: 27426915 Free PMC article. - Identification of hypoxia-induced metabolism-associated genes in canine tumours.
Kato T, Sakurai M, Watanabe K, Mizukami Y, Nakagawa T, Baba K, Mizuno T, Igase M. Kato T, et al. Vet Comp Oncol. 2024 Sep;22(3):367-376. doi: 10.1111/vco.12979. Epub 2024 May 7. Vet Comp Oncol. 2024. PMID: 38712488 - pHi, aerobic glycolysis and vascular endothelial growth factor in tumour growth.
Pouysségur J, Franchi A, Pagès G. Pouysségur J, et al. Novartis Found Symp. 2001;240:186-96; discussion 196-8. doi: 10.1002/0470868716.ch13. Novartis Found Symp. 2001. PMID: 11727929 Review. - Lactate: A Metabolic Driver in the Tumour Landscape.
Ippolito L, Morandi A, Giannoni E, Chiarugi P. Ippolito L, et al. Trends Biochem Sci. 2019 Feb;44(2):153-166. doi: 10.1016/j.tibs.2018.10.011. Epub 2018 Nov 22. Trends Biochem Sci. 2019. PMID: 30473428 Review.
Cited by
- Tumor Microenvironment Immunosuppression: A Roadblock to CAR T-Cell Advancement in Solid Tumors.
Johnson A, Townsend M, O'Neill K. Johnson A, et al. Cells. 2022 Nov 16;11(22):3626. doi: 10.3390/cells11223626. Cells. 2022. PMID: 36429054 Free PMC article. Review. - Lactate: A regulator of immune microenvironment and a clinical prognosis indicator in colorectal cancer.
Zhu D, Jiang Y, Cao H, Yang J, Shu Y, Feng H, Yang X, Sun X, Shao M. Zhu D, et al. Front Immunol. 2022 Aug 26;13:876195. doi: 10.3389/fimmu.2022.876195. eCollection 2022. Front Immunol. 2022. PMID: 36091047 Free PMC article. - Obesity and adipose tissue impact on T-cell response and cancer immune checkpoint blockade therapy.
Pasquarelli-do-Nascimento G, Machado SA, de Carvalho JMA, Magalhães KG. Pasquarelli-do-Nascimento G, et al. Immunother Adv. 2022 Jun 24;2(1):ltac015. doi: 10.1093/immadv/ltac015. eCollection 2022. Immunother Adv. 2022. PMID: 36033972 Free PMC article. Review. - Role of hypoxia in the tumor microenvironment and targeted therapy.
Chen G, Wu K, Li H, Xia D, He T. Chen G, et al. Front Oncol. 2022 Sep 23;12:961637. doi: 10.3389/fonc.2022.961637. eCollection 2022. Front Oncol. 2022. PMID: 36212414 Free PMC article. Review. - Navigating CAR-T cells through the solid-tumour microenvironment.
Hou AJ, Chen LC, Chen YY. Hou AJ, et al. Nat Rev Drug Discov. 2021 Jul;20(7):531-550. doi: 10.1038/s41573-021-00189-2. Epub 2021 May 10. Nat Rev Drug Discov. 2021. PMID: 33972771 Review.
References
- Mantovani A, Allavena P, Sica A, Balkwill F. Cancer-related inflammation. Nature. 2008;454:436–444. - PubMed
Publication types
MeSH terms
Substances
Grants and funding
- R01 AI089771/AI/NIAID NIH HHS/United States
- AI089771/AI/NIAID NIH HHS/United States
- K08 CA172580/CA/NCI NIH HHS/United States
- HHMI/Howard Hughes Medical Institute/United States
- KL2 RR024138/RR/NCRR NIH HHS/United States
- R01 CA157461/CA/NCI NIH HHS/United States
- R37 AI046688/AI/NIAID NIH HHS/United States
- UL1 TR000142/TR/NCATS NIH HHS/United States
- P50 CA121974/CA/NCI NIH HHS/United States
- R01 AI046688/AI/NIAID NIH HHS/United States
- CA157461/CA/NCI NIH HHS/United States
- 1 P50 CA121974/CA/NCI NIH HHS/United States
- 1K08CA172580-01/CA/NCI NIH HHS/United States
- AI046688/AI/NIAID NIH HHS/United States
- 5KL2RR024138/RR/NCRR NIH HHS/United States
LinkOut - more resources
Full Text Sources
Other Literature Sources
Molecular Biology Databases
Research Materials


