miR-34a blocks osteoporosis and bone metastasis by inhibiting osteoclastogenesis and Tgif2 - PubMed (original) (raw)
. 2014 Aug 28;512(7515):431-5.
doi: 10.1038/nature13375. Epub 2014 Jun 25.
Wei Wei 1, HoangDinh Huynh 1, Zixue Jin 1, Xunde Wang 1, Tsung-Cheng Chang 2, Xian-Jin Xie 3, Lin He 4, Lingegowda S Mangala 5, Gabriel Lopez-Berestein 6, Anil K Sood 7, Joshua T Mendell 8, Yihong Wan 9
Affiliations
- PMID: 25043055
- PMCID: PMC4149606
- DOI: 10.1038/nature13375
miR-34a blocks osteoporosis and bone metastasis by inhibiting osteoclastogenesis and Tgif2
Jing Y Krzeszinski et al. Nature. 2014.
Erratum in
- Author Correction: miR-34a blocks osteoporosis and bone metastasis by inhibiting osteoclastogenesis and Tgif2.
Krzeszinski JY, Wei W, Huynh H, Jin Z, Wang X, Chang TC, Xie XJ, He L, Mangala LS, Lopez-Berestein G, Sood AK, Mendell JT, Wan Y. Krzeszinski JY, et al. Nature. 2019 Jun;570(7761):E51. doi: 10.1038/s41586-019-1266-4. Nature. 2019. PMID: 31127195
Retraction in
- Retraction Note: miR-34a blocks osteoporosis and bone metastasis by inhibiting osteoclastogenesis and Tgif2.
Krzeszinski JY, Wei W, Huynh H, Jin Z, Wang X, Chang TC, Xie XJ, He L, Mangala LS, Lopez-Berestein G, Sood AK, Mendell JT, Wan Y. Krzeszinski JY, et al. Nature. 2020 Jun;582(7810):134. doi: 10.1038/s41586-020-2273-1. Nature. 2020. PMID: 32483375 Free PMC article.
Abstract
Bone-resorbing osteoclasts significantly contribute to osteoporosis and bone metastases of cancer. MicroRNAs play important roles in physiology and disease, and present tremendous therapeutic potential. Nonetheless, how microRNAs regulate skeletal biology is underexplored. Here we identify miR-34a as a novel and critical suppressor of osteoclastogenesis, bone resorption and the bone metastatic niche. miR-34a is downregulated during osteoclast differentiation. Osteoclastic miR-34a-overexpressing transgenic mice exhibit lower bone resorption and higher bone mass. Conversely, miR-34a knockout and heterozygous mice exhibit elevated bone resorption and reduced bone mass. Consequently, ovariectomy-induced osteoporosis, as well as bone metastasis of breast and skin cancers, are diminished in osteoclastic miR-34a transgenic mice, and can be effectively attenuated by miR-34a nanoparticle treatment. Mechanistically, we identify transforming growth factor-β-induced factor 2 (Tgif2) as an essential direct miR-34a target that is pro-osteoclastogenic. Tgif2 deletion reduces bone resorption and abolishes miR-34a regulation. Together, using mouse genetic, pharmacological and disease models, we reveal miR-34a as a key osteoclast suppressor and a potential therapeutic strategy to confer skeletal protection and ameliorate bone metastasis of cancers.
Figures
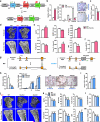
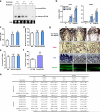
Figure 1. miR-34a Suppresses Osteoclastogenesis Ex Vivo
a, A diagram of bone marrow osteoclast differentiation assay. Rosi, rosiglitazone. b-d, TRAP expression (b) and mature miRNA levels (c-d) (n=3). e-f, Osteoclast differentiation was decreased by pre-miR-34a (e) but increased by anti-miR-34a (f) (n=3). Left, mature miR-34a levels; Right, TRAP expression; Bottom, images of TRAP-stained cultures; mature osteoclast numbers (black) and resorptive activity (blue). Scale bar, 25μm. R, RANKL. g-j, Human RANKL-mediated osteoclast differentiation from human peripheral blood mononuclear (hPBMN) cells (n=4). g, Mature miR-34a levels. h, TRAP expression. i. Mature osteoclast numbers. j. TRAP-staining and resorptive activity. Scale bar, 25μm. Error bars, SD.
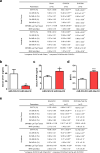
Figure 2. miR-34a Inhibits Bone Resorption and Increases Bone Mass In Vivo
a, A diagram of the conditional miR-34a transgene (CAG-34a). b, 34a-Tie2-Tg cultures showed decreased osteoclast differentiation (n=3). Left, miR-34a levels; Middle, TRAP expression; Right, TRAP staining, osteoclast numbers (black) and resorptive activity (blue). Scale bar, 25μm. c, Serum CTX-1 (2-month-old, male, n=5). d-f, μCT of the tibiae (2-month-old, male, n=4). d, Images of the trabecular bone of the tibial metaphysis (top) (scale bar, 10μm) and the entire proximal tibia (bottom) (scale bar, 1mm). e, Trabecular bone parameters. BV/TV, bone volume/tissue volume ratio; BS/BV, bone surface/bone volume ratio; Tb.Th, trabecular thickness; Tb.Sp, trabecular separation; Conn.D., connectivity density; SMI, structure model index. f, Cortical BV/TV. g, A diagram of miR-34a gene-trap knockout. h, 34a-KO and 34a-Het cultures showed enhanced osteoclast differentiation (n=3). i, Serum CTX-1 (2-month-old, male, n=6). j-l, μCT of the tibiae (2-month-old, male, n=4). j, Images. k, Trabecular bone parameters. l, Cortical BV/TV. m, Serum P1NP (2-month-old, male, n=6). Error bars, SD.
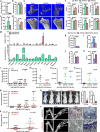
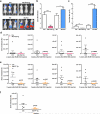
Figure 3. miR-34a Attenuates Osteoporosis and Cancer Bone Metastases
a-f, OVX or sham operation was performed on 10-week-old female mice. Three days post-surgery, the OVX mice were treated with miR-34a-CH (34a) or miR-Ctrl-CH (Ctrl) at 5μg/mouse twice/week for 5 weeks (n=5). a, Uterine weight. b, Body weight. c, Serum CTX-1. d, Serum P1NP. e, μCT images. f, Trabecular bone parameters. g, miR-34a levels in each tissue from miR-34a-CH- vs. miR-Ctrl-CH-treated mice 72 hrs after a single injection (n=3). Top, mature miR-34a levels; Bottom, fold induction. h-k, 34a-Tie2-Tg mice or controls (3-month-old, female, n=7) were subjected to OVX and analyzed 5 weeks post-surgery. h, Uterine weight. i, Serum CTX-1. j, Serum P1NP. k, BV/TV by μCT. l, Xenograft of MDA231-BoM-1833 cells into 34a-Tie2-Tg (n=8) or control (n=9). m, Allograft of B16-F10 cells into 34a-Tie2-Tg (n=4) or control (n=6). n, MDA231-BoM-1833 cells in 34a-KO (n=6), 34a-Het (n=6) or control (n=6). o, B16-F10 in 34a-KO (n=6), 34a-Het (n=4) or control (n=6). p-r, Bone metastasis of MDA231-BoM-1833 cells was attenuated by miR-34a-CH delivered 3 days post-xenograft at 10μg/mouse twice/week for 5 weeks (n=5). p, BLI signal. q, Left, BLI images; Right, bone metastases number and size. r, X-ray images and histology images for TRAP and ALP (alkaline phosphatase) staining. Arrows indicate osteolytic lesions. s, Bone metastasis of B16-F10 cells was attenuated by miR-34a-CH delivered at 5μg/mouse twice/week for 4 weeks starting 1 week before cancer cell injection (n=8). l-s, Statistical analyses were performed with Mann Whitney Test and are shown as mean ± SD with p value illustrated. a,c,d,f,h-k,l,n,o,p p<0.05 by ANOVA.
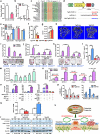
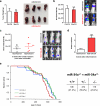
Figure 4. Tgif2 is an Essential miR-34a Direct Target and a Pro-Osteoclastogenic Factor
a, Tgif2 expression was inhibited by pre-miR-34a in osteoclast cultures (n=3). b, Tgif2 expression in WT and 34a-PT-Tg osteoclast cultures (n=3). c, Sequence alignment of the Tgif2 3′UTR. d, A diagram of Tgif2 3′UTR reporters. e, Luciferase readout from WT or mutant Tgif2 3′UTR reporter co-transfected in HEK293 cells with pre-miR-34a or anti-miR-34a (n=3). f-h, Comparison of Tgif2-KO, Tgif2-Het and WT control mice (1.5-month-old, male, n=7). f. Serum CTX-1. g-h, μCT of tibiae. g, Trabecular BV/TV. h, Images of the trabecular bone of the tibial metaphysis (scale bar, 10μm). i, Decreased osteoclast differentiation in Tgif2-KO and Tgif2-Het cultures (n=3). j, Tgif2-KO cultures were resistant to the anti-osteoclastogenic effects of premiR-34a (n=3). i-j, Top, TRAP expression; Bottom, TRAP staining, osteoclast number (black) and resorptive activity (blue). k-l, Tgif2/34a double knockout (DKO) mice were compared with WT, Tgif2-KO or 34a-KO (2-month-old, male, n=4). k, Osteoclast differentiation. l, Serum CTX-1. m, Tgif2 mRNA in RAW264.7 cells following transfection of transcription factors (n=3). n, ChIP of transcription factor binding and H3K4me3 levels at the endogenous Tgif2 promoter in RAW264.7 cells 3d after RANKL treatment (n=6); txn, transcription. o, Transcription factor was co-transfected into 293 cells with its luciferase reporter, together with Tgif2 or a GFP control (n=6). p, Luciferase reporter was transfected into WT, Tgif2-KO or 34a-KO osteoclast cultures (n=6). q-r, NFATc1 mRNA (q, n=3), c-Jun phosphorylation and IκBα degradation (r) in WT, Tgif2-KO or 34a-KO osteoclast cultures. Ratios of p-c-Jun/total-c-Jun and IκBα/β-actin are shown. s, A model for how miR-34a suppresses osteoclastogenesis. Error bars, SD.
Extended Data Figure 1. Additional analyses of 34a-Tie2-Tg mice
a-c, Further characterization of the transgene expression in 34a-Tie2-Tg mice. a, FACS analysis of the percentage of GFP+ bone marrow osteoclast progenitors (c-Fms+RANK+) in 34a-Tie2-Tg mice and “transgene only, no cre” control (n=3). b, Images showing GFP and LacZ expression in osteoclast progenitors from 34a-Tie2-Tg mice (GFP+LacZ-) and “transgene only, no cre” control mice (GFP-LacZ+). Scale bar, 100μm. c, Northern blot analysis confirmed miR-34a over-expression in the hematopoietic bone marrow cells of 34a-Tie2-Tg mice. Ct, control; Tg, 34a-Tie2-Tg; EtBr, ethidium bromide. d, QPCR analysis of mRNA expression of additional osteoclast marker genes (n=3). e, Osteoclast function analysis. Bone marrow osteoclast differentiation was conducted in OsteoAssay bone plates (Lonza), and osteoclast activity was quantified as calcium release using CalciFluo ELISA assay (Lonza) (n=8, mean ± s.e.). f, Osteoclast proliferation was not affected, quantified by BrdU incorporation (n=6). g, Osteoclast apoptosis was not affected, quantified by FACS analysis of AnnexinV+7-AAD- cells (n=6). h-i, Static and dynamic histomorphometry. h, Representative images of distal femur sections (2 month old, male). Scale bars, 1mm for Von Kossa images; 10μm for TRAP, ALP and Calcein images. i, Quantification of parameters at distal femur and vertebrae in 2-month-old male and female mice.
Extended Data Figure 2. Effects of miR-34a over-expression using additional cre driver targeting osteoclast progenitors
34a-PT-Tg mice were generated using PPARγ-tTA-TRE-cre driver. a, Bone marrow osteoclast differentiation assays. Left, mature miR-34a level (n=3); middle, TRAP mRNA expression (n=3); right, TRAP staining of differentiation cultures, quantification of mature osteoclast numbers per well in 24-well plates (black, n=3), and quantification of bone resorptive activity by calcium release from bone plate into culture medium (μM) (blue, n=6). b, Serum CTX-1 bone resorption marker (2-month-old males, n=10). c, μCT analysis of the trabecular bone in proximal tibiae (2-month-old males, n=4). d, Histomorphometry of the distal femur and vertebrae in 2-month-old mice.
Extended Data Figure 3. Effects of miR-34a over-expression using additional osteoclastic cre drivers
a-d, 34a-Lys-Tg mice were generated using Lysozyme-cre driver. e-h, 34a-Ctsk-Tg mice were generated using Ctsk-cre driver. a,e, Bone marrow osteoclast differentiation assays. Left, mature miR-34a level (n=3); middle, TRAP mRNA expression (n=3); right, TRAP staining of differentiation cultures, quantification of mature osteoclast numbers per well in 24-well plates (black, n=3), and quantification of bone resorptive activity by calcium release from bone plate into culture medium (μM) (blue, n=6). b,f, Serum CTX-1 (2-month-old males; b, n=5, f, n=8). c,g, Trabecular BV/TV of proximal tibiae by μCT (2-month-old males; c, n=4; g, n=4). d,h, Histomorphometry of the distal femur and vertebrae in 2-month-old mice.
Extended Data Figure 4. Additional analyses of gene-trap miR-34a knockout mice
a, Northern blot analysis confirmed decreased miR-34a expression in the miR-34a gene trap KO mice. Six-week-old female mice with corresponding genotypes were irradiated with a dose of 6 Gy, and 4 h later the spleen was collected for RNA extraction. Northern blotting for miR-34a was performed as described (Chang TC et al. 2008, Nature Genetics 40:43-50). b, QPCR analysis of mRNA expression of additional osteoclast marker genes (n=3). c, Osteoclast function analysis. Bone marrow osteoclast differentiation was conducted in OsteoAssay bone plates (Lonza), and osteoclast activity was quantified as calcium release using CalciFluo ELISA assay (Lonza) (n=8, mean ± s.e.). d, Osteoclast proliferation was not affected, quantified by BrdU incorporation (n=6). e, Osteoclast apoptosis was not affected, quantified by FACS analysis of AnnexinV+7-AAD- cells (n=6). f. WT mice transplanted with 34a-KO bone marrow cells exhibited higher serum CTX-1 levels compared to WT mice transplanted with WT bone marrow cells (n=5 recipients per group). g-h, Static and dynamic histomorphometry. g, Representative images of distal femur sections (2 month old, male). Scale bars, 1mm for Von Kossa images; 10μm for TRAP, ALP and Calcein images. h, Quantification of parameters at distal femur and vertebrae in 2-month-old male and female mice.
Extended Data Figure 5. Effects of targeted miR-34a deletion
a-d, Targeted miR-34a/b/c triple KO (34abc-TKO) mice were compared with WT control mice (5 month males, n=4). a-c, Bone marrow osteoclast differentiation assay. a, Expression of miR-34a was diminished while expression of miR-34b and miR-34c remained absent/low in osteoclast precursors on d3. b, Expression of osteoclast markers were increased. c, Number, size and resorptive activity of mature osteoclasts were increased. d, Serum CTX-1 was increased. e-h, Targeted full miR-34a KO (34a-full-KO) mice were compared with WT control mice (2 month females, n=3). e-g, Bone marrow osteoclast differentiation assay. e, Expression of miR-34a was diminished in osteoclast precursors on d3. f, Expression of osteoclast markers were increased. g, Number, size and resorptive activity of mature osteoclasts were increased. h, Serum CTX-1 was increased. i-n, Conditional miR-34a KO mice by Tie2-cre (34a-Tie2-KO) were compared with littermate miR-34af/f control mice (2 month males, n=6). i-k, Bone marrow osteoclast differentiation assay. i, miR-34a expression was reduced in osteoclast precursors on d3. j, Expression of osteoclast markers were increased. k, Number, size and resorptive activity of mature osteoclasts were increased. l, Serum CTX-1 was increased. m, Trabecular BV/TV of proximal tibiae by μCT. n, Histomorphometry of the distal femur and vertebrae. For c, g, k, Mature osteoclasts were identified as multinucleated (>3 nuclei) TRAP+ (purple) cells. Scale bar, 25μm. Quantification of osteoclast number/well is shown in black. Quantification of osteoclast resorptive activity by calcium release from bone to culture medium (μM) is shown in blue.
Extended Data Figure 6. Anti-osteoporosis effects of miR-34a
a, Histomorphometry of the distal femur and vertebrae in OVX mice treated with miR-34a-CH nanoparticles. OVX or sham operation was performed on 10-week-old WT female C57BL/6J mice. Three days post surgery, the OVX mice were intravenously injected with miR-34a-CH (34a) or miR-Ctrl-CH (Ctrl) at 5μg/mouse twice a week for 5 weeks (n=5). b-d, Osteoprotective effects of miR-34a-CH in sham control mice. WT female C57B/6J mice (n=5, 10 week old) were subjected to sham operation and then treated with miR-34a-CH or miR-34a-Ctrl at 5μg/mouse twice a week for 5 weeks. b, Serum CTX-1. c, Serum P1NP. d, BV/TV of proximal tibiae by μCT. e, Histomorphometry of the distal femur and vertebrae in WT and 34a-Tie2-Tg mice after OVX. 34a-Tie2-Tg mice or controls (3-month-old, female, n=7) were subjected to OVX or sham operation and analyzed 5 weeks post-surgery.
Extended Data Figure 7. Additional characterization of bone metastases
a, Representative BLI images. b, Quantification of the number of metastasis. c, Quantification of the size of metastasis. For a-c, n=9 for Ctrl, n=8 for 34a-Tie2-Tg, n=6 for WT and 34a-KO; results are shown as average ± s.e.. d, Xenograft of MDA231-BoM-1833 human breast cancer cells into 34a-Tie2-Tg nude mice (n=8) or littermate control nude mice (n=9). Results from each week are shown separately to better visualize the difference. e, Xenograft of MDA231-BoM-1833 human breast cancer cells into 34a-PT-Tg nude mice (n=8) or littermate control nude mice (n=8). Results from each week are shown separately to better visualize the difference. f, Allograft of B16-F10 mouse melanoma cells into 34a-PT-Tg (n=7) or littermate control mice (n=7).
Extended Data Figure 8. Effects of miR-34a on cancer cells
a, Systemic miR-34a-CH delivery did not affect the growth of B16-F10 melanoma cells injected subcutaneously (n=5, male, 8 week old). Tumors were collected 18 days after cell injection, result is shown as average ± s.e. b, Systemic miR-34a-CH delivery did not affect cancer metastasis to other organs such as lung (n=5, male, 8 week old). B16-F10 cells were i.v. injected retro-orbitally, BLI signals were quantified 2 weeks later and the result is shown as average ± s.e. c-d, MiR-34a-CH treatment of cancer cell alone was not sufficient to inhibit bone metastasis. BoM-1833 cells were treated with miR-34a-CH or miR-Ctrl-CH in cultures for 24hrs before cardiac injection (n=5, male, 6 week old), and the mice were not treated with nanoparticles. c, Quantification of bone metastasis BLI signal 5 weeks after injection, shown as average ± s.e. d, MiR-34a over-expression in BoM-1833 cells persisted for 5 weeks in cultures. e, Loss-of-function in 34a-KO and 34a-Het mice did not result in significantly increased susceptibility of cancer and mortality. Left, Kaplan-Meier survival curve for WT (n=29), 34a-Het (n=35) and 34a-KO (n=29); p=0.223 by log-Rank (Mantel-Cox) test. Right, the 34a-KO allele was transmitted at normal Mendelian frequency.
Extended Data Figure 9. Osteoblastic miR-34a over-expression is not sufficient to inhibit osteoporosis or bone metastases
a, A schematic diagram of the ex vivo bone marrow osteoblast differentiation assay. MSC GF, mesenchymal stem cell growth factors; GP, β-glycerophosphate; AA, ascorbic acid. b, Osteoblast differentiation was decreased for bone marrow from 34a-KO and 34a-Het mice compared to WT controls, quantified by osteoblast marker genes osteocalcin and Col1a1 on day 13 (n=6). c-h, Characterization of osteoblastic miR-34a transgenic mice. CAG34a mice were bred with Osterix-CreER mice to generate miR34a-Osx-transgenic (34a-Osx-Tg) mice or littermate control mice that carry only CAG34a transgene; all mice (1-month-old, male) received tamoxifen injection on two consecutive days and analyzed 2 months later. c, Elevated levels of mature miR-34a in 34a-Osx-Tg osteoblast differentiation cultures on day 13 (n=6). d, Osteoblast differentiation was increased for bone marrow from 34a-Osx-Tg mice compared to control mice, quantified by osteoblast marker genes osteocalcin and Col1a1 on day 13 (n=6). e, Serum P1NP was increased in 34a-Osx-Tg mice (n=6). f, Serum CTX-1 was unaltered in 34a-Osx-Tg mice (n=6). g, Histomorphometry of distal femur and vertebrae in 34a-Osx-Tg and control mice. h, OVX-induced bone resorption and bone loss was unaltered in 34a-Osx-Tg mice. 34a-Osx-Tg mice or controls (3-month-old and 2 months after tamoxifen injection, female, n=5) were subjected to OVX or sham operation and analyzed 5 weeks post-surgery. i, Cancer bone metastasis was unaltered in 34a-Osx-Tg mice (n=8). Statistical analyses in i were performed with Mann Whitney Test and are shown as mean ± standard error.
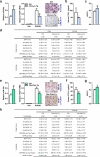
Extended Data Figure 10. Additional characterization of Tgif2 as a key miR-34a direct target gene
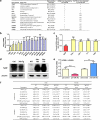
a, A list of potential miR-34a target genes in the osteoclast lineage and characterization of miR-34a regulation. N.D., not determined. b, Fold changes in the expression of each candidate target gene after transfection with pre-miR-34a vs. pre-miR-ctrl in WT bone marrow osteoclast differentiation culture (n=3) . c, Fold changes in the luciferase readout from 3′UTR reporter for each candidate target gene co-transfected in HEK293 cells with pre-miR-34a or pre-control. The results were normalized by internal control β-galactosidase (β-gal) readout (n=3). d, Western blot analysis showing that Tgif2 protein expression is decreased in the bone marrow osteoclast progenitors from 34a-Tie2-Tg transgenic mice compared with control mice (left), but increased in the bone marrow osteoclast progenitors from 34a-KO and 34a-Het mice compared with WT control mice (right). e, Human Tgif2 expression in hPBMN osteoclast differentiation cultures was suppressed by pre-miR-34a but enhanced by anti-miR-34a via transfection (n=4). f, Histomorphometry of the distal femur and vertebrae in 1.5 month old Tgif2-KO, Tgif2-Het and WT control mice.
Comment in
- Bone: micromanaging osteoporosis.
Ray K. Ray K. Nat Rev Rheumatol. 2014 Aug;10(8):445. doi: 10.1038/nrrheum.2014.111. Epub 2014 Jul 8. Nat Rev Rheumatol. 2014. PMID: 25003771 No abstract available. - Findings of Research Misconduct.
[No authors listed] [No authors listed] Fed Regist. 2020 Dec 28;85(248):84354-84355. Fed Regist. 2020. PMID: 33390629 Free PMC article. No abstract available.
Similar articles
- Osteoclastic miR-214 targets TRAF3 to contribute to osteolytic bone metastasis of breast cancer.
Liu J, Li D, Dang L, Liang C, Guo B, Lu C, He X, Cheung HY, He B, Liu B, Li F, Lu J, Wang L, Shaikh AB, Jiang F, Lu C, Peng S, Zhang Z, Zhang BT, Pan X, Xiao L, Lu A, Zhang G. Liu J, et al. Sci Rep. 2017 Jan 10;7:40487. doi: 10.1038/srep40487. Sci Rep. 2017. PMID: 28071724 Free PMC article. - miR-128 plays a critical role in murine osteoclastogenesis and estrogen deficiency-induced bone loss.
Shen G, Ren H, Shang Q, Zhang Z, Zhao W, Yu X, Tang J, Yang Z, Liang D, Jiang X. Shen G, et al. Theranostics. 2020 Mar 4;10(10):4334-4348. doi: 10.7150/thno.42982. eCollection 2020. Theranostics. 2020. PMID: 32292498 Free PMC article. - Pseudogene PTENP1 sponges miR-214 to regulate the expression of PTEN to modulate osteoclast differentiation and attenuate osteoporosis.
Wang CG, Wang L, Yang T, Su SL, Hu YH, Zhong D. Wang CG, et al. Cytotherapy. 2020 Aug;22(8):412-423. doi: 10.1016/j.jcyt.2020.04.090. Epub 2020 Jun 16. Cytotherapy. 2020. PMID: 32561161 - MicroRNAs and their roles in osteoclast differentiation.
Xia Z, Chen C, Chen P, Xie H, Luo X. Xia Z, et al. Front Med. 2011 Dec;5(4):414-9. doi: 10.1007/s11684-011-0168-0. Epub 2011 Dec 27. Front Med. 2011. PMID: 22198753 Review. - The role of microRNAs in osteoclasts and osteoporosis.
Tang P, Xiong Q, Ge W, Zhang L. Tang P, et al. RNA Biol. 2014;11(11):1355-63. doi: 10.1080/15476286.2014.996462. RNA Biol. 2014. PMID: 25692234 Free PMC article. Review.
Cited by
- RBP-J-Regulated miR-182 Promotes TNF-α-Induced Osteoclastogenesis.
Miller CH, Smith SM, Elguindy M, Zhang T, Xiang JZ, Hu X, Ivashkiv LB, Zhao B. Miller CH, et al. J Immunol. 2016 Jun 15;196(12):4977-86. doi: 10.4049/jimmunol.1502044. Epub 2016 May 9. J Immunol. 2016. PMID: 27183593 Free PMC article. - Calcium Supplement by Tetracycline guided amorphous Calcium Carbonate potentiates Osteoblast promotion for Synergetic Osteoporosis Therapy.
Wang J, Tao S, Jin X, Song Y, Zhou W, Lou H, Zhao R, Wang C, Hu F, Yuan H. Wang J, et al. Theranostics. 2020 Jul 9;10(19):8591-8605. doi: 10.7150/thno.45142. eCollection 2020. Theranostics. 2020. PMID: 32754265 Free PMC article. - microRNAs Tune Oxidative Stress in Cancer Therapeutic Tolerance and Resistance.
Zhang WC. Zhang WC. Int J Mol Sci. 2019 Dec 3;20(23):6094. doi: 10.3390/ijms20236094. Int J Mol Sci. 2019. PMID: 31816897 Free PMC article. Review. - Osteoclastic microRNAs and their translational potential in skeletal diseases.
Inoue K, Nakano S, Zhao B. Inoue K, et al. Semin Immunopathol. 2019 Sep;41(5):573-582. doi: 10.1007/s00281-019-00761-4. Epub 2019 Oct 7. Semin Immunopathol. 2019. PMID: 31591677 Free PMC article. Review. - Icariside II Promotes the Differentiation of Adipose Tissue-Derived Stem Cells to Schwann Cells to Preserve Erectile Function after Cavernous Nerve Injury.
Zheng T, Zhang TB, Wang CL, Zhang WX, Jia DH, Yang F, Sun YY, Ding XJ, Wang R. Zheng T, et al. Mol Cells. 2018 Jun;41(6):553-561. doi: 10.14348/molcells.2018.2236. Epub 2018 Jun 14. Mol Cells. 2018. PMID: 29902838 Free PMC article.
References
- Coleman RE. Bone cancer in 2011: Prevention and treatment of bone metastases. Nature reviews. Clinical oncology. 2012;9:76–78. - PubMed
- Ell B, Kang Y. SnapShot: Bone Metastasis. Cell. 2012;151:690–690. e691. - PubMed
- Novack DV, Teitelbaum SL. The osteoclast: friend or foe? Annu Rev Pathol. 2008;3:457–484. - PubMed
Publication types
MeSH terms
Substances
Grants and funding
- R01 CA139067/CA/NCI NIH HHS/United States
- U01 CA213759/CA/NCI NIH HHS/United States
- UH2 TR000943/TR/NCATS NIH HHS/United States
- S10 RR025648/RR/NCRR NIH HHS/United States
- P01 CA134292/CA/NCI NIH HHS/United States
- P30 CA142543/CA/NCI NIH HHS/United States
- 1P30 CA142543/CA/NCI NIH HHS/United States
- R01 DK089113/DK/NIDDK NIH HHS/United States
- R01 CA120185/CA/NCI NIH HHS/United States
- 1S10RR02564801/RR/NCRR NIH HHS/United States
- U54 CA151668/CA/NCI NIH HHS/United States
- S10 RR024757/RR/NCRR NIH HHS/United States
LinkOut - more resources
Full Text Sources
Other Literature Sources
Medical
Molecular Biology Databases

