The hubs of the human connectome are generally implicated in the anatomy of brain disorders - PubMed (original) (raw)
Meta-Analysis
. 2014 Aug;137(Pt 8):2382-95.
doi: 10.1093/brain/awu132. Epub 2014 Jun 19.
Affiliations
- PMID: 25057133
- PMCID: PMC4107735
- DOI: 10.1093/brain/awu132
Meta-Analysis
The hubs of the human connectome are generally implicated in the anatomy of brain disorders
Nicolas A Crossley et al. Brain. 2014 Aug.
Erratum in
- Corrigendum.
[No authors listed] [No authors listed] Brain. 2015 Aug;138(Pt 8):e374. doi: 10.1093/brain/awv122. Brain. 2015. PMID: 26205839 Free PMC article. No abstract available.
Abstract
Brain networks or 'connectomes' include a minority of highly connected hub nodes that are functionally valuable, because their topological centrality supports integrative processing and adaptive behaviours. Recent studies also suggest that hubs have higher metabolic demands and longer-distance connections than other brain regions, and therefore could be considered biologically costly. Assuming that hubs thus normally combine both high topological value and high biological cost, we predicted that pathological brain lesions would be concentrated in hub regions. To test this general hypothesis, we first identified the hubs of brain anatomical networks estimated from diffusion tensor imaging data on healthy volunteers (n = 56), and showed that computational attacks targeted on hubs disproportionally degraded the efficiency of brain networks compared to random attacks. We then prepared grey matter lesion maps, based on meta-analyses of published magnetic resonance imaging data on more than 20 000 subjects and 26 different brain disorders. Magnetic resonance imaging lesions that were common across all brain disorders were more likely to be located in hubs of the normal brain connectome (P < 10(-4), permutation test). Specifically, nine brain disorders had lesions that were significantly more likely to be located in hubs (P < 0.05, permutation test), including schizophrenia and Alzheimer's disease. Both these disorders had significantly hub-concentrated lesion distributions, although (almost completely) distinct subsets of cortical hubs were lesioned in each disorder: temporal lobe hubs specifically were associated with higher lesion probability in Alzheimer's disease, whereas in schizophrenia lesions were concentrated in both frontal and temporal cortical hubs. These results linking pathological lesions to the topological centrality of nodes in the normal diffusion tensor imaging connectome were generally replicated when hubs were defined instead by the meta-analysis of more than 1500 task-related functional neuroimaging studies of healthy volunteers to create a normative functional co-activation network. We conclude that the high cost/high value hubs of human brain networks are more likely to be anatomically abnormal than non-hubs in many (if not all) brain disorders.
Keywords: VBM; graph analysis; rich club; topology; tractography.
© The Author (2014). Published by Oxford University Press on behalf of the Guarantors of Brain.
Figures
Figure 1
Topological characteristics of the normal brain anatomical network (DTI connectome). (A) Nodes of the normal DTI network in anatomical space; the size of each node is proportional to its degree. (B) Fat-tailed degree distribution of DTI network (histogram) indicating higher probability of hubs than in a random (Erdös-Rényi) graph (red line). (C) Distance distribution of DTI networks (histogram) and of random graphs matched for degree distribution (red line). (D) Scatterplot of degree versus mean connection distance in the DTI network. (E) Small-world properties of the network (γ = normalized clustering coefficient; λ = normalized path length; σ = ratio of γ to λ; dotted line = 1, the expected value of all these metrics in a random graph). (F) Modular decomposition of the DTI network. (G) Plot of the normalized rich club coefficient (_y_-axis) as a function of degree threshold (_x_-axis) used to define the rich club; dotted line = 1, the expected value of the normalized rich-club coefficient in a random network with the same degree distribution as the DTI connectome.
Figure 2
Computational attacks and the resilience of the DTI connectome. (A) Plot of global efficiency of the DTI network versus percentage of nodes deleted. When nodes are deleted randomly the efficiency of the network is approximately as resilient as a random (Erdös-Rényi) graph (inset); when high degree nodes are targeted (deleted in order of decreasing degree) the efficiency of the network degrades more rapidly than a random graph. (B) Plot of global efficiency of the DTI network versus percentage of edges deleted. The efficiency of the DTI network degrades faster than a random graph when the longer distance edges are targeted (deleted in order of decreasing connection distance).
Figure 3
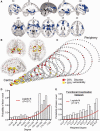
MRI lesions identified meta-analytically from the primary literature on 26 clinical brain disorders impact preferentially on the hubs of the normal connectome. (A) A meta-analytic map of multiple cortical and subcortical grey matter MRI lesions that were significantly abnormal ‘on average’ over 26 specific disorders. (B) Nodes of the normative DTI connectome, represented in anatomical space, and (C) in a spiral, where nodes of similar degree are arranged in the same circle, and the different circumferences arranged so that the tip of the spiral has the highest degree hub nodes, while the base the most peripheral nodes. Nodes are sized in proportion to their degree, and coloured according to the proportion of voxels which are generically lesioned, i.e. the percentage of lesion voxels each node comprises. The strongest 0.1% of edges between nodes, which highlight pairs of nodes with consistently high number of streamlines interconnecting them, are shown for illustrative purposes. (D) Plot of the probability of lesion voxels (_y_-axis) versus the degree of DTI connectome nodes (_x_-axis). The red line is a fitted logistic regression model. (E) Plot of the probability of lesion voxels (_y_-axis) versus the degree of the functional co-activation network nodes (_x_-axis). The red line is a fitted logistic regression model.
Figure 4
Modelling pathological attack on the connectome. Plot of the global efficiency of the DTI network versus percentage of nodes deleted. Note that the global efficiency deteriorates significantly faster in pathological attacks compared to random attack, but not to the extent of targeted attacks on hubs.
Figure 5
Degree and probability of lesion in anatomical subnetworks. Probability of a ‘voxel lesion’ in each of the 401 regions of the DTI template for (A) the disorder-general VBM meta-analysis, as well as for (B) Alzheimer’s disease and (C) schizophrenia meta-analysis. Nodes have been colour-coded according to their anatomical (lobar) location, and logistic regression lines for each subgroup and for all the regions together are shown.
Figure 6
Hub concentration of lesions is common to many specific brain disorders. For each of 26 disorders, box plots represent the difference in median degree of lesion voxels versus non-lesion voxels with a bootstrap 95% CI; the size of the box is proportional to the number of primary studies in the MRI literature. Small inset plot shows the relationship between sample size and difference in median degree for every study. Note that results from individual disorders are symmetrically distributed around the meta-analytical summary of all disorders, with a larger variance observed for disorders represented by fewer studies.
Figure 7
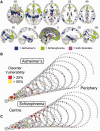
Schizophrenia and Alzheimer’s disease impact mainly on anatomically distinct subsets of hubs. (A) Meta-analytic maps of cortical and subcortical lesions associated with schizophrenia (green voxels), or Alzheimer’s disease (blue voxels), or both disorders (pink voxels). (B and C) Lesions mapped in spiral networks in schizophrenia (B) and Alzheimer’s disease (C) where the tip represents the highest degree nodes for both disorders and the strongest 0.1% of edges are shown.
Comment in
- Towards network substrates of brain disorders.
Sporns O. Sporns O. Brain. 2014 Aug;137(Pt 8):2117-8. doi: 10.1093/brain/awu148. Brain. 2014. PMID: 25057132 Free PMC article.
Similar articles
- Abnormal rich club organization and functional brain dynamics in schizophrenia.
van den Heuvel MP, Sporns O, Collin G, Scheewe T, Mandl RC, Cahn W, Goñi J, Hulshoff Pol HE, Kahn RS. van den Heuvel MP, et al. JAMA Psychiatry. 2013 Aug;70(8):783-92. doi: 10.1001/jamapsychiatry.2013.1328. JAMA Psychiatry. 2013. PMID: 23739835 - Individual variability in the anatomical distribution of nodes participating in rich club structural networks.
Kocher M, Gleichgerrcht E, Nesland T, Rorden C, Fridriksson J, Spampinato MV, Bonilha L. Kocher M, et al. Front Neural Circuits. 2015 Apr 21;9:16. doi: 10.3389/fncir.2015.00016. eCollection 2015. Front Neural Circuits. 2015. PMID: 25954161 Free PMC article. - Meta-connectomics: human brain network and connectivity meta-analyses.
Crossley NA, Fox PT, Bullmore ET. Crossley NA, et al. Psychol Med. 2016 Apr;46(5):897-907. doi: 10.1017/S0033291715002895. Epub 2016 Jan 26. Psychol Med. 2016. PMID: 26809184 Free PMC article. Review. - Age-related changes in the topological organization of the white matter structural connectome across the human lifespan.
Zhao T, Cao M, Niu H, Zuo XN, Evans A, He Y, Dong Q, Shu N. Zhao T, et al. Hum Brain Mapp. 2015 Oct;36(10):3777-92. doi: 10.1002/hbm.22877. Epub 2015 Jul 14. Hum Brain Mapp. 2015. PMID: 26173024 Free PMC article. - Schizophrenia and abnormal brain network hubs.
Rubinov M, Bullmore E. Rubinov M, et al. Dialogues Clin Neurosci. 2013 Sep;15(3):339-49. doi: 10.31887/DCNS.2013.15.3/mrubinov. Dialogues Clin Neurosci. 2013. PMID: 24174905 Free PMC article. Review.
Cited by
- Optimizing the accuracy of cortical volumetric analysis in traumatic brain injury.
Diamond BR, Donald CLM, Frau-Pascual A, Snider SB, Fischl B, Dams-O'Connor K, Edlow BL. Diamond BR, et al. MethodsX. 2020 Jul 11;7:100994. doi: 10.1016/j.mex.2020.100994. eCollection 2020. MethodsX. 2020. PMID: 32760659 Free PMC article. - High-Resolution Functional Connectivity Density: Hub Locations, Sensitivity, Specificity, Reproducibility, and Reliability.
Tomasi D, Shokri-Kojori E, Volkow ND. Tomasi D, et al. Cereb Cortex. 2016 Jul;26(7):3249-59. doi: 10.1093/cercor/bhv171. Epub 2015 Jul 28. Cereb Cortex. 2016. PMID: 26223259 Free PMC article. - Interhemispheric connectivity in amyotrophic lateral sclerosis: A near-infrared spectroscopy and diffusion tensor imaging study.
Kopitzki K, Oldag A, Sweeney-Reed CM, Machts J, Veit M, Kaufmann J, Hinrichs H, Heinze HJ, Kollewe K, Petri S, Mohammadi B, Dengler R, Kupsch AR, Vielhaber S. Kopitzki K, et al. Neuroimage Clin. 2016 Sep 29;12:666-672. doi: 10.1016/j.nicl.2016.09.020. eCollection 2016. Neuroimage Clin. 2016. PMID: 27761397 Free PMC article. - Connectivity impairment of cerebellar and sensorimotor connector hubs in Parkinson's disease.
Bagarinao E, Kawabata K, Watanabe H, Hara K, Ohdake R, Ogura A, Masuda M, Kato T, Maesawa S, Katsuno M, Sobue G. Bagarinao E, et al. Brain Commun. 2022 Aug 20;4(5):fcac214. doi: 10.1093/braincomms/fcac214. eCollection 2022. Brain Commun. 2022. PMID: 36072644 Free PMC article. - Cognitive impairment after focal brain lesions is better predicted by damage to structural than functional network hubs.
Reber J, Hwang K, Bowren M, Bruss J, Mukherjee P, Tranel D, Boes AD. Reber J, et al. Proc Natl Acad Sci U S A. 2021 May 11;118(19):e2018784118. doi: 10.1073/pnas.2018784118. Proc Natl Acad Sci U S A. 2021. PMID: 33941692 Free PMC article.
References
- Agosta F, Sala S, Valsasina P, Meani A, Canu E, Magnani G, et al. Brain network connectivity assessed using graph theory in frontotemporal dementia. Neurology. 2013;81:134–43. - PubMed
- Albert R, Jeong H, Barabasi AL. Error and attack tolerance of complex networks. Nature. 2000;406:378–82. - PubMed
Publication types
MeSH terms
Grants and funding
- 095844/WT_/Wellcome Trust/United Kingdom
- G0001354/MRC_/Medical Research Council/United Kingdom
- G1000183/MRC_/Medical Research Council/United Kingdom
- R01 MH074457/MH/NIMH NIH HHS/United States
LinkOut - more resources
Full Text Sources
Other Literature Sources


