Structure of β-galactosidase at 3.2-Å resolution obtained by cryo-electron microscopy - PubMed (original) (raw)
Structure of β-galactosidase at 3.2-Å resolution obtained by cryo-electron microscopy
Alberto Bartesaghi et al. Proc Natl Acad Sci U S A. 2014.
Abstract
We report the solution structure of Escherichia coli β-galactosidase (∼465 kDa), solved at ∼3.2-Å resolution by using single-particle cryo-electron microscopy (cryo-EM). Densities for most side chains, including those of residues in the active site, and a catalytic Mg(2+) ion can be discerned in the map obtained by cryo-EM. The atomic model derived from our cryo-EM analysis closely matches the 1.7-Å crystal structure with a global rmsd of ∼0.66 Å. There are significant local differences throughout the protein, with clear evidence for conformational changes resulting from contact zones in the crystal lattice. Inspection of the map reveals that although densities for residues with positively charged and neutral side chains are well resolved, systematically weaker densities are observed for residues with negatively charged side chains. We show that the weaker densities for negatively charged residues arise from their greater sensitivity to radiation damage from electron irradiation as determined by comparison of density maps obtained by using electron doses ranging from 10 to 30 e(-)/Å(2). In summary, we establish that it is feasible to use cryo-EM to determine near-atomic resolution structures of protein complexes (<500 kDa) with low symmetry, and that the residue-specific radiation damage that occurs with increasing electron dose can be monitored by using dose fractionation tools available with direct electron detector technology.
Keywords: 3D reconstruction; CTF determination; frame alignment; single-particle EM; structure refinement.
Conflict of interest statement
The authors declare no conflict of interest.
Figures
Fig. 1.
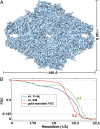
Cryo-EM density map of E. coli β-galactosidase at 3.2-Å resolution. (A) Surface representation of the density map derived by cryo-EM. The dimensions of the β-galactosidase tetramer are ∼180 Å x 140 Å x 87 Å. (B) Three different FSC plots to estimate resolution of the map shown in A. The curve in red shows the gold-standard FSC (24), with a value of 0.143 at 3.2-Å resolution, calculated between two independently refined halves of the dataset; the curve in blue shows the FSC (value of 0.5 at 3.6-Å resolution) calculated between the map in A and the map derived from the structure derived by X-ray crystallography PDB ID code 1DP0 (21); and the curve in green shows the FSC (value of 0.5 at 3.2-Å resolution) calculated between the map in A and the map derived from the cryo-EM–derived atomic model.
Fig. 2.
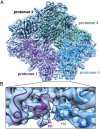
Atomic model for β-galactosidase tetramer derived by cryo-EM. (A) Cryo-EM map shown in surface representation with fitted atomic model of β-galactosidase. The four labeled protomers are colored magenta, black, green, and blue, respectively. The density corresponding to the 12 N-terminal residues of protomers 1 and 4 are shown in the boxed region to highlight the absence of these residues in 96% of the 57 available X-ray structures. (B) Zoomed in region of the dimer interface highlighted in A showing a superposition of the cryo-EM–derived atomic model derived de novo from the experimental density map (N1 and N4 shown in magenta and blue, respectively); the cryo-EM derived atomic model closely matches that derived in the X-ray models that report coordinates for this region (only 2 of the 57 reported structures).
Fig. 3.
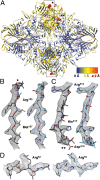
Comparison of atomic models of E. coli β-galactosidase derived by X-ray crystallography at 1.7-Å resolution and by cryo-EM at 3.2-Å resolution. (A) X-ray structure of E. coli β-galactosidase (PDB ID code 1DP0; ref. 21) after alignment to the cryo-EM structure shown in ribbon representation colored according to rmsd values [ranging from blue (low) to red (high)]. Each chain was aligned separately in Chimera, using the default algorithm (Needleman–Wunsch in BLOSUM-62 Matrix). Highlighted areas shown as red spheres correspond to regions marked with asterisks (* and **) with rmsd values for Cα over 2 Å that are involved in crystal contacts (
Fig. S9
). (B_–_D) Local deviations between the atomic model derived from X-ray crystallography (Left in gray sticks) and the atomic model derived from cryo-EM (Right in light blue sticks) superimposed on the cryo-EM density map (mesh representation). Zones of protein-protein contacts in the crystal lattice including residues 179–189 (marked * in A) are shown in B, and the region including residues 310–320 (marked ** in A) is shown in C. Example of local deviations near residues 50–55, which are not involved in crystal contacts but located at the periphery of the enzyme is shown in D. In all examples, displacement of side chains and the backbone regions is visible.
Fig. 4.
Quality of cryo-EM–derived density map. Selected regions showing the fit of the derived atomic model to the cryo-EM density map (black mesh). Residues 849–856 in a β-strand (A), residues 395–405 in an α-helix (B), and residues 413–420 in the active site along with density for a Mg2+ ion partly coordinated by His-418 and Glu-416 (C).
Fig. 5.
Variation in observed side-chain densities between different types of residues. (A) Densities observed for a set of Arg, Lys, and His residues (shown in stick representation). (B) Comparison of densities observed for a set of Gln and Glu residues, as well as Asp residues to indicate preferential loss of density for the negatively charged side chains in comparison with the similarly sized, but neutral side chains. (C) Plot of normalized averaged map values (as detailed in
Fig. S12
), shown for each residue type when only buried residues are considered (hatched bars) or when all residues including buried and exposed varieties are considered (filled bars). Buried residues are defined as those where <30% of their maximum possible surface area is exposed to solvent.
Fig. 6.
Differential dose-dependent radiation damage. Side-chain densities for selected Glu and Asp residues are shown to illustrate the effects of radiation damage by comparison of maps obtained with progressively higher total electron doses. Density maps were derived by using the first 8, 16, or 24 frames (Top, Middle, and Bottom), corresponding to 10, 20, or 30 e−/Å2 total dose, respectively. In comparison with Arg and Leu side chains (illustrated using Arg-52 and Leu-7 as examples), Glu and Asp side chains (illustrated by using Glu-67, Glu-243, and Asp-96) are much more sensitive to radiation damage showing increased loss of density (26%, 22%, and 10% for Glu-67, Glu-243, and Asp-96, respectively) with an increase in dose from 10 to 30 e−/Å2 (see also
Fig. S12
for a quantitative analysis of residue-specific radiation damage at different dose levels).
Similar articles
- 2.2 Å resolution cryo-EM structure of β-galactosidase in complex with a cell-permeant inhibitor.
Bartesaghi A, Merk A, Banerjee S, Matthies D, Wu X, Milne JL, Subramaniam S. Bartesaghi A, et al. Science. 2015 Jun 5;348(6239):1147-51. doi: 10.1126/science.aab1576. Epub 2015 May 7. Science. 2015. PMID: 25953817 Free PMC article. - Atomic Resolution Cryo-EM Structure of β-Galactosidase.
Bartesaghi A, Aguerrebere C, Falconieri V, Banerjee S, Earl LA, Zhu X, Grigorieff N, Milne JLS, Sapiro G, Wu X, Subramaniam S. Bartesaghi A, et al. Structure. 2018 Jun 5;26(6):848-856.e3. doi: 10.1016/j.str.2018.04.004. Epub 2018 May 10. Structure. 2018. PMID: 29754826 Free PMC article. - Determining the Crystal Structure of TRPV6.
Saotome K, Singh AK, Sobolevsky AI. Saotome K, et al. In: Kozak JA, Putney JW Jr, editors. Calcium Entry Channels in Non-Excitable Cells. Boca Raton (FL): CRC Press/Taylor & Francis; 2018. Chapter 14. In: Kozak JA, Putney JW Jr, editors. Calcium Entry Channels in Non-Excitable Cells. Boca Raton (FL): CRC Press/Taylor & Francis; 2018. Chapter 14. PMID: 30299652 Free Books & Documents. Review. - Beam-induced motion correction for sub-megadalton cryo-EM particles.
Scheres SH. Scheres SH. Elife. 2014 Aug 13;3:e03665. doi: 10.7554/eLife.03665. Elife. 2014. PMID: 25122622 Free PMC article. - Processing of Structurally Heterogeneous Cryo-EM Data in RELION.
Scheres SH. Scheres SH. Methods Enzymol. 2016;579:125-57. doi: 10.1016/bs.mie.2016.04.012. Epub 2016 May 31. Methods Enzymol. 2016. PMID: 27572726 Review.
Cited by
- Development of a reporter peptide that catalytically produces a fluorescent signal through α-complementation.
Nishiyama K, Ichihashi N, Kazuta Y, Yomo T. Nishiyama K, et al. Protein Sci. 2015 May;24(5):599-603. doi: 10.1002/pro.2667. Epub 2015 Apr 2. Protein Sci. 2015. PMID: 25740628 Free PMC article. - Higher resolution in cryo-EM by the combination of macromolecular prior knowledge and image-processing tools.
Ramírez-Aportela E, Carazo JM, Sorzano COS. Ramírez-Aportela E, et al. IUCrJ. 2022 Aug 3;9(Pt 5):632-638. doi: 10.1107/S2052252522006959. eCollection 2022 Sep 1. IUCrJ. 2022. PMID: 36071808 Free PMC article. - MicroED structures of HIV-1 Gag CTD-SP1 reveal binding interactions with the maturation inhibitor bevirimat.
Purdy MD, Shi D, Chrustowicz J, Hattne J, Gonen T, Yeager M. Purdy MD, et al. Proc Natl Acad Sci U S A. 2018 Dec 26;115(52):13258-13263. doi: 10.1073/pnas.1806806115. Epub 2018 Dec 10. Proc Natl Acad Sci U S A. 2018. PMID: 30530702 Free PMC article. - DNA melting initiates the RAG catalytic pathway.
Ru H, Mi W, Zhang P, Alt FW, Schatz DG, Liao M, Wu H. Ru H, et al. Nat Struct Mol Biol. 2018 Aug;25(8):732-742. doi: 10.1038/s41594-018-0098-5. Epub 2018 Jul 30. Nat Struct Mol Biol. 2018. PMID: 30061602 Free PMC article. - Comparison of side-chain dispersion in protein structures determined by cryo-EM and X-ray crystallography.
Ravikumar A, Gopnarayan MN, Subramaniam S, Srinivasan N. Ravikumar A, et al. IUCrJ. 2021 Dec 10;9(Pt 1):98-103. doi: 10.1107/S2052252521011945. eCollection 2022 Jan 1. IUCrJ. 2021. PMID: 35059214 Free PMC article.
References
- Subramaniam S, Henderson R. Molecular mechanism of vectorial proton translocation by bacteriorhodopsin. Nature. 2000;406(6796):653–657. - PubMed
Publication types
MeSH terms
Substances
LinkOut - more resources
Full Text Sources
Other Literature Sources
Molecular Biology Databases


