Regional distribution of hepatitis C virus infection in the Republic of Korea, 2007-2011 - PubMed (original) (raw)
Regional distribution of hepatitis C virus infection in the Republic of Korea, 2007-2011
Geun-Yong Kwon et al. Gut Liver. 2014 Jul.
Abstract
Background/aims: In Korea, hepatitis C is included as an infectious disease in a sentinel surveillance system. Recently, a large variation in hepatitis C incidence between different regions in Korea has been noticed. The current study verified the nationwide distribution of hepatitis C infection for effective prevention and management.
Methods: We counted the number of hepatitis C patients who visited a hospital per county using the National Health Insurance database from 2007 to 2011. The age-adjusted prevalence ratio was used, and the age adjustment method was used as an indirect standardization method. Disease mapping and spatial analysis were conducted using a geographic information system.
Results: The annual prevalence of diagnosed hepatitis C was approximately 0.12% to 0.13% in Korea. The age-adjusted prevalence ratios in Busan, Jeonnam, and Gyeongnam were high (1.75, 1.4, and 1.3, respectively). The three regions in the southern coastal area of the Korean Peninsula were identified as a high-prevalence cluster (Moran's index, 0.3636).
Conclusions: The present study showed that hepatitis C infection has very large regional variation, and there are several high-risk areas. Preventive measures focusing on these areas should be applied to block the transmission of hepatitis C and reduce the disease burden.
Keywords: Hepatitis C; Infection; Prevalence; Republic of Korea; Spatial analysis.
Figures
Fig. 1
Average age-adjusted prevalence ratio of hepatitis C by province in Korea, 2007–2011. SPR, standardized prevalence ratio.
Fig. 2
Average age-adjusted prevalence ratio of hepatitis C by county in the Busan (A), Jeonnam (B), and Gyeongnam Provinces (C), 2007–2011. SPR, standardized prevalence ratio.
Fig. 3
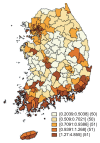
Grid map for each regional average age-adjusted prevalence ratio (APR) for diagnosed hepatitis C, 2007–2011. The colors were divided into five classes, and a high prevalence is indicated by dark brown. The color of each class, range of regional APR, and number of counties belonging to the class are shown.
Fig. 4
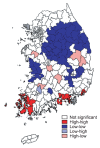
Cluster map of each regional average age-adjusted prevalence ratio for diagnosed hepatitis C, 2007–2011. The spatially nonsignificant regions were marked in light grey. The hot spots were marked in red, which means the prevalence in the region and in neighboring regions was high. The cold spots were marked with blue, which means the prevalence in the region and in neighboring regions was low. Sky blue indicates that the prevalence in the region was low but that in neighboring regions was high. Pink indicates that the prevalence of the region was high but that in neighboring regions was low.
Comment in
- Regional diversity of hepatitis C virus prevalence: seeking for culture specific mode of transmission.
Lee JI. Lee JI. Gut Liver. 2014 Jul;8(4):337-8. doi: 10.5009/gnl.2014.8.4.337. Gut Liver. 2014. PMID: 25071897 Free PMC article. No abstract available.
Similar articles
- Comparison and analysis of the prevalence of hepatitis C virus infection by region in the Republic of Korea during 2005-2012.
Shon HS, Choi HY, Kim JR, Ryu SY, Lee YJ, Lee MJ, Min HJ, Lee J, Song YJ, Ki M. Shon HS, et al. Clin Mol Hepatol. 2015 Sep;21(3):249-56. doi: 10.3350/cmh.2015.21.3.249. Epub 2015 Sep 30. Clin Mol Hepatol. 2015. PMID: 26526977 Free PMC article. - A nationwide seroepidemiology of hepatitis C virus infection in South Korea.
Kim DY, Kim IH, Jeong SH, Cho YK, Lee JH, Jin YJ, Lee D, Suh DJ, Han KH, Park NH, Kang HY, Jung YK, Kim YS, Kim KA, Lee YJ, Lee BS, Yim HJ, Lee HJ, Baik SK, Tak WY, Lee SJ, Chung WJ, Choi SK, Cho EY, Heo J, Kim DJ, Song BC, Kim MW, Lee J, Chae HB, Choi DH, Choi HY, Ki M. Kim DY, et al. Liver Int. 2013 Apr;33(4):586-94. doi: 10.1111/liv.12108. Epub 2013 Jan 29. Liver Int. 2013. PMID: 23356674 - [Current status and clinical course of hepatitis C virus in Korea].
Kwon JH, Bae SH. Kwon JH, et al. Korean J Gastroenterol. 2008 Jun;51(6):360-7. Korean J Gastroenterol. 2008. PMID: 18604137 Review. Korean. - Current status of hepatitis C virus infection and countermeasures in South Korea.
Jeong SH, Jang ES, Choi HY, Kim KA, Chung W, Ki M. Jeong SH, et al. Epidemiol Health. 2017 Apr 13;39:e2017017. doi: 10.4178/epih.e2017017. eCollection 2017. Epidemiol Health. 2017. PMID: 28774165 Free PMC article. Review.
Cited by
- Regional diversity of hepatitis C virus prevalence: seeking for culture specific mode of transmission.
Lee JI. Lee JI. Gut Liver. 2014 Jul;8(4):337-8. doi: 10.5009/gnl.2014.8.4.337. Gut Liver. 2014. PMID: 25071897 Free PMC article. No abstract available. - Comparison and analysis of the prevalence of hepatitis C virus infection by region in the Republic of Korea during 2005-2012.
Shon HS, Choi HY, Kim JR, Ryu SY, Lee YJ, Lee MJ, Min HJ, Lee J, Song YJ, Ki M. Shon HS, et al. Clin Mol Hepatol. 2015 Sep;21(3):249-56. doi: 10.3350/cmh.2015.21.3.249. Epub 2015 Sep 30. Clin Mol Hepatol. 2015. PMID: 26526977 Free PMC article. - Comparison of the Clinical Characteristics and Outcomes between Leprosy-Affected Persons in Sorokdo and the General Population Affected by Chronic Hepatitis C in Korea.
Ahn YH, Park H, Lee MJ, Kim DH, Cho SB, Cho E, Jun CH, Choi SK. Ahn YH, et al. Gut Liver. 2019 Sep 15;13(5):549-556. doi: 10.5009/gnl18432. Gut Liver. 2019. PMID: 30970433 Free PMC article. - Risk Factors for Hepatitis C Virus (HCV) Infection in Areas with a High Prevalence of HCV in the Republic of Korea in 2013.
Sohn HS, Kim JR, Ryu SY, Lee YJ, Lee MJ, Min HJ, Lee J, Choi HY, Song YJ, Ki M. Sohn HS, et al. Gut Liver. 2016 Jan;10(1):126-32. doi: 10.5009/gnl14403. Gut Liver. 2016. PMID: 26260752 Free PMC article.
References
- Perz JF, Farrington LA, Pecoraro C, Hutin YJ, Armstrong GL. Estimated global prevalence of hepatitis C virus infection. Proceedings of the 42nd Annual Meeting of the Infectious Diseases Society of America; 2004 Sep 30–Oct 3; Boston, MA.
- Korea Ministry of Health and Welfare. Case definitions for national notifiable infectious disease. Cheongwon: Korea Centers for Disease Control and Prevention; 2011.
MeSH terms
LinkOut - more resources
Full Text Sources
Other Literature Sources


