Role of Blimp-1 in programing Th effector cells into IL-10 producers - PubMed (original) (raw)
. 2014 Aug 25;211(9):1807-19.
doi: 10.1084/jem.20131548. Epub 2014 Jul 29.
Frederik Heinrich 2, Katrin Neumann 1, Victoria Junghans 1, Mir-Farzin Mashreghi 2, Jonas Ahlers 1, Marko Janke 2, Christine Rudolph 1, Nadine Mockel-Tenbrinck 3, Anja A Kühl 4, Markus M Heimesaat 4, Charlotte Esser 5, Sin-Hyeog Im 6, Andreas Radbruch 2, Sascha Rutz 7, Alexander Scheffold 8
Affiliations
- PMID: 25073792
- PMCID: PMC4144744
- DOI: 10.1084/jem.20131548
Role of Blimp-1 in programing Th effector cells into IL-10 producers
Christian Neumann et al. J Exp Med. 2014.
Abstract
Secretion of the immunosuppressive cytokine interleukin (IL) 10 by effector T cells is an essential mechanism of self-limitation during infection. However, the transcriptional regulation of IL-10 expression in proinflammatory T helper (Th) 1 cells is insufficiently understood. We report a crucial role for the transcriptional regulator Blimp-1, induced by IL-12 in a STAT4-dependent manner, in controlling IL-10 expression in Th1 cells. Blimp-1 deficiency led to excessive inflammation during Toxoplasma gondii infection with increased mortality. IL-10 production from Th1 cells was strictly dependent on Blimp-1 but was further enhanced by the synergistic function of c-Maf, a transcriptional regulator of IL-10 induced by multiple factors, such as the Notch pathway. We found Blimp-1 expression, which was also broadly induced by IL-27 in effector T cells, to be antagonized by transforming growth factor (TGF) β. While effectively blocking IL-10 production from Th1 cells, TGF-β shifted IL-10 regulation from a Blimp-1-dependent to a Blimp-1-independent pathway in IL-27-induced Tr1 (T regulatory 1) cells. Our findings further illustrate how IL-10 regulation in Th cells relies on several transcriptional programs that integrate various signals from the environment to fine-tune expression of this critical immunosuppressive cytokine.
© 2014 Neumann et al.
Figures
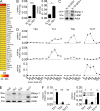
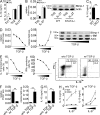
Figure 1.
Blimp-1 and c-Maf segregate with IL-10 expression in Th1 cells. (A) Heat map representation of relative expressions of transcription factors >2× up-regulated in in vitro generated IL-10–producing versus nonproducing Th1 cells. Cells were FACS-sorted according to their IL-10 secretion after IL-10 cytokine secretion assay 5 d after activation with anti-CD3/anti-CD28 MACSi Beads under Th1 skewing conditions. Probes were ranked by the difference (log2-fold) between results obtained from IL-10+Th1 cells and IL-10−Th1 cells (FC > 2). (B) Relative Prdm1 and Maf expression in FACS-sorted IL-10–secreting (IL-10+) and nonsecreting (IL-10−) Th1 cells as determined by qPCR. Cells were generated and sorted similarly to A. From left to right: ***, P = 0.0006; *, P = 0.0189. (C) Blimp-1 and c-Maf protein level in IL-10–producing (IL-10:GFP+) and nonproducing (IL-10:GFP−) in vitro generated Th1 cells from IL10:GFP reporter mice 72 h after activation as determined by immunoblot. Indication of protein size is in kD. (D) Relative Il10, Prdm1, and Maf expression time course in indicated in vitro generated Th cell subsets measured by qPCR. (E) Blimp-1 and c-Maf protein expression in indicated in vitro generated Th cell subsets as determined by immunoblot 72 h after T cell priming. Indication of protein size is in kD. (F) Comparison of Prdm1 and Maf expression, measured by qPCR, in IL-10/GFP+ versus IL-10/GFP− in vitro generated Th1, Th2, and Th17 cells. Cells were FACS-sorted 72 h after starting the Th cell cultures. From left to right: **, P = 0.0089; *, P = 0.037; *, P = 0.048; *, P = 0.043. Data are representative of at least 2 independent experiments (error bars, mean ± SEM).
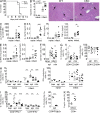
Figure 2.
Blimp-1 is critical for limiting Th1-mediated inflammation and for IL-10 production in vivo. Wild-type (_Prdm1_wt/wtCD4.Cre; WT) or conditional T cell–specific _Prdm1_-deficient (_Prdm1_fl/flCD4.Cre; CKO) mice were infected with 10 cysts of T. gondii or left uninfected (naive). Animals were sacrificed at day 8 after infection for ex vivo analysis. (A) Survival rate of WT and CKO mice after infection. (B) Degree of hepatic inflammation scored by liver histology (left). ***, P = 0.0005. Representative histology staining (H&E staining) of WT and CKO liver sections (right; Bars, 100 µm). Black arrows indicate areas of cell infiltration and necrosis. (C) Abundance of T. gondii DNA in ileal biopsies of naive and infected WT or CKO mice. (D) Serum level of IL-12p70, IFN-γ, and TNF as determined by CBA. From left to right: ***, P = 0.0004; *, P = 0.042. (E) Relative amount of IFN-γ and TNF produced during ex vivo overnight liver organ cultures as determined by CBA. *, P = 0.04. (F) Frequency of CD154+ cells among CD4+ cells isolated from spleen (spl) or mesenteric lymph nodes (mln) after ex vivo antigen-specific restimulation with TLA measured by flow cytometry. *, P = 0.01. (G) Frequency of IL-10 and IFN-γ producers among CD4+CD154+ cells after TLA restimulation analyzed by intracellular staining and flow cytometry. *, P = 0.019. (H) Frequency of IL-10+ and IFN-γ+ cells among CD4+ cells isolated from liver, spleen, and mesenteric lymph node was determined by flow cytometry after ex vivo polyclonal restimulation with PMA/ionomycin. From left to right: **, P = 0.0025; **, P = 0.0022; ***, P = 0.0001. (I) Percentage of IL-10–producing cells among CD4+ IFN-γ producing (IFN-γ+) and nonproducing (IFN-γ−) cells after PMA/ionomycin restimulation as determined by flow cytometry. From left to right: **, P = 0.0012; **, P = 0.0042; ***, P = 0.0004; **, P = 0.0027; **, P = 0.0018; *, P = 0.015. (J) Frequency of IL-10+ cells among CD4+Foxp3+ cells isolated from spleen of infected mice after PMA/ionomycin restimulation as determined by flow cytometry. ***, P = 0.001. (K) Frequency of Foxp3+ cells among CD4+ spleen lymphocytes of infected animals measured ex vivo by flow cytometry. **, P = 0.0021. Data are summarized from two (A, B, D–I; n = 4/group) or three (C; n = 4–5/group) independent experiments, or are representative of two independent experiments (J, K; n = 4/group), respectively. Horizontal bars indicate mean.
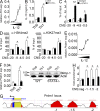
Figure 3.
Blimp-1 is crucial for IL-10 expression by Th1 cells in vitro. Naive CD4+ T cells from wild-type (WT) or conditional _Prdm1_-deficient (CKO) mice were cultured in vitro under Th1 skewing conditions. (A and B) Relative Il10 expression in WT or CKO Th1 cells and frequency of IL-10– (A) and IFN-γ–producing Th1 cells (gated on CD4+; B) 96 h after T cell priming by qPCR or intracellular staining after PMA/ionomycin restimulation, respectively. A representative dot plot is shown. From left to right: **, P = 0.0042; **, P = 0.0031. (C and D) Th1 cells were transduced with either a GFP control (GFP RV) or with a Blimp-1 (Prdm1 RV) retroviral construct. Relative Il10 expression in GFP-sorted cells and frequency of IL-10 and IFN-γ producers (gated on CD4+GFP+) 96 h after activation after PMA/ionomycin restimulation as determined by qPCR or flow cytometry, respectively. A representative dot plot is shown. From left to right: **, P = 0.0037; **, P = 0.0046. (E) Schematic representation of CNSs in the Il10 locus upstream of the TSS. Positions of CNS are given in kb relative to TSS. (F) ChIP analysis of Blimp-1 binding to CNS upstream of Il10 in Th1 cells. Th1 cells were fixed 72 h after the start of culture. *, P = 0.038. (G) ChIP analysis of histone modifications at CNS upstream of Il10 in WT and CKO Th1 cells 72 h after activation. Data are representative of three (A and B) or two (C and D) independent experiments, or data summarize three (F; duplicates/experiment) or two (G; duplicates/experiment) independent experiments, respectively, (mean ± SEM).
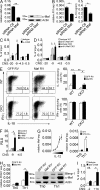
Figure 4.
Blimp-1 is strictly IL-12/STAT-4–dependent in Th1 cells. (A) Relative Il10 expression after exposure of naive Th cells to increasing amounts of rmIL-12 (0, 0.1, 1, 10, and 100 ng/ml) for 48 h as determined by qPCR. (B) Naive CD4+ T cells from wild-type (WT) or STAT4-deficient (STAT4−/−) mice were cultured in vitro under Th0 or Th1 skewing conditions, respectively. IL-10 production was measured by ELISA 72 h after Th cell priming. *, P = 0.024. (C) ChIP analysis of STAT4 binding to CNS upstream of Il10 in Th1 cells 72 h after activation. **, P = 0.0074; *, P = 0.027. (D) ChIP analysis of histone modifications at CNS upstream of Il10 in WT and STAT4−/− Th1 cells 72 h after activation. From left to right: *, P = 0.019; *, P = 0.021. (E) Relative Prdm1 expression measured by qPCR after exposure of naive Th cells to increasing amounts of rmIL-12 for 48 h. (F) Relative Prdm1 expression and Blimp-1 protein level in WT and STAT4−/− Th0 or Th1 cells 72 h after activation as determined by qPCR and immunoblot, respectively. Indication of protein size is in kD. *, P = 0.046. (G) Schematic representation of CNSs upstream of Prdm1. Positions of CNS are given in kb relative to TSS. (H) ChIP analysis of STAT4 binding to CNS upstream of Prdm1 in Th1 cells 72 h after activation. STAT4−/− Th1 cells and a region known to harbor no STAT binding sites (neg) served as negative controls. Data are presented as fold enrichment to isotype control. From left to right: *, P = 0.01; *, P = 0.019; *, P = 0.0062. Data are representative of at least 2 independent experiments (error bars, mean ± SEM).
Figure 5.
c-Maf acts synergistically with Blimp-1 to induce IL-10 in Th1 cells. (A and B) Naive CD4+ T cells were treated either with a nontargeting control siRNA (siRNA Ctl) or with a c-Maf targeting siRNA (siRNA c-Maf) before Th1 differentiation. (A) Relative Maf expression was measured by qPCR for 48 h and c-Maf protein levels were determined by immunoblot 72 h after siRNA treatment. Indication of protein size is in kD. **, P = 0.0021 (B) Relative Il10 expression determined by qPCR and IL-10 ELISA measured 72 h after the start of Th1 culture and siRNA treatment. From left to right: *, P = 0.017; *, P = 0.032. (C) ChIP analysis of c-Maf binding to CNS upstream of Il10 in Th1 cells 72 h after activation. *, P = 0.027. (D) ChIP analysis of c-Maf binding to CNS upstream of Il10 in WT or Prdm1-deficient (CKO) Th1 cells. From left to right: *, P = 0.023; *, P = 0.042. (E) WT or CKO Th1 cells were transduced with either control (GFP RV) or with a c-Maf (Maf RV) retroviral construct. Frequency of IL-10 and IFN-γ producers (gated on CD4+GFP+ cells) was determined by flow cytometry 96 h after priming of Th1 cells after PMA/ionomycin restimulation. A representative dot plot is shown. From left to right: **, P = 0.0025; **, P = 0.007; *, P = 0.021. (F) Luciferase reporter assay in HEK 293T cells transfected with indicated CNS reporter constructs together with empty vector (control), Blimp-1, and/or c-Maf expression plasmids. Firefly luciferase activity was measured 18 h after transfection and is presented relative to constitutive renilla luciferase activity. From left to right: *, P = 0.013; *, P = 0.024. (G) Relative Maf expression as determined by qPCR after exposure of naive Th cells to increasing amounts of rmIL-12 (0, 0.1, 1, 10, and 100 ng/ml) for 48 h and in WT or STAT4−/− Th0 and Th1 cells 72 h after priming of naive T cells. *, P = 0.012. (H) Relative Prdm1 expression and Blimp-1 and c-Maf Protein level in Th0 and Th1 cells after retroviral transduction with GFP RV or c-Maf RV measured by qPCR and immunoblot, respectively. Cells were FACS-sorted for GFP expression 48 h after transduction. Indication of protein size is in kD. *, P = 0.042. (I) ChIP analysis of c-Maf binding to CNS (MARE) sites in the Prdm1 locus in Th1 cells 72 h after activation. *, P = 0.033. Data are representative of four (A and B) or three (C–I) independent experiments (mean ± SEM).
Figure 6.
Notch-mediated IL-10 induction in Th1 cells requires Blimp-1. (A) Heat map representation of relative expressions of transcription factors >2× up-regulated in in vitro generated IL-10–producing versus nonproducing Th1 cells stimulated additionally with the Notch ligand Dll4. Cells were FACS-sorted according to their IL-10 secretion after IL-10 cytokine secretion assay 5 d after activation with anti-CD3/anti-CD28 MACSi beads under Th1 skewing conditions. To induce Notch activation, Th1 cells were cultured additionally in the presence of MACSi beads covalently coated with recombinant mouse Dll4. Probes were ranked by the difference (log2-fold) between results obtained from IL-10+Th1 cells and IL-10−Th1 cells (FC > 2). (B) Relative Prdm1 expression measured by qPCR and Blimp-1 protein level determined by immunoblot in Th0 and Th1 cells stimulated either in the presence (+) or absence (−) of rDll4 72 h after priming of Th cells. Indication of protein size is in kD. (C) ChIP analysis of Blimp-1 binding to CNS upstream of Il10 in Th1 cells stimulated in the presence (w/) or absence (w/o) of rDll4 72 h after activation. From left to right: *, P = 0.018; *, P = 0.042. (D) Relative Maf expression measured by qPCR and c-Maf protein level determined by immunoblot (same blot as in B) in Th0 and Th1 cells stimulated either in the presence (+) or absence (−) of rDll4 72 h after priming of Th cells. Indication of protein size is in kD. *, P = 0.036. (E) ChIP analysis of c-Maf binding to CNS upstream of Il10 in Th1 cells stimulated in the presence (w/) or absence (w/o) of rDll4 72 h after activation. From left to right: *, P = 0.027; **, P = 0.007; *, P = 0.01. (F) Wild-type (WT) or Prdm1-deficient (CKO) Th1 cells were transduced with either a control (GFP RV) or with a Notch3IC (Notch RV) retroviral construct. Relative Il10 expression in GFP-sorted cells was measured by qPCR and frequency of IL-10 and IFN-γ producers (gated on CD4+GFP+) was determined by flow cytometry 96 h after Th1 priming after PMA/ionomycin restimulation. From left to right: **, P = 0.002; **, P = 0.003; **, P = 0.002; *, P = 0.038; **, P = 0.009. Data are representative of three independent experiments (mean ± SEM).
Figure 7.
TGF-β antagonizes Blimp-1–dependent IL-10 induction in T cells. (A) Naive CD4+ T cells from wild-type (WT) or conditional _Prdm1_-deficient (CKO) mice were cultured in vitro under Th1, Th2, or Th17 skewing conditions. Production of IL-10 was measured by ELISA 72 h after priming of Th cells. *, P = 0.024. (B) Relative Prdm1 expression measured by qPCR and Blimp-1 protein levels determined by immunoblot in WT and STAT4-deficient (STAT4−/−) T cells upon stimulation with rmIL-27 for 48 h. Indication of protein size is in kD. (C) ELISA of IL-10 produced by WT or CKO T cells stimulated with rmIL-27 for 72 h. **, P = 0.0089. (D) Relative Prdm1 and Maf expression as well as Blimp-1 and c-Maf protein level in Th1 cells cultured in the presence of increasing amounts of rhTGF-β (0, 0.04, 0.2, 1, and 5 ng/ml) for 72 h as determined by qPCR and immunoblot, respectively. Indication of protein size is in kD. (E) Frequency of IL-10+ and IFN-γ+ T cells cultured under Th1 skewing conditions in the presence of increasing amounts of rhTGF-β was measured by flow cytometry after PMA/ionomycin restimulation 72 h after Th1 priming (gated on CD4+). A representative dot plot of Th1 cells cultured in the absence (w/o) or the presence (w/; 5 ng/ml) of rhTGF-β is shown. (F) Relative Prdm1 and Maf expression in T cells after stimulation with IL-27 (w/o rhTGF-β) or IL-27/rhTGF-β (w/TGF-β; 2 ng/ml) 48 h after activation as determined by qPCR. From left to right: **, P = 0.0011; **, P = 0.009. (G) ELISA of IL-10 produced by IL-27–stimulated T cells in the absence (w/o) or presence (w/) of rhTGF-β (2 ng/ml) measured 72 h after stimulation. **, P = 0.007. (H) IL-10 production by WT or CKO T cells after exposure to increasing amounts of rmIL-27 (1, 5, and 25 ng/ml) in the absence (w/o) or presence (w/; 2ng/ml) of rhTGF-β for 72 h was measured by ELISA. Data are representative of three independent experiments (mean ± SEM).
Similar articles
- New insights into Blimp-1 in T lymphocytes: a divergent regulator of cell destiny and effector function.
Fu SH, Yeh LT, Chu CC, Yen BL, Sytwu HK. Fu SH, et al. J Biomed Sci. 2017 Jul 21;24(1):49. doi: 10.1186/s12929-017-0354-8. J Biomed Sci. 2017. PMID: 28732506 Free PMC article. Review. - Chronic viral infection promotes sustained Th1-derived immunoregulatory IL-10 via BLIMP-1.
Parish IA, Marshall HD, Staron MM, Lang PA, Brüstle A, Chen JH, Cui W, Tsui YC, Perry C, Laidlaw BJ, Ohashi PS, Weaver CT, Kaech SM. Parish IA, et al. J Clin Invest. 2014 Aug;124(8):3455-68. doi: 10.1172/JCI66108. Epub 2014 Jul 8. J Clin Invest. 2014. PMID: 25003188 Free PMC article. - Interleukin-10 production by Th1 cells requires interleukin-12-induced STAT4 transcription factor and ERK MAP kinase activation by high antigen dose.
Saraiva M, Christensen JR, Veldhoen M, Murphy TL, Murphy KM, O'Garra A. Saraiva M, et al. Immunity. 2009 Aug 21;31(2):209-19. doi: 10.1016/j.immuni.2009.05.012. Epub 2009 Jul 30. Immunity. 2009. PMID: 19646904 Free PMC article. - Notch regulates IL-10 production by T helper 1 cells.
Rutz S, Janke M, Kassner N, Hohnstein T, Krueger M, Scheffold A. Rutz S, et al. Proc Natl Acad Sci U S A. 2008 Mar 4;105(9):3497-502. doi: 10.1073/pnas.0712102105. Epub 2008 Feb 21. Proc Natl Acad Sci U S A. 2008. PMID: 18292228 Free PMC article. - IL-10 production by CD4+ effector T cells: a mechanism for self-regulation.
Jankovic D, Kugler DG, Sher A. Jankovic D, et al. Mucosal Immunol. 2010 May;3(3):239-46. doi: 10.1038/mi.2010.8. Epub 2010 Mar 3. Mucosal Immunol. 2010. PMID: 20200511 Free PMC article. Review.
Cited by
- Regulation of Cathepsin E gene expression by the transcription factor Kaiso in MRL/lpr mice derived CD4+ T cells.
Hiramatsu S, Watanabe KS, Zeggar S, Asano Y, Miyawaki Y, Yamamura Y, Katsuyama E, Katsuyama T, Watanabe H, Takano-Narazaki M, Matsumoto Y, Kawabata T, Sada KE, Wada J. Hiramatsu S, et al. Sci Rep. 2019 Feb 28;9(1):3054. doi: 10.1038/s41598-019-38809-y. Sci Rep. 2019. PMID: 30816218 Free PMC article. - IL-35 promotes CD4+Foxp3+ Tregs and inhibits atherosclerosis via maintaining CCR5-amplified Treg-suppressive mechanisms.
Shao Y, Yang WY, Saaoud F, Drummer C 4th, Sun Y, Xu K, Lu Y, Shan H, Shevach EM, Jiang X, Wang H, Yang X. Shao Y, et al. JCI Insight. 2021 Oct 8;6(19):e152511. doi: 10.1172/jci.insight.152511. JCI Insight. 2021. PMID: 34622804 Free PMC article. - New insights into Blimp-1 in T lymphocytes: a divergent regulator of cell destiny and effector function.
Fu SH, Yeh LT, Chu CC, Yen BL, Sytwu HK. Fu SH, et al. J Biomed Sci. 2017 Jul 21;24(1):49. doi: 10.1186/s12929-017-0354-8. J Biomed Sci. 2017. PMID: 28732506 Free PMC article. Review. - B-cell-derived IL-10 promotes allergic sensitization in asthma regulated by Bcl-3.
Qian G, Jiang W, Sun D, Sun Z, Chen A, Fang H, Wang J, Liu Y, Yin Z, Wei H, Fang H, Zhang X. Qian G, et al. Cell Mol Immunol. 2023 Nov;20(11):1313-1327. doi: 10.1038/s41423-023-01079-w. Epub 2023 Aug 31. Cell Mol Immunol. 2023. PMID: 37653127 Free PMC article. - Molecular switches for regulating the differentiation of inflammatory and IL-10-producing anti-inflammatory T-helper cells.
Fang D, Zhu J. Fang D, et al. Cell Mol Life Sci. 2020 Jan;77(2):289-303. doi: 10.1007/s00018-019-03277-0. Epub 2019 Aug 20. Cell Mol Life Sci. 2020. PMID: 31432236 Free PMC article. Review.
References
- Apetoh, L., Quintana F.J., Pot C., Joller N., Xiao S., Kumar D., Burns E.J., Sherr D.H., Weiner H.L., and Kuchroo V.K.. 2010. The aryl hydrocarbon receptor interacts with c-Maf to promote the differentiation of type 1 regulatory T cells induced by IL-27. Nat. Immunol. 11:854–861 10.1038/ni.1912 - DOI - PMC - PubMed
Publication types
MeSH terms
Substances
LinkOut - more resources
Full Text Sources
Other Literature Sources
Molecular Biology Databases
Miscellaneous
