Mobile DNA in cancer. Extensive transduction of nonrepetitive DNA mediated by L1 retrotransposition in cancer genomes - PubMed (original) (raw)
. 2014 Aug 1;345(6196):1251343.
doi: 10.1126/science.1251343.
Yilong Li # 1, Young Seok Ju # 1, Inigo Martincorena 1, Susanna L Cooke 1, Marta Tojo 2, Gunes Gundem 1, Christodoulos P Pipinikas 3, Jorge Zamora 1, Keiran Raine 1, Andrew Menzies 1, Pablo Roman-Garcia 1, Anthony Fullam 1, Moritz Gerstung 1, Adam Shlien 1, Patrick S Tarpey 1, Elli Papaemmanuil 1, Stian Knappskog 1 4 5, Peter Van Loo 1 6, Manasa Ramakrishna 1, Helen R Davies 1, John Marshall 1, David C Wedge 1, Jon W Teague 1, Adam P Butler 1, Serena Nik-Zainal 1 7, Ludmil Alexandrov 1, Sam Behjati 1, Lucy R Yates 1, Niccolo Bolli 1 8, Laura Mudie 1, Claire Hardy 1, Sancha Martin 1, Stuart McLaren 1, Sarah O'Meara 1, Elizabeth Anderson 1, Mark Maddison 1, Stephen Gamble 1, Christopher Foster 9, Anne Y Warren 7, Hayley Whitaker 10, Daniel Brewer 11 12, Rosalind Eeles 11, Colin Cooper 11 12, David Neal 10, Andy G Lynch 10, Tapio Visakorpi 13, William B Isaacs 14, Laura Van't Veer 15, Carlos Caldas 10, Christine Desmedt 16, Christos Sotiriou 16, Sam Aparicio 17, John A Foekens 18, Jórunn Erla Eyfjörd 19, Sunil R Lakhani 20 21 22, Gilles Thomas 23, Ola Myklebost 24, Paul N Span 25, Anne-Lise Børresen-Dale 24, Andrea L Richardson 26, Marc Van de Vijver 27, Anne Vincent-Salomon 28 29, Gert G Van den Eynden 30, Adrienne M Flanagan 31 32, P Andrew Futreal 1 33, Sam M Janes 3, G Steven Bova 13, Michael R Stratton 1, Ultan McDermott 1, Peter J Campbell 1 7 8; ICGC Breast Cancer Group; ICGC Bone Cancer Group; ICGC Prostate Cancer Group
Collaborators, Affiliations
- PMID: 25082706
- PMCID: PMC4380235
- DOI: 10.1126/science.1251343
Mobile DNA in cancer. Extensive transduction of nonrepetitive DNA mediated by L1 retrotransposition in cancer genomes
Jose M C Tubio et al. Science. 2014.
Abstract
Long interspersed nuclear element-1 (L1) retrotransposons are mobile repetitive elements that are abundant in the human genome. L1 elements propagate through RNA intermediates. In the germ line, neighboring, nonrepetitive sequences are occasionally mobilized by the L1 machinery, a process called 3' transduction. Because 3' transductions are potentially mutagenic, we explored the extent to which they occur somatically during tumorigenesis. Studying cancer genomes from 244 patients, we found that tumors from 53% of the patients had somatic retrotranspositions, of which 24% were 3' transductions. Fingerprinting of donor L1s revealed that a handful of source L1 elements in a tumor can spawn from tens to hundreds of 3' transductions, which can themselves seed further retrotranspositions. The activity of individual L1 elements fluctuated during tumor evolution and correlated with L1 promoter hypomethylation. The 3' transductions disseminated genes, exons, and regulatory elements to new locations, most often to heterochromatic regions of the genome.
Copyright © 2014, American Association for the Advancement of Science.
Figures
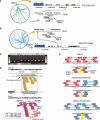
Fig. 1. Somatically acquired 3′ transductions are frequent in cancer genomes
(A) Putative translocations involving 22q12 (TTC28) show characteristics suggestive of L1-mediated 3′ transduction. Breakpoints at 22q12 (triangles of different colors) are clustered immediately after a germline full-length element. On the other side of the breakpoint, there are reads whose pairs report the presence of poly(A) tails (gray boxes). (B) Breakpoints clustered in PHACTR1 just after a polymorphic L1 element not present in the reference genome. (C) PCR profiles showing the somatic acquisition of transductions from 22q12 and 6p24. T, tumor; N, normal. (D) The hallmarks of 3′ transduction. The donor-L1 locus at chromosome 20 shows coverage increment downstream of the element resulting from genome-wide amplification of the transduced material. Reads responsible for the coverage increment pair with different chromosomes (chromosome X illustrated). A cluster of reads around the breakpoint indicates the presence of a poly(A) tail. Other reads reveal the presence of target site duplication (not shown; details in table S3). (E) The strategy followed for somatic solo-L1 and transduction identification. The pipeline relies on the identification of two read clusters (i.e., positive and negative clusters) pointing to the same region of the genome where the somatic element is inserted.
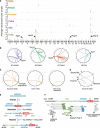
Fig. 2. The somatic L1 retrotransposition activity in 290 cancers
(A) Distribution of L1 retrotransposition activity in 290 cancers. Pie charts display the proportions of analyzed cancer samples with at least one transduction (blue), no transductions but at least one solo L1 (red), and no L1 retro-transposition (white). Bars represent the somatic L1 count of each cancer sample. Horizontal black lines indicate mean somatic retrotransposition counts for each cancer type. (B) The size distribution for L1 insertions (including solo L1s and transductions), in bins corresponding to 100-nucleotide increments in insertion lengths, shows an overrepresentation of truncated L1 insertions below 2 kb (average length of insertion is ~1.1 kb). Only insertions without 5′ inversion, or with inversion when it is lower than 500 bp, are shown. There are 81 L1 elements with estimated length >5.9 kb, of which 11 are partnered transductions.These full-length insertions represent ~5% (81/1752) of the total non–5′-inverted insertions (table S3). (C) The lengths of all L1 insertions (transductions included) are illustrated as a coverage plot over the schematic representation of a canonical solo-L1 sequence (~6 kb) and its downstream sequence (~12 kb). Most somatic L1 insertions (solo L1s and partnered transductions) are truncated at the 5′ end. For insertions with 5′ extreme inversion, the insertion length estimated corresponds to the minimal size that could be recognized (table S3), so it is underestimated. Full-length transductions and orphans mobilize nonrepetitive DNA sequences up to 12 kb away from the L1 source element end. Most of the transductions correspond to DNA material located within a distance of 1 kb to the end of the L1 source element.
Fig. 3. Somatic 3′ transductions originate from a limited repertoire of L1 source elements
(A) Rate of source element activity within and among tumor types. The y axis denotes the average number of transductions involving the given element per sample for that tumor type. (B) Individual source elements show dramatic transduction activity in some lung cancer genomes. (C) Transductions arising from somatically acquired L1 copies in a colon cancer (TCGA-D5-6540), a head and neck cancer (LB771-HNC), and a prostate cancer (PD11335a). (D) Three-hit somatic retrotransposition example. A full-length L1 element acquired somatically (first hit) generated four somatic transductions, one of which (second hit) induces further mobilization, leading to a third hit. (E) Structural configuration of the breakpoints originated in the three-hit retrotransposition example. An intact L1 is somatically retrotransposed into ANKRD62, causing further transduction of 1114 bp of ANKRD62 into DMD. A subsequent transduction picks up some of DMD together with ANKRD62 and inserts both into MYRIP on chromosome 3 (third hit). (F) Read clusters supporting breakpoints shown in (E). Paired reads are shown as boxes connected with lines, colored by the genomic region they map to.
Fig. 4. L1 source element activity waxes and wanes during tumor evolution
(A) Evolution of prostate cancer PD11335. (Left) The phylogeny shows new somatic mobilizations in each branch of the phylogenetic tree, colored by the source element that is active on that branch. (Right) The final counts for each active source element in the sample sequenced. (B) Evolution of lung cancer PD7354.TheVenn diagram shows the number of shared and nonshared somatic L1 retrotranspositions among the four samples sequenced. Source elements at 6p22 and 22q12 differed in activity between PD7354r and PD7354h (bar graph). (C) Evolution of lung cancer PD7356, sequenced at an early carcinoma in situ phase and a late invasive cancer. Somatic retrotranspositions were classified as shared between both lesions (early) or isolated to one or other lesion alone (late). Among the events isolated to only one or other lesion, there was no overlap in source elements, indicating individual activity varied during evolution of the tumor.
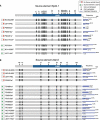
Fig. 5. Specific hypomethylation of L1 promoter of active and inactive source elements
(A and B) After bisulfite treatment of DNA and PCR amplification of L1 promoter regions composing the six most frequently active source elements, massively parallel sequencing was undertaken.The two most commonly observed haplotypes for each sample are depicted, with open circles representing CpG dinucleotides that are unmethylated and solid circles representing methylated CpG dinucleotides. The fraction of reads reporting each haplotype is shown on the right. Green circles on the left indicate which samples showed transductions derived from that source element; red circles indicate samples without activity of that source element. Asterisks after the sample name indicate tumor samples; those without asterisks are matched normal samples.
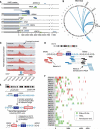
Fig. 6. Somatic shuffling of coding and regulatory regions mediated by L1 transductions
(A) Somatic transductions can mobilize coding sequences. Gray rectangles represent each L1 source element (LINE1 master), and white boxes at 5′ represent the L1 promoter. The x axis shows the distance downstream of the source element. Exons are represented by green rectangles. Blue lines represent the region transduced elsewhere in the genome. (B) In PD7354, the Circos (
) plot shows transductions mediated by the source element at chromosome 7q34 involved in the somatic amplification of OR9A4. (C) Coverage increment demonstrating amplification of OR9A4 in different samples of tumor PD7354. (D) Read clusters supporting the integration of STK31 exon into chromosome 14, with the sequence of events shown in (E). (E) Structural configuration of breakpoints involved in the STK31 exon shuffling mediated by a somatic L1 element. An intact, transduction-competent L1 element inserts somatically immediately downstream of an exon of STK31. A further partnered transduction event occurs in which the exon of STK31 and a portion of the somatic L1 element retrotranspose to an intron of NRXN3. (F) Somatic transductions frequently mobilize DNA sequences with regulatory potential. Gray rectangles represent the 3′ end of the L1 source elements. The x axis shows the distance downstream of each source element. Green rectangles represent DNAse-I–hypersensitive sites, and horizontal blue lines represent transcription factor binding sites. Every vertical red line represents the end point of a somatic transduction event.
Fig. 7. Gene expression effects associated with L1 insertions
(A) For lung and colon cancers, each bar represents the difference between the log10 (FPKM) for the target gene in the relevant sample compared to the average log10(FPKM) for other samples of that tumor type. FPKM, fragments per kilobase of transcript per million mapped reads. Genes with FPKM > 1 average expression have darker bars. (B) Scatter plot showing the data in (A).The y axis shows the log10(FPKM) for the target gene in the relevant sample, and the x axis shows the average log10(FPKM) for that gene for other samples of that tumor type. In expressed genes [mean log10(FPKM) > 0], the expression level in the affected sample is very close to the overall expression level of the gene in the corresponding tissue. Most large expression level differences occur at unex-pressed genes [mean log10(FPKM) < 0].
Fig 8. Somatic L1 insertions favor heterochromatin
(A) Bars show number of elements per 10-Mb window. Red bars represent the 13 regions with overrepresentation of elements. Asterisk represents hotspots of TEs in the cancer genome (i.e., 10 or more elements are clustered together within a region of 1 to 1.5 Mb). (B) Somatic integrations of TEs are more abundant far away from the transcription start site of the nearest gene.The x axis shows the rate of observed versus expected somatic insertions.The y axis shows the distance to the transcription start site of the nearest gene. (C) Somatic integrations of TEs are more frequently associated with exon-poor regions of the cancer genome.The x axis shows the number of somaticTEs in windows of 3 Mb of the genome, whereas the y axis shows the density of exons.Windows at chromosome 5p, which showed the highest somaticTE insertion rates in the cancer genome, are highlighted. (D) TEs are enriched in lowly expressed genes (<3 FPKM) relative to highly expressed genes. (E) Overall, TEs are overrepresented in transcriptionally repressed regions of the genome (most likely heterochromatic), similar to previous observations of point mutations in cancer (37). The relative abundance of insertions in repressed chromatin is 4.55 times higher than in transcriptionally active regions of the genome. R, repressed; T, transcriptionally active; CTCF, CCCTC binding factor–enriched element; E/WE, enhancer or weak enhancer regions;TSS/PF, promoters and flanking regions. Error bars reflect Poisson confidence intervals. (F) Average rate of TE insertions and synonymous point mutations in repressed and active chromatin.The difference in mutation rate between repressed and active chromatin is much larger in TE insertions relative to point mutations.
Similar articles
- Widespread somatic L1 retrotransposition in normal colorectal epithelium.
Nam CH, Youk J, Kim JY, Lim J, Park JW, Oh SA, Lee HJ, Park JW, Won H, Lee Y, Jeong SY, Lee DS, Oh JW, Han J, Lee J, Kwon HW, Kim MJ, Ju YS. Nam CH, et al. Nature. 2023 May;617(7961):540-547. doi: 10.1038/s41586-023-06046-z. Epub 2023 May 10. Nature. 2023. PMID: 37165195 Free PMC article. - Pan-cancer analysis of whole genomes identifies driver rearrangements promoted by LINE-1 retrotransposition.
Rodriguez-Martin B, Alvarez EG, Baez-Ortega A, Zamora J, Supek F, Demeulemeester J, Santamarina M, Ju YS, Temes J, Garcia-Souto D, Detering H, Li Y, Rodriguez-Castro J, Dueso-Barroso A, Bruzos AL, Dentro SC, Blanco MG, Contino G, Ardeljan D, Tojo M, Roberts ND, Zumalave S, Edwards PA, Weischenfeldt J, Puiggròs M, Chong Z, Chen K, Lee EA, Wala JA, Raine KM, Butler A, Waszak SM, Navarro FCP, Schumacher SE, Monlong J, Maura F, Bolli N, Bourque G, Gerstein M, Park PJ, Wedge DC, Beroukhim R, Torrents D, Korbel JO, Martincorena I, Fitzgerald RC, Van Loo P, Kazazian HH, Burns KH; PCAWG Structural Variation Working Group; Campbell PJ, Tubio JMC; PCAWG Consortium. Rodriguez-Martin B, et al. Nat Genet. 2020 Mar;52(3):306-319. doi: 10.1038/s41588-019-0562-0. Epub 2020 Feb 5. Nat Genet. 2020. PMID: 32024998 Free PMC article. - The Role of Somatic L1 Retrotransposition in Human Cancers.
Scott EC, Devine SE. Scott EC, et al. Viruses. 2017 May 31;9(6):131. doi: 10.3390/v9060131. Viruses. 2017. PMID: 28561751 Free PMC article. Review. - Multiple fates of L1 retrotransposition intermediates in cultured human cells.
Gilbert N, Lutz S, Morrish TA, Moran JV. Gilbert N, et al. Mol Cell Biol. 2005 Sep;25(17):7780-95. doi: 10.1128/MCB.25.17.7780-7795.2005. Mol Cell Biol. 2005. PMID: 16107723 Free PMC article. - Biology of mammalian L1 retrotransposons.
Ostertag EM, Kazazian HH Jr. Ostertag EM, et al. Annu Rev Genet. 2001;35:501-38. doi: 10.1146/annurev.genet.35.102401.091032. Annu Rev Genet. 2001. PMID: 11700292 Review.
Cited by
- The genomic landscape of 2,023 colorectal cancers.
Cornish AJ, Gruber AJ, Kinnersley B, Chubb D, Frangou A, Caravagna G, Noyvert B, Lakatos E, Wood HM, Thorn S, Culliford R, Arnedo-Pac C, Househam J, Cross W, Sud A, Law P, Leathlobhair MN, Hawari A, Woolley C, Sherwood K, Feeley N, Gül G, Fernandez-Tajes J, Zapata L, Alexandrov LB, Murugaesu N, Sosinsky A, Mitchell J, Lopez-Bigas N, Quirke P, Church DN, Tomlinson IPM, Sottoriva A, Graham TA, Wedge DC, Houlston RS. Cornish AJ, et al. Nature. 2024 Sep;633(8028):127-136. doi: 10.1038/s41586-024-07747-9. Epub 2024 Aug 7. Nature. 2024. PMID: 39112709 Free PMC article. - Transposon DNA sequences facilitate the tissue-specific gene transfer of circulating tumor DNA between human cells.
Cinar M, Martinez-Medina L, Puvvula PK, Arakelyan A, Vardarajan BN, Anthony N, Nagaraju GP, Park D, Feng L, Sheff F, Mosunjac M, Saxe D, Flygare S, Alese OB, Kaufman JL, Lonial S, Sarmiento JM, Lossos IS, Vertino PM, Lopez JA, El-Rayes B, Bernal-Mizrachi L. Cinar M, et al. Nucleic Acids Res. 2024 Jul 22;52(13):7539-7555. doi: 10.1093/nar/gkae427. Nucleic Acids Res. 2024. PMID: 38783375 Free PMC article. - Disentangling oncogenic amplicons in esophageal adenocarcinoma.
Ng AWT, McClurg DP, Wesley B, Zamani SA, Black E, Miremadi A, Giger O, Hoopen RT, Devonshire G, Redmond AM, Grehan N, Jammula S, Blasko A, Li X, Aparicio S, Tavaré S; Oesophageal Cancer Clinical and Molecular Stratification (OCCAMS) Consortium; Nowicki-Osuch K, Fitzgerald RC. Ng AWT, et al. Nat Commun. 2024 May 14;15(1):4074. doi: 10.1038/s41467-024-47619-4. Nat Commun. 2024. PMID: 38744814 Free PMC article. - Contribution of de novo retroelements to birth defects and childhood cancers.
Chu C, Ljungström V, Tran A, Jin H, Park PJ. Chu C, et al. medRxiv [Preprint]. 2024 Apr 16:2024.04.15.24305733. doi: 10.1101/2024.04.15.24305733. medRxiv. 2024. PMID: 38699361 Free PMC article. Preprint. - APOBEC shapes tumor evolution and age at onset of lung cancer in smokers.
Zhang T, Sang J, Hoang PH, Zhao W, Rosenbaum J, Johnson KE, Klimczak LJ, McElderry J, Klein A, Wirth C, Bergstrom EN, Díaz-Gay M, Vangara R, Colon-Matos F, Hutchinson A, Lawrence SM, Cole N, Zhu B, Przytycka TM, Shi J, Caporaso NE, Homer R, Pesatori AC, Consonni D, Imielinski M, Chanock SJ, Wedge DC, Gordenin DA, Alexandrov LB, Harris RS, Landi MT. Zhang T, et al. bioRxiv [Preprint]. 2024 Apr 3:2024.04.02.587805. doi: 10.1101/2024.04.02.587805. bioRxiv. 2024. PMID: 38617360 Free PMC article. Preprint.
References
- Lander ES, et al. Initial sequencing and analysis of the human genome. Nature. 2001;409:860–921. doi: 10.1038/ 35057062; pmid: 11237011. - PubMed
- Kazazian HH., Jr Mobile elements: Drivers of genome evolution. Science. 2004;303:1626–1632. doi: 10.1126/ science.1089670; pmid: 15016989. - PubMed
- Sassaman DM, et al. Many human L1 elements are capable of retrotransposition. Nat. Genet. 1997;16:37–43. doi: 10.1038/ng0597-37; pmid: 9140393. - PubMed
Publication types
MeSH terms
Substances
Grants and funding
- DH_/Department of Health/United Kingdom
- G0900871/MRC_/Medical Research Council/United Kingdom
- P30 CA006973/CA/NCI NIH HHS/United States
- 16942/CRUK_/Cancer Research UK/United Kingdom
- 14835/CRUK_/Cancer Research UK/United Kingdom
- 15007/CRUK_/Cancer Research UK/United Kingdom
- 091730/WT_/Wellcome Trust/United Kingdom
- WT100183MA/WT_/Wellcome Trust/United Kingdom
- 17528/CRUK_/Cancer Research UK/United Kingdom
- 088340/WT_/Wellcome Trust/United Kingdom
- WT_/Wellcome Trust/United Kingdom
- C5047/A14835/CRUK_/Cancer Research UK/United Kingdom
LinkOut - more resources
Full Text Sources
Other Literature Sources


