An olfactory cocktail party: figure-ground segregation of odorants in rodents - PubMed (original) (raw)
. 2014 Sep;17(9):1225-32.
doi: 10.1038/nn.3775. Epub 2014 Aug 3.
Affiliations
- PMID: 25086608
- PMCID: PMC4146660
- DOI: 10.1038/nn.3775
An olfactory cocktail party: figure-ground segregation of odorants in rodents
Dan Rokni et al. Nat Neurosci. 2014 Sep.
Abstract
In odorant-rich environments, animals must be able to detect specific odorants of interest against variable backgrounds. However, studies have found that both humans and rodents are poor at analyzing the components of odorant mixtures, suggesting that olfaction is a synthetic sense in which mixtures are perceived holistically. We found that mice could be easily trained to detect target odorants embedded in unpredictable and variable mixtures. To relate the behavioral performance to neural representation, we imaged the responses of olfactory bulb glomeruli to individual odors in mice expressing the Ca(2+) indicator GCaMP3 in olfactory receptor neurons. The difficulty of segregating the target from the background depended strongly on the extent of overlap between the glomerular responses to target and background odors. Our study indicates that the olfactory system has powerful analytic abilities that are constrained by the limits of combinatorial neural representation of odorants at the level of the olfactory receptors.
Figures
Figure 1. The behavioral task
(a) The mixtures presented to one mouse during the first 7 training sessions. Each row in the raster (bright ticks indicate presence of odorant) represents a single odorant and each column represents a trial. Odorants 7 and 8 were the targets for this mouse (red arrows to left). Above are the distributions of the number of components in the mixture used at each stage of the training. (b) The average number of components in the mixture in each 100 trial block (black) and the percent of mixtures that the mouse encounters for the first time (red). (c) The percent of correct trials in each 100 trial block. (d) Left: The average learning curve of 10 mice. Right: The last 200 trials performed with odorant cues and the first 200 trials performed when the target odorant tube was replaced with an empty tube or with a background odorant tube. Both plots show the mean ± SE. (e) Percent of correct trials as a function of the number of components in the mixture for all trials (black), Go trials (blue), and NoGo trials (red). Symbols represent the mean and error bars show a 95% confidence interval. Lines are linear fits to the data.
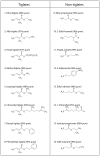
Figure 2. The odorants used in the behavioral task
Names, purity and molecular structures of all odorants that were used in this study are shown.
Figure 3. Decreased performance on mixtures with more odorant components is not explained by a limited sampling time
(a) The distribution of response latencies (top) and session normalized response latencies (bottom; see methods). (b) Response latency (top) and normalized response latency (bottom) as a function of the number of components in the mixture. Shown are mean ± SE (•) and median (*). (c) Normalized latency distributions for mixture of up to 4 odorants (top), 5 to 10 odorants (middle), and more than 10 odorants (bottom). The curves show the percent of correct responses as a function of normalized latency for the three mixture ranges. (d) The curves from c superimposed without scaling (top) and after scaling (bottom). Symbols show the mean and error bars show a 95% confidence interval.
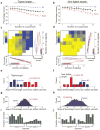
Figure 4. Performance depends on background components that are similar to the target
(a,b) Behavioral performance as a function of the number of background components for mice trained to detect tiglate targets (a), and mice trained to detect non-tiglate targets (b). (c,d) Behavioral performance as a function of the number of tiglates and non-tiglates in the background for mice trained to detect tiglate targets (c) and mice trained to detect non-tiglate targets (d). Bottom panels show linear fits to the rows of the colored matrices. Right panels show linear fits to the columns of the colored matrices. (e,f) The slopes of the linear fits from c and d respectively. Blue and red arrows show the mean slope for tiglates and non-tiglates, respectively. (g,h) The distributions of the effects of all 12780 possible 8 odorant groups on the performance of mice detecting tiglates (g) and mice detecting non-tiglates (h). Blue and red arrows mark the group effects of tiglates and non-tiglates, respectively, obtained from e and f. (i,j) The composition of the 50 groups that had the strongest negative effects on performance of mice detecting tiglate targets (i) and mice detecting non-tiglate targets (j). The bar for each odorant shows the fraction of the 50 groups in which it was a member.
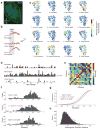
Figure 5. Tiglates evoke correlated glomerular response patterns
(a) Raw fluorescence image of the olfactory bulb of an OMP-GCaMP3 mouse to highlight a typical imaged region (white dashed line). (b-e) Analysis of the responses recorded from one mouse. (b) The time course of the responses in the glomerulus marked by an arrow in c (top left panel) to three odorants. The mean response is shown in black and the SE in red (n=5 repetitions). (c) Glomerular response patterns elicited by each of the 16 odorants. Putative glomeruli were selected as regions of interest (ROIs) and the response magnitude for each ROI is color coded. Odorants 1-8 are tiglates. (d) The responses of all glomeruli to three odorants represented as response vectors. Mean responses are shown in gray and the standard error of the mean in red (n=5 repetitions). (e) The correlation matrix of the odorant responses shown in b. Tiglate to tiglate correlations are shown in the bottom left quadrant (odorants 1 to 8). (f) The distribution of correlation coefficients of tiglate to tiglate (top), non-tiglate to non-tiglate (middle) and tiglate to non-tiglate (bottom). Data is pooled from all experiments (n=6). Colored arrows in each plot show the distribution median. (g) The same distributions as in f plotted as cumulative distributions to promote visualization of the differences. (h) The separability of all 12870 possible groups of 8 odorants as measured by Kolmogorov-Smirnov distance between the distributions of correlation coefficients within a group and across groups. Blue arrow denotes the Kolmogorov-Smirnov distance between tiglate to tiglate correlations and tiglate to non-tiglate correlations.
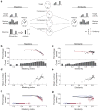
Figure 6. Performance on the task depends on masking at the level of olfactory bulb inputs
(a) Estimation of the masking of target inputs to the olfactory bulb by a background mixture (left), and of the correlation between target and mixture inputs (right). Mixture responses are modeled as the linear sum of the responses to the individual components. Masking (bound between 0 and 1) is calculated for each target-activated glomerulus and the masking of all glomeruli is then averaged to obtain the mixture masking value. Gray scale levels in the cartoon glomeruli denote activity level. (b,c) Percent of NoGo trials that were correctly rejected as a function of target masking (b) and target-mixture correlation (c). Data was binned to have 500 trials in each bin. Red lines are fits of a logistic sigmoidal decay to the data (see methods). Below are the distributions of masking and correlation values for all mixtures presented in NoGo trials. (d,e) Average number of components in the mixture as a function of mixture masking (d) and target-mixture correlation (e). (f,g) Percent of NoGo trials with fixed number of components in the mixture that were correctly rejected as a function of target masking (f) and target-mixture correlation (g). Each curve shows the data from a fixed number of components in the mixture (indicated by color). Symbols show the average percent of correct rejections.
Comment in
- Scenting Waldo: analyzing olfactory scenes.
Holy TE. Holy TE. Nat Neurosci. 2014 Sep;17(9):1144-5. doi: 10.1038/nn.3796. Nat Neurosci. 2014. PMID: 25157510 - Analysis and synthesis in olfaction.
Rokni D, Murthy VN. Rokni D, et al. ACS Chem Neurosci. 2014 Oct 15;5(10):870-2. doi: 10.1021/cn500199n. Epub 2014 Sep 19. ACS Chem Neurosci. 2014. PMID: 25238650 Free PMC article.
Similar articles
- Analysis and synthesis in olfaction.
Rokni D, Murthy VN. Rokni D, et al. ACS Chem Neurosci. 2014 Oct 15;5(10):870-2. doi: 10.1021/cn500199n. Epub 2014 Sep 19. ACS Chem Neurosci. 2014. PMID: 25238650 Free PMC article. - Scenting Waldo: analyzing olfactory scenes.
Holy TE. Holy TE. Nat Neurosci. 2014 Sep;17(9):1144-5. doi: 10.1038/nn.3796. Nat Neurosci. 2014. PMID: 25157510 - Normalized Neural Representations of Complex Odors.
Zwicker D. Zwicker D. PLoS One. 2016 Nov 11;11(11):e0166456. doi: 10.1371/journal.pone.0166456. eCollection 2016. PLoS One. 2016. PMID: 27835696 Free PMC article. - The olfactory bulb: coding and processing of odor molecule information.
Mori K, Nagao H, Yoshihara Y. Mori K, et al. Science. 1999 Oct 22;286(5440):711-5. doi: 10.1126/science.286.5440.711. Science. 1999. PMID: 10531048 Review. - Odorant receptors in the formation of the olfactory bulb circuitry.
Lodovichi C, Belluscio L. Lodovichi C, et al. Physiology (Bethesda). 2012 Aug;27(4):200-12. doi: 10.1152/physiol.00015.2012. Physiology (Bethesda). 2012. PMID: 22875451 Review.
Cited by
- High-speed odor sensing using miniaturized electronic nose.
Dennler N, Drix D, Warner TPA, Rastogi S, Casa CD, Ackels T, Schaefer AT, van Schaik A, Schmuker M. Dennler N, et al. Sci Adv. 2024 Nov 8;10(45):eadp1764. doi: 10.1126/sciadv.adp1764. Epub 2024 Nov 6. Sci Adv. 2024. PMID: 39504378 - Odour generalisation and detection dog training.
Caldicott L, Pike TW, Zulch HE, Mills DS, Williams FJ, Elliker KR, Hutchings B, Wilkinson A. Caldicott L, et al. Anim Cogn. 2024 Nov 1;27(1):73. doi: 10.1007/s10071-024-01907-0. Anim Cogn. 2024. PMID: 39485633 Free PMC article. Review. - Distinct information conveyed to the olfactory bulb by feedforward input from the nose and feedback from the cortex.
Zak JD, Reddy G, Konanur V, Murthy VN. Zak JD, et al. Nat Commun. 2024 Apr 16;15(1):3268. doi: 10.1038/s41467-024-47366-6. Nat Commun. 2024. PMID: 38627390 Free PMC article. - The Effect of Micronutrients on Obese Phenotype of Adult Mice Is Dependent on the Experimental Environment.
Yang Z, Kubant R, Kranenburg E, Cho CE, Anderson GH. Yang Z, et al. Nutrients. 2024 Feb 29;16(5):696. doi: 10.3390/nu16050696. Nutrients. 2024. PMID: 38474824 Free PMC article. - Imaging different cell populations in the mouse olfactory bulb using the genetically encoded voltage indicator ArcLight.
Leong LM, Storace DA. Leong LM, et al. Neurophotonics. 2024 Jul;11(3):033402. doi: 10.1117/1.NPh.11.3.033402. Epub 2024 Jan 17. Neurophotonics. 2024. PMID: 38288247 Free PMC article. Review.
References
- Apfelbach R, Blanchard CD, Blanchard RJ, Hayes RA, McGregor IS. The effects of predator odors in mammalian prey species: A review of field and laboratory studies. Neurosci Biobehav Rev. 2005;29:1123–1144. - PubMed
- Howard WE, Marsh RE, Cole RE. Food detection by deer mice using olfactory rather than visual cues. Anim Behav. 1968;16:13–17. - PubMed
- Blaustein AR. Sexual Selection and Mammalian Olfaction. Am Nat. 1981;117:1006–1010.
- Wolfson SS, Landy MS. Examining edge- and region-based texture analysis mechanisms. Vision Res. 1998;38:439–446. - PubMed
Publication types
MeSH terms
Substances
LinkOut - more resources
Full Text Sources
Other Literature Sources
Molecular Biology Databases
Miscellaneous


