Transcriptome sequencing reveals altered long intergenic non-coding RNAs in lung cancer - PubMed (original) (raw)
Transcriptome sequencing reveals altered long intergenic non-coding RNAs in lung cancer
Nicole M White et al. Genome Biol. 2014.
Abstract
Background: Long intergenic non-coding RNAs (lncRNAs) represent an emerging and under-studied class of transcripts that play a significant role in human cancers. Due to the tissue- and cancer-specific expression patterns observed for many lncRNAs it is believed that they could serve as ideal diagnostic biomarkers. However, until each tumor type is examined more closely, many of these lncRNAs will remain elusive.
Results: Here we characterize the lncRNA landscape in lung cancer using publicly available transcriptome sequencing data from a cohort of 567 adenocarcinoma and squamous cell carcinoma tumors. Through this compendium we identify over 3,000 unannotated intergenic transcripts representing novel lncRNAs. Through comparison of both adenocarcinoma and squamous cell carcinomas with matched controls we discover 111 differentially expressed lncRNAs, which we term lung cancer-associated lncRNAs (LCALs). A pan-cancer analysis of 324 additional tumor and adjacent normal pairs enable us to identify a subset of lncRNAs that display enriched expression specific to lung cancer as well as a subset that appear to be broadly deregulated across human cancers. Integration of exome sequencing data reveals that expression levels of many LCALs have significant associations with the mutational status of key oncogenes in lung cancer. Functional validation, using both knockdown and overexpression, shows that the most differentially expressed lncRNA, LCAL1, plays a role in cellular proliferation.
Conclusions: Our systematic characterization of publicly available transcriptome data provides the foundation for future efforts to understand the role of LCALs, develop novel biomarkers, and improve knowledge of lung tumor biology.
Figures
Figure 1
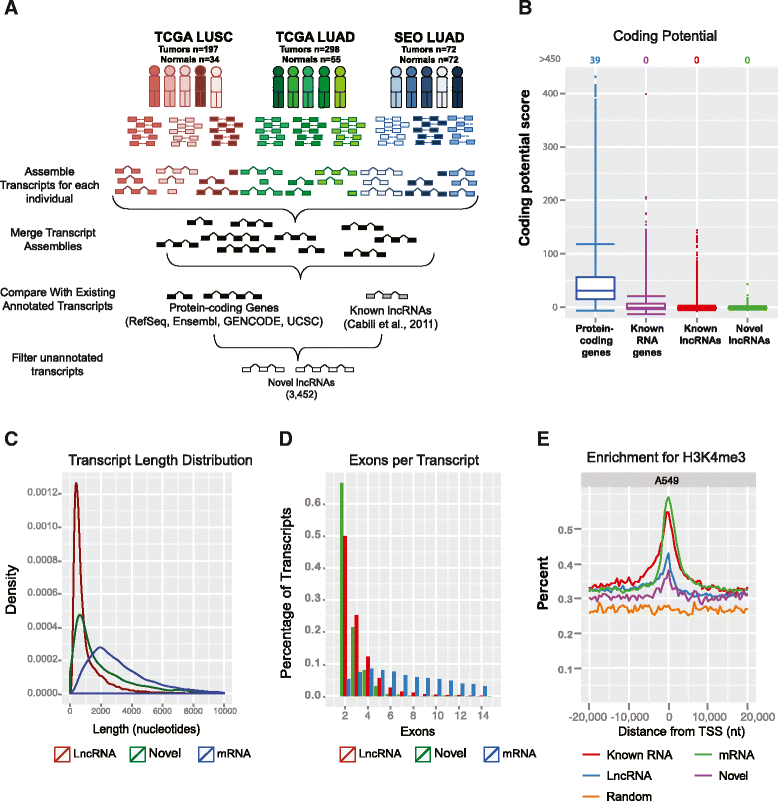
L ncRNA transcript characterization. (A) Schematic of experimental workflow and RNA-Seq analysis. (B) Coding potential of unannotated transcripts using GeneID. Values at the top indicate the number of genes above 450. (C) Distribution of transcript lengths for lncRNAs (red), novel transcripts (green), and protein-coding genes (blue). (D) Distribution of number of exons per transcript for lncRNAs (red), novel transcripts (green), and protein-coding genes (blue). (E) H3K4me3 histone modifications associated with active promoters in A549 cells. nt, nucleotides; TSS, transcriptional start site.
Figure 2
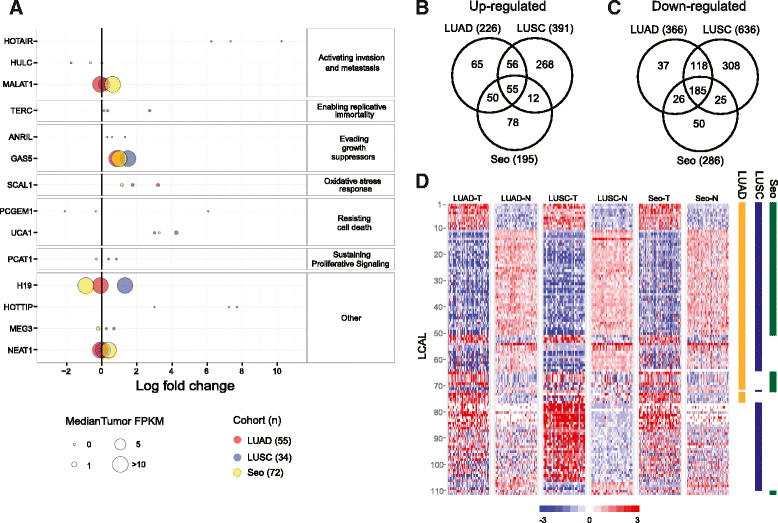
Altered lncRNAs across lung cancer subtypes. (A) Expression levels of lncRNAs with known oncogenic function across three lung cohorts, denoted by different colors. The size of each point is proportional to average FPKM expression across the tumors for up-regulated lncRNAs or across the normal tissues for down-regulated lncRNAs. The x-axis shows log2 fold change of tumor relative to normal. (B,C) Venn diagrams showing the overlap of significantly up-regulated lncRNAs (B) and down-regulated lncRNAs (C). (D) Expression levels of tumor and normal samples for each cohort across the 111 LCALs. Colored bars to the right designate in which cohort(s) a given LCAL is differentially expressed.
Figure 3
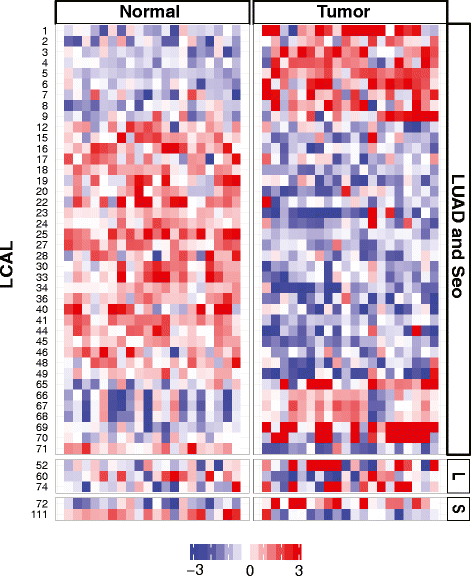
Independent validation of lung cancer-associated lncRNAs. Heatmap of 45 LCALs confirmed as differentially expressed in lung adenocarcinoma tumor and matched normal tissues by Human Exon Array. LCALs are grouped by the RNA-Seq cohort in which they were called significant: LUAD and Seo, LUAD only (denoted 'L'), and Seo only (denoted 'S').
Figure 4
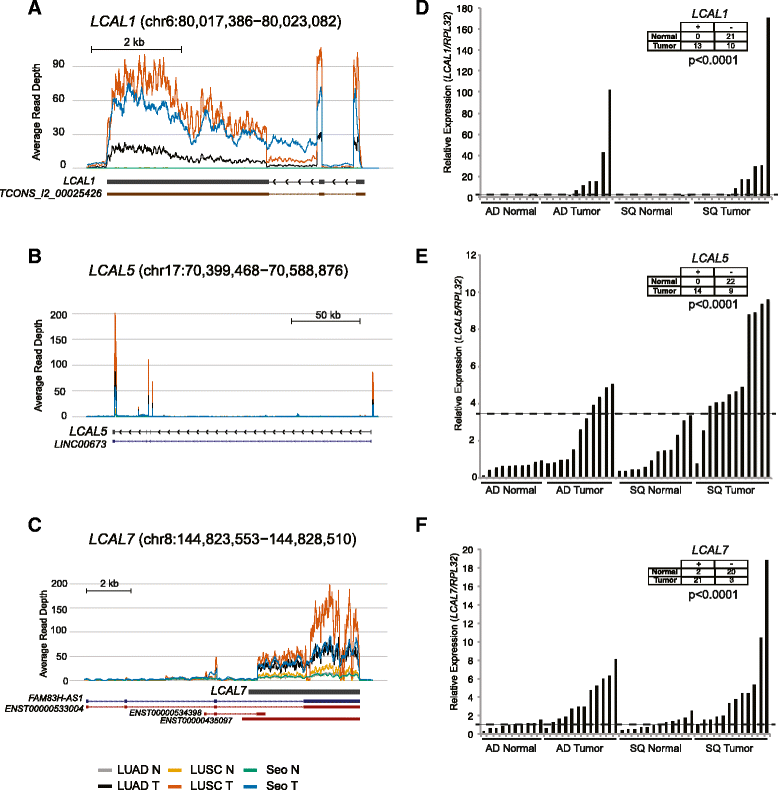
LCAL expression in lung cancer. (A-C) Coverage maps showing the average expression levels of tumor and normal samples across all three lung cancer cohorts for LCAL1 (A), LCAL5 (B), and LCAL7 (C). Annotated RefSeq (dark blue), Ensembl (red), Human Body Map lncRNAs (brown), and full-length transcripts as determined by 5’ and 3’ RACE in H322M cell line (black) are shown below each plot. (D-F) qPCR validation in an independent cohort of human adenocarcinoma and matched controls and squamous cell carcinoma and matched controls for LCAL1 (D), LCAL5 (E), and LCAL7 (F). Insert tables distinguish ‘high’ and ‘low’ expression of LCALs in tumors using the value as denoted by the dotted line.
Figure 5
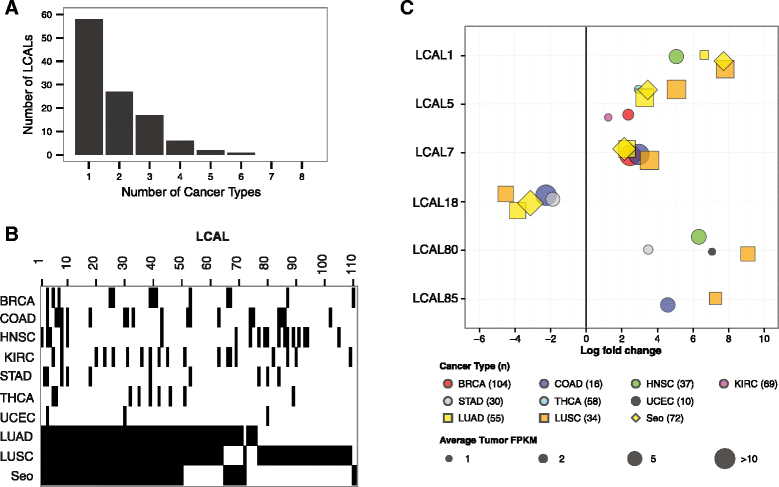
Aberrantly expressed lncRNAs across human cancers. (A) Distribution of the number of cancer types in which LCALs are differentially expressed. All lung cohorts were considered as one cancer type, and x = 1 corresponds to differentially expressed in lung only. (B) Heatmap showing the distribution of differentially expressed LCALs across the three lung cohorts and seven additional TCGA cohorts. Black bars designate that an LCAL is differentially expressed in a given cancer. (C) Expression levels and fold changes for six LCALs that were experimentally validated. The size of each point is proportional to average FPKM expression across the tumors for up-regulated lncRNAs or across the normal tissues for down-regulated lncRNAs. Colors and symbols correspond to cancer type. Only cancer types in which the LCAL is differentially expressed are plotted. BRCA, breast invasive carcinoma; COAD, colon adenocarcinoma; HNSC, head and neck squamous cell carcinoma; KIRC, kidney renal clear cell carcinoma; STAD, stomach adenocarcinoma; THCA, thyroid carcinoma; UCEC, uterine corpus endometrial carcinoma.
Figure 6
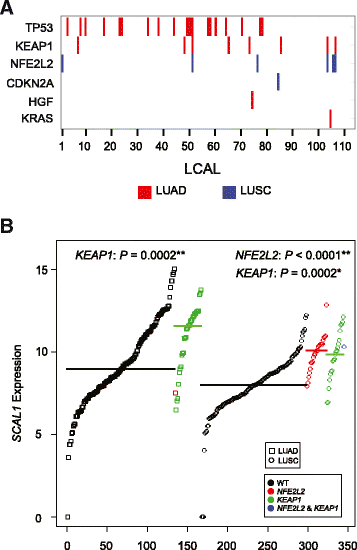
Association between LCAL expression and mutation status. (A) Significant associations between LCAL expression and mutation status. Red bars designate significant associations (false discovery rate (FDR) <0.01) across LUAD tumors and blue bars across LUSC tumors. (B) Expression levels of SCAL1 (LCAL51), measured by log2 FPKM, for wild-type (WT; black), NFE2L2 mutant (red), KEAP1 mutant (green), and both NFE2L2 and KEAP1 mutant (blue) samples. Data points are ordered by expression levels and symbols designate cohort (squares for LUAD, circles for LUSC). Thick colored lines represent the median expression levels across each group. _P_-values for each mutational association are also reported (*FDR <0.05, **FDR <0.01).
Figure 7
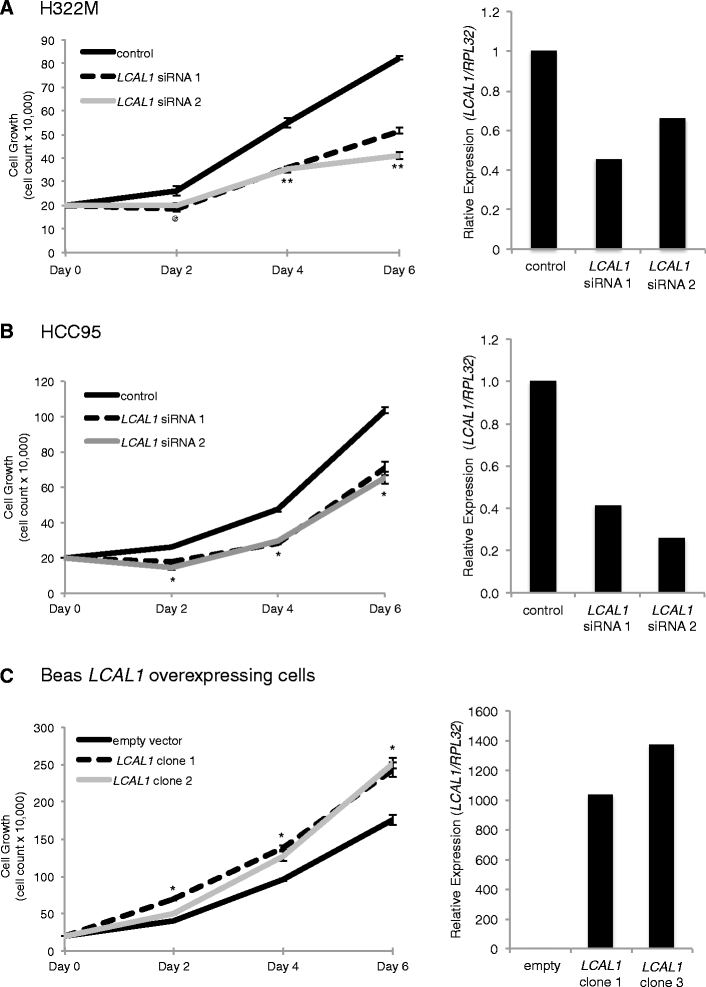
LCAL1 expression affects cell growth. (A, B) Cell proliferation assay in H322M (A) and HCC95 (B) cells using LCAL1 siRNAs. qPCR validation of LCAL1 siRNA knockdown is shown on the right. (C) Cell proliferation assay in BEAS-2B overexpressing clones of LCAL1 with qPCR validation of LCAL1 expression in BEAS-2B cells on the right. @ P ≤ 0.05, *P ≤ 0.01, **P ≤ 0.001 by a two-tailed Student’s _t_-test. The same significance applies for siRNA 1 and siRNA 2 at all time points. All error bars are mean ± standard error of the mean across n = 3 biological replicates in two independent experiments.
Similar articles
- Transcriptome profiling of lncRNA and co-expression networks in esophageal squamous cell carcinoma by RNA sequencing.
Li Y, Shi X, Yang W, Lu Z, Wang P, Chen Z, He J. Li Y, et al. Tumour Biol. 2016 Oct;37(10):13091-13100. doi: 10.1007/s13277-016-5227-3. Epub 2016 Jul 23. Tumour Biol. 2016. PMID: 27449043 - Systematic identification of cancer-related long noncoding RNAs and aberrant alternative splicing of quintuple-negative lung adenocarcinoma through RNA-Seq.
Zhang L, Li S, Choi YL, Lee J, Gong Z, Liu X, Pei Y, Jiang A, Ye M, Mao M, Zhang X, Kim J, Chen R. Zhang L, et al. Lung Cancer. 2017 Jul;109:21-27. doi: 10.1016/j.lungcan.2017.04.009. Epub 2017 Apr 21. Lung Cancer. 2017. PMID: 28577945 - Comprehensive analysis of lncRNA expression profiles and identification of functional lncRNAs in lung adenocarcinoma.
Qiu M, Feng D, Zhang H, Xia W, Xu Y, Wang J, Dong G, Zhang Y, Yin R, Xu L. Qiu M, et al. Oncotarget. 2016 Mar 29;7(13):16012-22. doi: 10.18632/oncotarget.7559. Oncotarget. 2016. PMID: 26918601 Free PMC article. - Long noncoding RNAs: new insights into non-small cell lung cancer biology, diagnosis and therapy.
Ricciuti B, Mencaroni C, Paglialunga L, Paciullo F, Crinò L, Chiari R, Metro G. Ricciuti B, et al. Med Oncol. 2016 Feb;33(2):18. doi: 10.1007/s12032-016-0731-2. Epub 2016 Jan 19. Med Oncol. 2016. PMID: 26786153 Review. - Unraveling the oral cancer lncRNAome: Identification of novel lncRNAs associated with malignant progression and HPV infection.
Nohata N, Abba MC, Gutkind JS. Nohata N, et al. Oral Oncol. 2016 Aug;59:58-66. doi: 10.1016/j.oraloncology.2016.05.014. Oral Oncol. 2016. PMID: 27424183 Free PMC article. Review.
Cited by
- PD-L1 lncRNA splice isoform promotes lung adenocarcinoma progression via enhancing c-Myc activity.
Qu S, Jiao Z, Lu G, Yao B, Wang T, Rong W, Xu J, Fan T, Sun X, Yang R, Wang J, Yao Y, Xu G, Yan X, Wang T, Liang H, Zen K. Qu S, et al. Genome Biol. 2021 Apr 13;22(1):104. doi: 10.1186/s13059-021-02331-0. Genome Biol. 2021. PMID: 33849634 Free PMC article. - MBRidge: an accurate and cost-effective method for profiling DNA methylome at single-base resolution.
Cai W, Mao F, Teng H, Cai T, Zhao F, Wu J, Sun ZS. Cai W, et al. J Mol Cell Biol. 2015 Aug;7(4):299-313. doi: 10.1093/jmcb/mjv037. Epub 2015 Jun 15. J Mol Cell Biol. 2015. PMID: 26078362 Free PMC article. - Long Non-coding RNA LINC01234 Regulates Proliferation, Invasion and Apoptosis in Esophageal Cancer Cells.
Ghaffar M, Khodahemmati S, Li J, Shahzad M, Wang M, Wang Y, Li C, Chen S, Zeng Y. Ghaffar M, et al. J Cancer. 2018 Oct 20;9(22):4242-4249. doi: 10.7150/jca.26095. eCollection 2018. J Cancer. 2018. PMID: 30519325 Free PMC article. - NKX2-1-AS1 negatively regulates CD274/PD-L1, cell-cell interaction genes, and limits human lung carcinoma cell migration.
Kathuria H, Millien G, McNally L, Gower AC, Tagne JB, Cao Y, Ramirez MI. Kathuria H, et al. Sci Rep. 2018 Sep 26;8(1):14418. doi: 10.1038/s41598-018-32793-5. Sci Rep. 2018. PMID: 30258080 Free PMC article. - Screening and clinical significance of tumor markers in head and neck squamous cell carcinoma through bioinformatics analysis.
Zhao L, Chi W, Cao H, Cui W, Meng W, Guo W, Wang B. Zhao L, et al. Mol Med Rep. 2019 Jan;19(1):143-154. doi: 10.3892/mmr.2018.9639. Epub 2018 Nov 9. Mol Med Rep. 2019. PMID: 30431092 Free PMC article.
References
- Prensner JR, Chinnaiyan AM. The emergence of lncRNAs in cancer biology. Cancer Discov. 2011;1:391–407. doi: 10.1158/2159-8290.CD-11-0209. - DOI - PMC - PubMed
- Derrien T, Johnson R, Bussotti G, Tanzer A, Djebali S, Tilgner H, Guernec G, Martin D, Merkel A, Knowles DG, Lagarde J, Veeravalli L, Ruan X, Ruan Y, Lassmann T, Carninci P, Brown JB, Lipovich L, Gonzalez JM, Thomas M, Davis CA, Shiekhattar R, Gingeras TR, Hubbard TJ, Notredame C, Harrow J, Guigó R. The GENCODE v7 catalog of human long noncoding RNAs: Analysis of their gene structure, evolution, and expression. Genome Res. 2012;22:1775–1789. doi: 10.1101/gr.132159.111. - DOI - PMC - PubMed
Publication types
MeSH terms
Substances
LinkOut - more resources
Full Text Sources
Other Literature Sources
Medical
