Autophagy in microglia degrades extracellular β-amyloid fibrils and regulates the NLRP3 inflammasome - PubMed (original) (raw)
. 2014 Oct 1;10(10):1761-75.
doi: 10.4161/auto.29647. Epub 2014 Jul 22.
Affiliations
- PMID: 25126727
- PMCID: PMC4198361
- DOI: 10.4161/auto.29647
Autophagy in microglia degrades extracellular β-amyloid fibrils and regulates the NLRP3 inflammasome
Mi-Hyang Cho et al. Autophagy. 2014.
Abstract
Accumulation of β-amyloid (Aβ) and resultant inflammation are critical pathological features of Alzheimer disease (AD). Microglia, a primary immune cell in brain, ingests and degrades extracellular Aβ fibrils via the lysosomal system. Autophagy is a catabolic process that degrades native cellular components, however, the role of autophagy in Aβ degradation by microglia and its effects on AD are unknown. Here we demonstrate a novel role for autophagy in the clearance of extracellular Aβ fibrils by microglia and in the regulation of the Aβ-induced NLRP3 (NLR family, pyrin domain containing 3) inflammasome using microglia specific atg7 knockout mice and cell cultures. We found in microglial cultures that Aβ interacts with MAP1LC3B-II via OPTN/optineurin and is degraded by an autophagic process mediated by the PRKAA1 pathway. We anticipate that enhancing microglial autophagy may be a promising new therapeutic strategy for AD.
Keywords: Alzheimer disease; NLRP3; autophagy; microglia; β-amyloid.
Figures
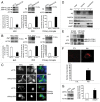
Figure 1. fAβ degradation depends on the fAβ-induced autophagic processes. (A) The BV2 microglial cell line and primary mouse microglia treated with FITC-labeled Aβ fibrils (1 μM) and then stained with MAP1LC3B (red). The representative images show that the number of MAP1LC3B dots is increased and colocalized with FITC-Aβ in FITC-Aβ-treated BV2 cells and primary microglia. Scale bar: 10 μm. (B) The BV2 microglial cell line and primary mouse microglia were treated with Aβ fibrils (1 μM) for 2 h. Whole cell lysates were collected at the indicated time points and analyzed by immunoblotting for ATG5–12, MAP1LC3B, and ACTB (loading control). The levels of the ATG12–ATG5 complex and MAP1LC3B-II were increased in the Aβ fibril-treated BV2 and primary microglia. (C) The BV2 microglia cell line was treated with 25 nM bafilomycin A1 for 30 min before 1 μM Aβ fibrils. After 2 h, whole cell lysates were collected and analyzed using immunoblotting for MAP1LC3B and ACTB (loading control). The level of the MAP1LC3B-II is increased in the Aβ fibril-treated BV2 cells and more in BV2 cells cotreated with Aβ and bafilomycin A1.
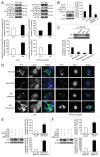
Figure 2. Interactions between Aβ, MAP1LC3B, and OPTN in microglia. (A and B) Western blots show that the levels of MAP1LC3B and ATG7 are decreased in the indicated siRNAs-transfected cells. Immunoblots of Aβ in BV2 and primary microglia transfected with the indicated siRNAs and treated with Aβ fibrils (1 μM) for 24 h show high levels of Aβ in si_Map1lc3b_- and si_Atg7_-transfected microglia compared with control (siCTL). The bar graphs show the densitometric quantification of the immunoblot bands. Each graph shows the band densities of the immunoreactive proteins as a percentage of CTL (100%). Data are presented as the means ± SEM of 3 independent experiments and were analyzed using the Student t test. *P < 0.05, **P < 0.01, ***P < 0.005 vs. control. (C) The BV2 microglial cell line and primary murine microglia were transfected with the si_Map1lc3b_ and treated with FITC-labeled Aβ fibrils (1 μM) for 24 h. The representative images show that FITC-Aβ was increased in the si_Map1lc3b_-transfected microglia. (D) After fractionation of BV2 cells into cytosol and membranous organelles, western blots show that Aβ is present not only in the cytosol but also in the membranous organelles. GAPDH is used as a marker for cytosol. EEA1 (early endosomal antigen 1), RAB7 and LAMP1 (lysosomal-associated membrane protein 1) were used as a marker for membranous organelles. (E) BV2 microglia were treated with Aβ fibrils (1 μM) for 2 h. Aβ fibril-treated and control cells were immunoprecipitated with the Aβ antibody (4G8), and, subsequently, coimmunoprecipitation with MAP1LC3B-II was assessed by western blot analysis with MAP1LC3B antibodies. MAP1LC3B-II was confirmed to coimmunoprecipitate with Aβ. (F) The interactions between Aβ and MAP1LC3B were visualized in Aβ fibril-treated cells by staining with the Duolink assay and proximity probes directed against Aβ (6E10) and MAP1LC3B, which was followed by ligation. The hybridization probes were labeled with Alexa 555 (red). Note that red puncta are apparent in fAβ-treated microglia, indicating interactions between Aβ and MAP1LC3B-II in the autophagic vacuoles. The bar graphs show the number of puncta per cells (n = 20). Scale bar: 10 μm. Data are presented as the means ± SEM of 3 independent experiments and were analyzed using the Student t test. ***P < 0.005 vs. control. (G) Western blots show that the level of OPTN is decreased in the si_Optn_-transfected cells. Immunoblots of Aβ in BV2 and primary microglia transfected with si_Optn_ and treated with Aβ fibrils (1 μM) for 24 h show high levels of Aβ in si_Optn_-transfected microglia compared with siCTL. The bar graphs show the densitometric quantification of the immunoblot bands. Each graph shows the band densities of the immunoreactive proteins as a percentage of CTL (100%). Data are presented as the means ± SEM of 3 independent experiments and were analyzed using the Student t test. **P < 0.01 vs. control.
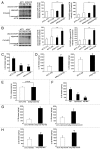
Figure 3. STK11-PRKAA1 activates autophagic degradation of Aβ fibrils by microglia. (A) The BV2 microglial cell line and primary mouse microglia were treated with Aβ fibrils (1 μM) for 2 h. Whole cell lysates were collected and analyzed by immunoblotting with indicated antibodies. The levels of p-STK11 and p-PRKAA1 (Thr172) were increased in fAβ-treated microglia. (B) The BV2 microglial cell line was transfected with the indicated siRNAs and Prkaa1 silent-mutant and treated with Aβ fibrils (1 μM) for 24 h. Immunoblots of 6E10 and ACTB in BV2 that were transfected with the indicated siRNAs and treated with Aβ fibrils (1 μM) for 24 h. High levels of Aβ were observed in si_Prkaa1_-transfected microglia compared with siCTL. (C) BV2 microglial cells were preincubated with AICAR, metformin, or compound C for 30 min before Aβ fibrils (1 μM) were added. Whole cell lysates were collected 24 h later, and then the lysates were analyzed by immunoblotting for 6E10 and ACTB (loading control). Lower levels of Aβ were observed in AICAR- and metformin-treated microglia, but higher levels of Aβ were observed in compound C-treated microglia. (D) The BV2 microglial cell line and primary mouse microglia were preincubated with AICAR, metformin, or compound C for 30 min before FITC-labeled Aβ fibrils (1 μM) were added. The cells were observed 24 h later. Representative images show that FITC-labeled Aβ was lower in AICAR- and metformin-treated microglia but higher in compound C-treated cells. Scale bar: 10 μm. (E and F) Immunoblots of primary microglia cell lysates demonstrating that the decrease in Aβ by AICAR or metformin was abolished in si_Map1lc3b_- and si_Atg7_ transfected microglia. The bar graphs show the densitometric quantification of the immunoblot bands. Each graph shows the band densities of the immunoreactive proteins as a percentage of the indicated group. Data are presented as the means ± SEM of 3 independent experiments and were analyzed using the Student t test. **P < 0.01, **P < 0.005 vs. control.
Figure 4. Increased inflammation following the disruption of microglial autophagy. (A and B) Primary mouse microglia were transfected with the indicated siRNAs and treated with Aβ fibrils (1 μM). Levels of cleaved CASP1 and PYCARD oligomerization were increased in microglia following the addition of fAβ; these levels were even higher following the knockdown of Map1lc3b and Atg7. The bar graphs show the densitometric quantification of the immunoblot bands. Each graph displays the band densities of the indicated immunoreactive protein as expressed as a percentage of the siCTL controls (100%). Data are presented as the means ± SEM of 3 independent experiments and were analyzed using the Student t test. ***P < 0.005 vs. control. (C–E) Primary mouse microglia were transfected with the indicated siRNAs and preactivated with LPS (1 ng/mL) for 3 h before the Aβ fibrils (1 μM) were added. The levels of IL1B and TNF were measured in the supernatant fractions of the microglia 24 h later using ELISA. (F–H) Primary mouse microglia were transfected with the indicated siRNAs and preactivated with LPS were treated with AICAR or metformin 30 min before the Aβ fibrils (1 μM) were added. The IL1B level was measured in the supernatants of the microglia 24 h later using ELISA. The decrease in IL1B by AICAR or metformin was not observed following the knockdown of Map1lc3b or Atg7. Data are presented as the means ± SEM of 3 independent experiments and were analyzed using the Student t test. **P < 0.01, ***P < 0.005 vs. control.
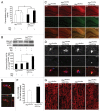
Figure 5. Aggravation of neuronal damage after the disruption of microglial autophagy. (A) Primary mouse microglia were transfected with the indicated siRNAs, preactivated with LPS, and treated with Aβ fibrils (1 μM) for 24 h. The conditioned media was transferred to the cortical neurons, and these neurons were stained with antibody specific to MAP2 (microtubule-associated protein 2). The representative images show that these neurons degenerated when fAβ-treated microglia media was used to treat these neurons; these effects were more pronounced following the knockdown of MAP1LC3B. (B) Bar graphs showing the dendrite lengths of the treated neurons (n = 100). Scale bar: 20 μm. Data are presented as the mean ± SEM of 3 independent experiments and were analyzed using the Student t test. **P < 0.01 vs. control.
Figure 6. Increased inflammation in the hippocampi of Aβ-injected _Atg7_flox/flox /_Lyz2_-Cre mice. (A) Brain extracts of stereotaxically injected Atg7flox/flox/_Lyz2_-Cre mice and Atg7flox/flox mice were diluted in PBS (1:40) and 1% BSA for examination of IL1B using ELISA. The bar graphs show the concentrations of IL1B. IL1B was increased by the greatest amount in fAβ-injected Atg7flox/flox/_Lyz2_-Cre mice. The data are presented as the mean ± SEM of 17 samples and were analyzed using the Student t test. ***P < 0.005 vs. fAβ-injected Atg7flox/flox mice. (B) Extracts were analyzed by immunoblotting for CASP1. The bar graphs show the densitometric quantification of the immunoblot bands. Each graph shows the band densities of the immunoreactive proteins as expressed as a percentage of the PBS-injected Atg7flox/flox mice (100%). The level of cleaved CASP1 was increased in fAβ-injected Atg7flox/flox/_Lyz2_-Cre mice. Data are shown as the mean ± SEM of 13 samples and were analyzed using the Student t test. ***P < 0.005. (C–E) Brain sections of stereotaxically injected Atg7flox/flox/_Lyz2_-Cre mice and Atg7flox/flox mice were double-immunostained with AIF1 (red) and 6E10 (green). Representative images showing that microglia in the hippocampi of fAβ-injected Atg7flox/flox/_Lyz2_-Cre and Atg7flox/flox mice are associated with Aβ. (F) Bar graphs showing the number of Aβ-positive microglia. A higher number of microglia, including those with Aβ, were observed in fAβ-injected Atg7flox/flox/_Lyz2_-Cre mice than fAβ-injected Atg7flox/flox mice. Data are shown as the mean ± SEM of 17 samples and were analyzed using the Student t test. **P < 0.01, ***P < 0.005 vs. fAβ-injected Atg7flox/flox mice. (G) Brain sections of stereotaxically injected Atg7flox/flox/_Lyz2_-Cre mice and Atg7flox/flox mice were immunostained with a MAP2 (microtubule-associated protein 2) antibody (red) to examine the dendritic damages. Shortening and fragmentation of dendrites are the most apparent in fAβ-injected Atg7flox/flox/_Lyz2_-Cre mice.
Figure 7. Increase of SQSTM1 and OPTN in AD brain. Representative images of immunoblots from 8 samples of AD temporal cortex and 7 age- and sex-matched control samples. SQSTM1 (sequestosome 1) and OPTN (optineurin) increased in AD brains compared with controls. **P < 0.01, ***P < 0.005 vs. control.
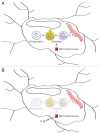
Figure 8. Role of microglial autophagy in Aβ degradation and NLRP3 inflammasome regulation. (A) Autophagy in microglia is involved in the degradation of extracellular Aβ fibrils and the regulation of Aβ-induced NLRP3 inflammasomes. (B) The impairment of autophagy in microglia results in increased inflammation and subsequent neuronal damage. The enhancement of autophagy by a PRKAA1 activator, such as metformin, may reduce Aβ burden and inflammation.
Similar articles
- Sulforaphane attenuates microglia-mediated neuronal damage by down-regulating the ROS/autophagy/NLRP3 signal axis in fibrillar Aβ-activated microglia.
Yang Y, Zhang J, Yang C, Dong B, Fu Y, Wang Y, Gong M, Liu T, Qiu P, Xie W, Lü T. Yang Y, et al. Brain Res. 2023 Feb 15;1801:148206. doi: 10.1016/j.brainres.2022.148206. Epub 2022 Dec 17. Brain Res. 2023. PMID: 36539049 - Co-Localization of Glia Maturation Factor with NLRP3 Inflammasome and Autophagosome Markers in Human Alzheimer's Disease Brain.
Ahmed ME, Iyer S, Thangavel R, Kempuraj D, Selvakumar GP, Raikwar SP, Zaheer S, Zaheer A. Ahmed ME, et al. J Alzheimers Dis. 2017;60(3):1143-1160. doi: 10.3233/JAD-170634. J Alzheimers Dis. 2017. PMID: 28984607 Free PMC article. - Lychee seed polyphenol inhibits Aβ-induced activation of NLRP3 inflammasome via the LRP1/AMPK mediated autophagy induction.
Qiu WQ, Pan R, Tang Y, Zhou XG, Wu JM, Yu L, Law BY, Ai W, Yu CL, Qin DL, Wu AG. Qiu WQ, et al. Biomed Pharmacother. 2020 Oct;130:110575. doi: 10.1016/j.biopha.2020.110575. Epub 2020 Aug 5. Biomed Pharmacother. 2020. PMID: 32768883 - Amyloid-beta oligomers set fire to inflammasomes and induce Alzheimer's pathology.
Salminen A, Ojala J, Suuronen T, Kaarniranta K, Kauppinen A. Salminen A, et al. J Cell Mol Med. 2008 Dec;12(6A):2255-62. doi: 10.1111/j.1582-4934.2008.00496.x. Epub 2008 Sep 13. J Cell Mol Med. 2008. PMID: 18793350 Free PMC article. Review. - TLR4 Cross-Talk With NLRP3 Inflammasome and Complement Signaling Pathways in Alzheimer's Disease.
Yang J, Wise L, Fukuchi KI. Yang J, et al. Front Immunol. 2020 Apr 23;11:724. doi: 10.3389/fimmu.2020.00724. eCollection 2020. Front Immunol. 2020. PMID: 32391019 Free PMC article. Review.
Cited by
- NLRP3 and autophagy in retinal ganglion cell inflammation in age-related macular degeneration: potential therapeutic implications.
Wang XL, Gao YX, Yuan QZ, Zhang M. Wang XL, et al. Int J Ophthalmol. 2024 Aug 18;17(8):1531-1544. doi: 10.18240/ijo.2024.08.20. eCollection 2024. Int J Ophthalmol. 2024. PMID: 39156786 Free PMC article. Review. - Icariin: A Potential Neuroprotective Agent in Alzheimer's Disease and Parkinson's Disease.
Khezri MR, Ghasemnejad-Berenji M. Khezri MR, et al. Neurochem Res. 2022 Oct;47(10):2954-2962. doi: 10.1007/s11064-022-03667-0. Epub 2022 Jul 8. Neurochem Res. 2022. PMID: 35802286 Review. - Interleukin-4 affects microglial autophagic flux.
Tang RH, Qi RQ, Liu HY. Tang RH, et al. Neural Regen Res. 2019 Sep;14(9):1594-1602. doi: 10.4103/1673-5374.255975. Neural Regen Res. 2019. PMID: 31089059 Free PMC article. - Spotlight on NLRP3 Inflammasome: Role in Pathogenesis and Therapies of Atherosclerosis.
Jiang C, Xie S, Yang G, Wang N. Jiang C, et al. J Inflamm Res. 2021 Dec 21;14:7143-7172. doi: 10.2147/JIR.S344730. eCollection 2021. J Inflamm Res. 2021. PMID: 34992411 Free PMC article. Review. - BH3-only proteins Puma and Beclin1 regulate autophagic death in neurons in response to Amyloid-β.
Saha A, Saleem S, Paidi RK, Biswas SC. Saha A, et al. Cell Death Discov. 2021 Nov 15;7(1):356. doi: 10.1038/s41420-021-00748-x. Cell Death Discov. 2021. PMID: 34782612 Free PMC article.
References
- Giménez-Xavier P, Francisco R, Platini F, Pérez R, Ambrosio S. LC3-I conversion to LC3-II does not necessarily result in complete autophagy. Int J Mol Med. 2008;22:781–5. - PubMed
Publication types
MeSH terms
Substances
LinkOut - more resources
Full Text Sources
Other Literature Sources
Molecular Biology Databases

