Metaplastic effects of subanesthetic ketamine on CA1 hippocampal function - PubMed (original) (raw)
Metaplastic effects of subanesthetic ketamine on CA1 hippocampal function
Yukitoshi Izumi et al. Neuropharmacology. 2014 Nov.
Abstract
Ketamine is a non-competitive N-methyl-d-aspartate receptor (NMDAR) antagonist of interest in neuropsychiatry. In the present studies, we examined the effects of subanesthetic, low micromolar ketamine on excitatory postsynaptic potentials (EPSPs), population spikes (PSs) and synaptic plasticity in the CA1 region of rat hippocampal slices. Ketamine acutely inhibited NMDAR-mediated synaptic responses with half-maximal effects near 10 μM. When administered for 15-30 min at 1-10 μM, ketamine had no effect on baseline dendritic AMPA receptor-mediated EPSPs, but persistently enhanced somatic EPSPs in the pyramidal cell body layer and augmented PS firing. Acute low micromolar ketamine also had no effect on the induction of long-term potentiation (LTP) but blocked long-term depression (LTD). Following 30 min administration of 1-10 μM ketamine, however, a slowly developing and persistent form of LTP inhibition was observed that took two hours following ketamine washout to become manifest. This LTP inhibition did not result from prolonged or enhanced NMDAR inhibition during drug washout. Effects of low ketamine on somatic EPSPs and LTP were not mimicked by a high ketamine concentration that completely inhibited NMDARs, and both of these effects were blocked by co-administration of low ketamine with a low concentration of the competitive NMDAR antagonist, 2-amino-5-phosphonovalerate or inhibitors of nitric oxide synthase. These results indicate that concentrations of ketamine relevant to psychotropic and psychotomimetic effects have complex metaplastic effects on hippocampal function that involve activation of unblocked NMDARs during ketamine exposure.
Keywords: Memory; Modulation; NMDA receptor; Nitric oxide; Psychosis; Synaptic plasticity.
Copyright © 2014 Elsevier Ltd. All rights reserved.
Figures
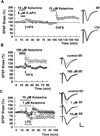
Figure 1
Effects of ketamine on NMDAR EPSPs. A. In the presence of CNQX and low Mg2+ ketamine inhibited isolated NMDAR EPSPs in a concentration dependent manner with an EC50 near 10 µM (N = 5 each). B. At 10 µM, ketamine (white bar) depressed NMDAR EPSPs by about 50%. Application of 5 µM D-APV (black bar), a concentration that also inhibits CA1 NMDAR EPSPs by about 50%, caused nearly complete, reversible depression in the presence of ketamine. Application of 10 µM ifenprodil (gray bar), however, did not further depress NMDAR EPSPs in the presence of ketamine (N = 5). Traces show representative waveforms at designated times with the initial control traces as thin lines. Calibration: 1 mV, 5 msec.
Figure 2
Acute effects of ketamine on LTP and LTD. A. HFS (100 Hz, 1s; arrows) failed to induce LTP in the presence of 10 µM ketamine (white bar) plus 5 µM D-APV (black bar), but readily induced LTP in the presence of 10 µM ketamine alone. B. HFS (arrow) induced LTP in control slices (white squares) but not in the presence of 100 µM ketamine (black circles). C. In contrast to LTP, LFS (1 Hz, 900s; hatched bar) failed to induce LTD in the presence of 1 µM (open circles) or 10 µM ketamine (gray circles). Control LTD is shown in white squares. Traces show representative waveforms at designated times with the initial control traces as thin lines. Calibration: 1 mV, 5 msec.
Figure 3
Effects of 1 µM ketamine on dendritic EPSPs, somatic EPSPs and LTP after drug washout. A. LTP of dendritic EPSPs (circles) was induced when HFS (100 Hz, 1s; arrow) was delivered 1 hour after washout of 1 µM ketamine, which was administered for 30 min (white bar) in the absence of stimulation. Somatic EPSPs (squares) were augmented without effect on dendritic EPSPs after washout of ketamine, and also exhibited LTP following HFS. B. The enhancement of somatic EPSPs (squares) persisted for at least 2 hours after washout of 1 µM ketamine. However, HFS delivered 2 hours after ketamine washout failed to induce LTP of either dendritic or somatic EPSPs. Traces show representative waveforms at designated times with the initial control traces as thin lines. Calibration: 1 mV, 5 msec.
Figure 4
NMDAR EPSPs are not eliminated in slices pretreated with low ketamine. In the presence of CNQX and low Mg2+ NMDAR EPSPs were reliably recorded in ketamine pretreated slices (N=5). For these studies, slices were pretreated with 10 µM ketamine for 30 min and ketamine was washed out for 2 hours prior to recording. In these slices, administration of 10 µM ifenprodil (gray bar) partially depressed NMDAR EPSPs and addition of 5 µM D-APV (black bar) almost completely depressed NMDAR EPSPs in a reversible manner. Traces show representative waveforms at designated times with the initial control traces as thin lines. Calibration: 1 mV, 5 msec.
Figure 5
Effects of pretreatment with low ketamine plus APV on synaptic responses and LTP. A. Unlike low ketamine alone, administration of 10 µM ketamine plus 5 µM D-APV for 30 min had no acute effect on either dendritic (circles) or somatic (squares) EPSPs. Traces show representative EPSPs and PSs recorded before (thin lines) and 60 min after (thick lines) drug washout. B. In slices pretreated with 10 µM ketamine plus 5 µM D-APV for 30 min followed by 2–4 hour drug washout, a single HFS (arrow) successfully induced LTP. Traces depict representative waveforms during the baseline period (thin) and 60 min following HFS (thick). Calibration: 1 mV, 5 msec.
Figure 6
A high concentration of ketamine does not reproduce the effects of low ketamine on EPSPs or LTP. A. Administration of 100 µM ketamine in the absence of synaptic stimulation for 30 min did not alter dendritic (circles) or somatic EPSPs (squares). HFS (100 Hz, 1s; arrow) delivered 75 min after washout of 100 µM ketamine induced LTP. B. HFS also induced LTP in slices pretreated with 100 µM ketamine × 30 min (circles) administered 2–4 hours before experiments. Traces show representative waveforms at designated times with the initial control traces as thin lines. Calibration: 1 mV, 5 msec.
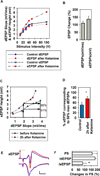
Figure 7
Low ketamine alters the dendritic-somatic EPSP relationship in the CA1 area. To determine changes in the relationship between dendritic (dEPSPs) and somatic EPSPs (sEPSPs), we analyzed input-output (IO) curves to find somatic EPSP changes at 50% maximal dendritic EPSPs (N = 6 slices). A. Representative IO curves of dendritic field EPSP slope (mV/ms, circles) and somatic EPSP height (mV, squares) elicited by 6 different stimuli before (blue) and 2 hours after 30 min administration of 1 µM ketamine (red). B. A summary of changes in dendritic EPSP slope and somatic EPSP height after ketamine administration compared to baseline at the 50% maximal point on the IO curves. C. From the IO curves for dendritic EPSP slope and somatic EPSP height (A), the somatic EPSP height induced by a half maximal dendritic EPSP stimulus was determined. The upward arrows show the somatic EPSP height corresponding to the dendritic EPSPs at the original half maximal stimulus. In this case, the original somatic EPSP corresponding to the half maximal dendritic EPSP was 51% maximal; this value was increased to 85% maximal after ketamine. D. A summary of changes in somatic EPSP height after ketamine administration based on analyses shown in C. * P < 0.05 by paired t-test. E. Representative EPSPs and PSs obtained from the same slice shown in A and C before (blue) and 2 hours after ketamine (red). In this case, in spite of a subtle decrease in dendritic EPSPs after ketamine, somatic EPSPs and PSs were augmented. The arrow depicts the height of somatic EPSP after ketamine. Calibration: 1 mV, 5 msec. F. The graph shows changes in 50% maximal PS amplitudes following ketamine uncorrected for changes in EPSPs (top bar) and corrected for changes dendritic (d) EPSP slopes (middle bar) and somatic (s) EPSP heights (bottom); *P < 0.05 by paired t-test.
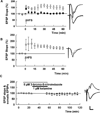
Figure 8
An HCN blocker does not mimic ketamine’s effects on dendritic and somatic EPSPs. A. Administration of 20 µM ZD7288 slightly enhanced dendritic EPSPs (circles) but depressed somatic EPSPs (squares) (N=5). B. Similarly, administration of 50 µM ZD7288 depressed somatic EPSPs (squares). Dendritic EPSPs were not significantly enhanced. Traces show representative waveforms 60 min after washout of ZD 7288 with the initial control traces as thin lines. Calibration: 1 mV, 5 msec.
Figure 9
Nitric oxide synthase (NOS) inhibitors overcome the effects of low ketamine on LTP and somatic EPSPs. A. Co-administration of 100 µM L-NMMA, a broad-spectrum and competitive NOS inhibitor, with 1 µM ketamine for 30 min followed by 2–4 hour drug washout overcame the inhibitory effects of ketamine on LTP (white circles). A single 100 Hz × 1 s HFS was administered at the arrow. The effects of L-NMMA were reversed by 1 mM L-arginine, the natural substrate for NOS (black circles). B. Pre-incubation of slices in 1 µM ketamine plus 5 µM 3-bromo-7-nitroindazole, a potent neuronal NOS inhibitor, ketamine on LTP. C. 3-Bromo-7-nitroindazole (5 µM) also blocked the acute effects of ketamine of somatic EPSPs (gray squares), and had no effect on dendritic EPSPs (white squares). Traces depict representative EPSPs with baseline traces shown as thin lines. Calibration: 1 mV, 5 msec.
Similar articles
- Sensitivity of N-methyl-D-aspartate receptor-mediated excitatory postsynaptic potentials and synaptic plasticity to TCN 201 and TCN 213 in rat hippocampal slices.
Izumi Y, Zorumski CF. Izumi Y, et al. J Pharmacol Exp Ther. 2015 Feb;352(2):267-73. doi: 10.1124/jpet.114.220582. Epub 2014 Nov 20. J Pharmacol Exp Ther. 2015. PMID: 25413830 Free PMC article. - C-type natriuretic peptide modulates bidirectional plasticity in hippocampal area CA1 in vitro.
Decker JM, Wójtowicz AM, Bartsch JC, Liotta A, Braunewell KH, Heinemann U, Behrens CJ. Decker JM, et al. Neuroscience. 2010 Aug 11;169(1):8-22. doi: 10.1016/j.neuroscience.2010.04.064. Epub 2010 May 8. Neuroscience. 2010. PMID: 20438814 - Group I mGluR Induced LTD of NMDAR-synaptic Transmission at the Schaffer Collateral but not Temperoammonic Input to CA1.
Fitzjohn S, Bashir Z, Farrow P. Fitzjohn S, et al. Curr Neuropharmacol. 2016;14(5):435-40. doi: 10.2174/1570159x13666150615221502. Curr Neuropharmacol. 2016. PMID: 27296639 Free PMC article. Review. - Hippocampal long-term synaptic plasticity and signal amplification of NMDA receptors.
MacDonald JF, Jackson MF, Beazely MA. MacDonald JF, et al. Crit Rev Neurobiol. 2006;18(1-2):71-84. doi: 10.1615/critrevneurobiol.v18.i1-2.80. Crit Rev Neurobiol. 2006. PMID: 17725510 Review.
Cited by
- Ketamine and Ketamine Metabolite Pharmacology: Insights into Therapeutic Mechanisms.
Zanos P, Moaddel R, Morris PJ, Riggs LM, Highland JN, Georgiou P, Pereira EFR, Albuquerque EX, Thomas CJ, Zarate CA Jr, Gould TD. Zanos P, et al. Pharmacol Rev. 2018 Jul;70(3):621-660. doi: 10.1124/pr.117.015198. Pharmacol Rev. 2018. PMID: 29945898 Free PMC article. Review. - How does ketamine elicit a rapid antidepressant response?
Kavalali ET, Monteggia LM. Kavalali ET, et al. Curr Opin Pharmacol. 2015 Feb;20:35-9. doi: 10.1016/j.coph.2014.11.005. Epub 2014 Nov 25. Curr Opin Pharmacol. 2015. PMID: 25462290 Free PMC article. Review. - Neonatal exposure of ketamine inhibited the induction of hippocampal long-term potentiation without impairing the spatial memory of adult rats.
Guo D, Gan J, Tan T, Tian X, Wang G, Ng KT. Guo D, et al. Cogn Neurodyn. 2018 Aug;12(4):377-383. doi: 10.1007/s11571-018-9474-4. Epub 2018 Feb 22. Cogn Neurodyn. 2018. PMID: 30137874 Free PMC article. - Variations in BDNF and Their Role in the Neurotrophic Antidepressant Mechanisms of Ketamine and Esketamine: A Review.
Pardossi S, Fagiolini A, Cuomo A. Pardossi S, et al. Int J Mol Sci. 2024 Dec 5;25(23):13098. doi: 10.3390/ijms252313098. Int J Mol Sci. 2024. PMID: 39684808 Free PMC article. Review. - 24(S)-Hydroxycholesterol as a Modulator of Neuronal Signaling and Survival.
Sun MY, Linsenbardt AJ, Emnett CM, Eisenman LN, Izumi Y, Zorumski CF, Mennerick S. Sun MY, et al. Neuroscientist. 2016 Apr;22(2):132-44. doi: 10.1177/1073858414568122. Epub 2015 Jan 27. Neuroscientist. 2016. PMID: 25628343 Free PMC article. Review.
References
- Abraham WC. Metaplasticity: tuning synapses and networks for plasticity. Nature Rev. Neurosci. 2008;9:387–399. - PubMed
- Bartlett TE, Bannister NJ, Collett VJ, Dargan SL, Massey PV, Bortolotto ZA, Fitzjohn SM, Bashir ZI, Collingridge GL, Lodge D. Differential roles of NR2A and NR2B–containing NMDA receptors in LTP and LTD in the CA1 region of two-week old rat hippocampus. Neuropharmacol. 2007;52:60–70. - PubMed
Publication types
MeSH terms
Substances
LinkOut - more resources
Full Text Sources
Other Literature Sources
Miscellaneous


