A screen in mice uncovers repression of lipoprotein lipase by microRNA-29a as a mechanism for lipid distribution away from the liver - PubMed (original) (raw)
doi: 10.1002/hep.27379. Epub 2014 Nov 24.
Guisheng Song, Kelly Hitchner, Roy Y Kim, Andrew Y Lee, Amar D Sharma, Yann Malato, Michael T McManus, Christine C Esau, Erich Koller, Suneil Koliwad, Lee P Lim, Jacquelyn J Maher, Robert L Raffai, Holger Willenbring
Affiliations
- PMID: 25131933
- PMCID: PMC4465779
- DOI: 10.1002/hep.27379
A screen in mice uncovers repression of lipoprotein lipase by microRNA-29a as a mechanism for lipid distribution away from the liver
Aras N Mattis et al. Hepatology. 2015 Jan.
Abstract
Identification of microRNAs (miRNAs) that regulate lipid metabolism is important to advance the understanding and treatment of some of the most common human diseases. In the liver, a few key miRNAs have been reported that regulate lipid metabolism, but since many genes contribute to hepatic lipid metabolism, we hypothesized that other such miRNAs exist. To identify genes repressed by miRNAs in mature hepatocytes in vivo, we injected adult mice carrying floxed Dicer1 alleles with an adenoassociated viral vector expressing Cre recombinase specifically in hepatocytes. By inactivating Dicer in adult quiescent hepatocytes we avoided the hepatocyte injury and regeneration observed in previous mouse models of global miRNA deficiency in hepatocytes. Next, we combined gene and miRNA expression profiling to identify candidate gene/miRNA interactions involved in hepatic lipid metabolism and validated their function in vivo using antisense oligonucleotides. A candidate gene that emerged from our screen was lipoprotein lipase (Lpl), which encodes an enzyme that facilitates cellular uptake of lipids from the circulation. Unlike in energy-dependent cells like myocytes, LPL is normally repressed in adult hepatocytes. We identified miR-29a as the miRNA responsible for repressing LPL in hepatocytes, and found that decreasing hepatic miR-29a levels causes lipids to accumulate in mouse livers.
Conclusion: Our screen suggests several new miRNAs are regulators of hepatic lipid metabolism. We show that one of these, miR-29a, contributes to physiological lipid distribution away from the liver and protects hepatocytes from steatosis. Our results, together with miR-29a's known antifibrotic effect, suggest miR-29a is a therapeutic target in fatty liver disease.
© 2014 by the American Association for the Study of Liver Diseases.
Conflict of interest statement
Conflicts of Interest
Authors have nothing to disclose.
Figures
Fig. 1
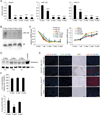
AAV8-Ttr-Cre-injected Dicer1fl/fl mice allow bias-free analysis of the effects of global miRNA deficiency in adult hepatocytes. (A) qRT-PCR shows loss of Dicer1 expression in livers of Dicer1fl/fl mice beginning 1 week (wk) after injection of AAV8-Ttr-Cre. qPCR shows that miR-122 and miR-21 are efficiently suppressed by 2 weeks after Dicer1 inactivation (n = 3 per time point). (B) Northern blot confirms absence of miR-122 in livers of 3 Dicer1fl/fl mice injected with AAV8-Ttr-Cre 4 weeks earlier. U6 levels show equal loading. (C) qPCR shows that miRNAs expressed in the liver at lower levels than miR-122 are also stably suppressed in Dicer1fl/fl mice injected with AAV8-Ttr-Cre (P values for all data points are at least < 0.05). qRT-PCR shows that miR-122 target genes are maximally and stably derepressed by 2 weeks after _Dicer1_ inactivation (_P_ values for all data points are at least < 0.005, except _P_ > 0.05 at 1 week after AAV8-Ttr-Cre injection, n = 3 per time point). (D) Immunoblotting shows increased levels of Aldolase A in Dicer1fl/fl mice 2 and 4 weeks after AAV8-Ttr-Cre injection. Results for 2 representative mice are shown for each time point. Gastrocnemius muscle from a wildtype mouse was used as a positive control. Fold increases relative to non-injected littermates (0 wks) are given. Actin was analyzed as a loading control. (E) Livers of 3-week-old Dicer1fl/fl, Alb-Cre+/− mice show hepatocyte DNA damage (γH2AX immunostaining) and death (TUNEL). Clonal expansion of proliferating hepatocytes (Ki67 immunostaining) capable of normal miRNA expression (miR-122 in situ hybridization) leads to high-level liver repopulation in 8-week-old Dicer1fl/fl, Alb-Cre+/− mice. Livers of adult Dicer1fl/fl mice injected with AAV8-Ttr-Cre 4 weeks earlier show no hepatocyte DNA damage or death, or repopulation with miR-122-expressing hepatocytes. For each analysis, representative stainings of at least 5 sections from 3 mice are shown. Size bars = 100 µm. (F) Thiobarbituric acid-reactive substances (TBARS) assay shows absence of lipid peroxidation in AAV8-Ttr-Cre-injected Dicer1fl/fl mice (n = 3 per time point). Levels of 8-oxo-dG are normal in livers of AAV8-Ttr-Cre-injected Dicer1fl/fl mice (n = 3 per time point). Error bars represent mean ± SD. ***P < 0.005 relative to 0 wks.
Fig. 2
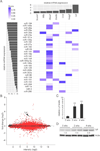
MiRNAs with potential as regulators of lipid metabolism in hepatocytes. (A) Identification of miRNAs with high probability of playing a significant role in hepatic lipid metabolism. The x-axis (top) shows level of induction in livers of AAV8-Ttr-Cre-injected Dicer1fl/fl mice of lipid metabolism genes that have miRNA target sites. Results are based on global gene expression profiling of livers of Dicer1fl/fl mice 2 and 4 weeks after AAV8-Ttr-Cre injection (n = 2 per time point) as compared to non-injected Dicer1fl/fl littermate controls (n = 3). The y-axis (left) shows the miRNAs predicted to target these genes ranked by expression level in wildtype mouse liver (23). TargetScan 6.2 was used to predict probability of targeting (Score). MiRNA families consisting of several paralogs are represented by “a” paralogs. MiR-33, which is known to target Abca1 (8), was not analyzed in that study (23). (B) MA plot of global gene expression profiling of livers of Dicer1fl/fl mice after AAV8-Ttr-Cre injection. Change in gene expression is indicated on the y-axis. Intensity is shown on the x-axis. Dots representing probes with P < 0.05 comparing the 4 AAV8-Ttr-Cre-injected Dicer1fl/fl mice and 3 control mice are red, others are black. Lpl is indicated by an arrowhead. (C) qRT-PCR shows increased Lpl mRNA levels in livers of Dicer1fl/fl mice 2 and 4 weeks after AAV8-Ttr-Cre injection (n = 3 per time point). (D) Immunoblotting shows increased Lpl protein levels in livers of Dicer1fl/fl mice 2 and 4 weeks after AAV8-Ttr-Cre injection. Fold increases relative to non-injected littermates (0 wks) are given. Results for 2 representative mice are shown for each time point. Actin was analyzed as a loading control. Error bars represent mean ± SD. **P < 0.01 relative to 0 wks.
Fig. 3
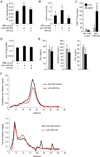
MiR-29a inhibits Lpl expression in the liver. (A) qPCR shows miR-29a inhibition in livers of mice injected with anti-miR-29a (n = 3) as compared to mice injected with anti-miR-control (n = 3) for 3 weeks. (B) qPCR shows miR-24 inhibition in livers of mice injected with anti-miR-24 (n = 3) as compared to mice injected with anti-miR-control (n = 3) for 3 weeks. (C) qRT-PCR shows derepressed miR-29a target gene levels in livers of mice injected with anti-miR-29a (black, n = 3) as compared to mice injected with anti-miR-control (grey, n = 3) for 3 weeks. (D) qRT-PCR shows derepressed miR-24 target gene levels in livers of mice injected with anti-miR-24 (black, n = 3) as compared to mice injected with anti-miR-control (grey, n = 3) for 3 weeks. (E) qRT-PCR shows increased Lpl mRNA levels in livers of mice injected with anti-miR-29a (n = 3) as compared to mice injected with anti-miR-24 (n = 3), anti-miR-control (n = 3), or PBS (n = 3) for 3 weeks. (F) qRT-PCR and qPCR show that Lpl mRNA levels decrease and miR-29a levels increase during postnatal completion of mouse liver development (1 wk, n = 6; 4 wks, n = 4; 17 wks, n = 3). Error bars represent mean ± SD. *P < 0.05, **P < 0.01, and ***P < 0.005 relative to anti-miR-control (A-E), or 1-week-old (Lpl) or 17-week-old (miR-29a) mice (F).
Fig. 4
MiR-29a regulates liver and plasma lipids by repressing Lpl. (A) TLC shows increased TG levels in mouse livers 6 days after a single injection of anti-miR-29a (n = 3) as compared to control mice injected with PBS (n = 3). Additional injection of anti-Lpl (n = 3) prevents TG accumulation. (B) qRT-PCR shows that the increase in Lpl mRNA levels in mouse livers 6 days after injection of anti-miR-29a (n = 3) is prevented by additional injection of anti-Lpl (n = 3). Mice injected with PBS were used as controls (n = 3). (C) Counts per minute (CPM) measurement 6 hours after intragastric gavage of 14C-Triolein shows increased levels of 14C-label in livers of mice injected with anti-miR-29a (n = 4) as compared to mice injected with anti-miR-control (n = 3) 6 days earlier. 14C-Triolein uptake into eWAT is not substantially increased in anti-miR-29a-injected mice. (D) Free cholesterol (FC) levels in livers of mice injected with anti-miR-29a (n = 3) as compared to control mice injected with PBS (n = 3) 6 days earlier. Additional injection of anti-Lpl (n = 3) slightly reduces FC levels in the liver. (E) Plasma lipid profile of mice 6 days after injection of anti-miR-29a (black, n = 5) or anti-miR-control (grey, n = 5). (F) Fractionation of plasma by FPLC shows decreased LDL (fractions 10–14) and HDL (fractions 15–20) cholesterol and slightly decreased VLDL (fractions 3–6) and increased IDL and LDL (fractions 7–12) TGs in plasma of mice injected with anti-miR-29a (n = 5, pooled) as compared to mice injected with anti-miR-control (n = 5, pooled) for 3 weeks. Error bars represent mean ± SD. *P < 0.05 and **P < 0.01 relative to anti-miR-control or PBS-control.
Fig. 5
MiR-29a inhibits lipid uptake into livers of mice fed HFD. (A) qRT-PCR shows increased Lpl mRNA levels in livers of HFD-fed mice injected with anti-miR-29a as compared to HFD-fed mice injected with anti-miR-control for 3 weeks (n = ≥ 4 per group). (B) Quantification of immunoblotting shows increased Lpl protein levels in livers of HFD-fed mice injected with anti-miR-29a as compared to HFD-fed mice injected with anti-miR-control for 3 weeks. Gapdh was analyzed as a loading control (n = 5 per group). (C) ORO staining shows pericentral lipid deposition in livers of HFD-fed mice injected with anti-miR-control for 3 weeks. In livers of HFD-fed mice injected with anti-miR-29a staining intensity is increased and lipid deposition is detected in both pericentral and periportal areas. For each group, representative stainings of 5 mice are shown. Size bars = 500 µm (top images) and 20 µm (bottom images). (D and E) TLC shows increased levels of TGs (D) and FC (E) in livers of HFD-fed mice injected with anti-miR-29a as compared to mice injected with anti-miR-control for 3 weeks (n = 5 per group). Error bars represent mean ± SD. *P < 0.05 relative to anti-miR-control.
Similar articles
- Inhibition of microRNA-24 expression in liver prevents hepatic lipid accumulation and hyperlipidemia.
Ng R, Wu H, Xiao H, Chen X, Willenbring H, Steer CJ, Song G. Ng R, et al. Hepatology. 2014 Aug;60(2):554-64. doi: 10.1002/hep.27153. Epub 2014 May 19. Hepatology. 2014. PMID: 24677249 Free PMC article. - High fat diet induced downregulation of microRNA-467b increased lipoprotein lipase in hepatic steatosis.
Ahn J, Lee H, Chung CH, Ha T. Ahn J, et al. Biochem Biophys Res Commun. 2011 Nov 4;414(4):664-9. doi: 10.1016/j.bbrc.2011.09.120. Epub 2011 Oct 1. Biochem Biophys Res Commun. 2011. PMID: 21986524 - Compounds that modulate AMPK activity and hepatic steatosis impact the biosynthesis of microRNAs required to maintain lipid homeostasis in hepatocytes.
Latorre J, Ortega FJ, Liñares-Pose L, Moreno-Navarrete JM, Lluch A, Comas F, Oliveras-Cañellas N, Ricart W, Höring M, Zhou Y, Liebisch G, Nidhina Haridas PA, Olkkonen VM, López M, Fernández-Real JM. Latorre J, et al. EBioMedicine. 2020 Mar;53:102697. doi: 10.1016/j.ebiom.2020.102697. Epub 2020 Mar 3. EBioMedicine. 2020. PMID: 32143184 Free PMC article. - MicroRNAs as regulators, biomarkers and therapeutic targets in liver diseases.
Wang X, He Y, Mackowiak B, Gao B. Wang X, et al. Gut. 2021 Apr;70(4):784-795. doi: 10.1136/gutjnl-2020-322526. Epub 2020 Oct 30. Gut. 2021. PMID: 33127832 Review. - Integrative roles of microRNAs in lipid metabolism and dyslipidemia.
Sedgeman LR, Michell DL, Vickers KC. Sedgeman LR, et al. Curr Opin Lipidol. 2019 Jun;30(3):165-171. doi: 10.1097/MOL.0000000000000603. Curr Opin Lipidol. 2019. PMID: 30985366 Free PMC article. Review.
Cited by
- Profile analysis and functional modeling identify circular RNAs in nonalcoholic fatty liver disease as regulators of hepatic lipid metabolism.
Xie Y, Cao Y, Guo CJ, Guo XY, He YF, Xu QY, Shen F, Pan Q. Xie Y, et al. Front Genet. 2022 Sep 15;13:884037. doi: 10.3389/fgene.2022.884037. eCollection 2022. Front Genet. 2022. PMID: 36186461 Free PMC article. - Dysregulated fatty acid metabolism in hepatocellular carcinoma.
Wang M, Han J, Xing H, Zhang H, Li Z, Liang L, Li C, Dai S, Wu M, Shen F, Yang T. Wang M, et al. Hepat Oncol. 2016 Oct;3(4):241-251. doi: 10.2217/hep-2016-0012. Epub 2017 Jun 30. Hepat Oncol. 2016. PMID: 30191046 Free PMC article. Review. - miRNAs in non-alcoholic fatty liver disease.
He Z, Hu C, Jia W. He Z, et al. Front Med. 2016 Dec;10(4):389-396. doi: 10.1007/s11684-016-0468-5. Epub 2016 Dec 23. Front Med. 2016. PMID: 27680976 Review. - Noncoding RNAs as additional mediators of epigenetic regulation in nonalcoholic fatty liver disease.
Zaiou M. Zaiou M. World J Gastroenterol. 2022 Sep 21;28(35):5111-5128. doi: 10.3748/wjg.v28.i35.5111. World J Gastroenterol. 2022. PMID: 36188722 Free PMC article. Review. - The Predictive Value of miR-16, -29a and -134 for Early Identification of Gestational Diabetes: A Nested Analysis of the DALI Cohort.
Sørensen AE, van Poppel MNM, Desoye G, Damm P, Simmons D, Jensen DM, Dalgaard LT; The DALI Core Investigator Group. Sørensen AE, et al. Cells. 2021 Jan 15;10(1):170. doi: 10.3390/cells10010170. Cells. 2021. PMID: 33467738 Free PMC article.
References
- Sacco J, Adeli K. MicroRNAs: emerging roles in lipid and lipoprotein metabolism. Curr Opin Lipidol. 2012;23:220–225. - PubMed
- Lagos-Quintana M, Rauhut R, Yalcin A, Meyer J, Lendeckel W, Tuschl T. Identification of tissue-specific microRNAs from mouse. Curr Biol. 2002;12:735–739. - PubMed
- Krutzfeldt J, Rajewsky N, Braich R, Rajeev KG, Tuschl T, Manoharan M, Stoffel M. Silencing of microRNAs in vivo with 'antagomirs'. Nature. 2005;438:685–689. - PubMed
- Esau C, Davis S, Murray SF, Yu XX, Pandey SK, Pear M, Watts L, et al. miR-122 regulation of lipid metabolism revealed by in vivo antisense targeting. Cell Metab. 2006;3:87–98. - PubMed
Publication types
MeSH terms
Substances
Grants and funding
- P30 DK063720/DK/NIDDK NIH HHS/United States
- P30 DK026743/DK/NIDDK NIH HHS/United States
- P30 DK26743/DK/NIDDK NIH HHS/United States
- DK063720/DK/NIDDK NIH HHS/United States
- R01 GM080783/GM/NIGMS NIH HHS/United States
- L30 DK089949/DK/NIDDK NIH HHS/United States
- I01 BX000532/BX/BLRD VA/United States
- R01 DK068450/DK/NIDDK NIH HHS/United States
- R01 HL089871/HL/NHLBI NIH HHS/United States
- K08 DK098270/DK/NIDDK NIH HHS/United States
LinkOut - more resources
Full Text Sources
Other Literature Sources
Molecular Biology Databases


