Genomes in turmoil: quantification of genome dynamics in prokaryote supergenomes - PubMed (original) (raw)
Genomes in turmoil: quantification of genome dynamics in prokaryote supergenomes
Pere Puigbò et al. BMC Biol. 2014.
Abstract
Background: Genomes of bacteria and archaea (collectively, prokaryotes) appear to exist in incessant flux, expanding via horizontal gene transfer and gene duplication, and contracting via gene loss. However, the actual rates of genome dynamics and relative contributions of different types of event across the diversity of prokaryotes are largely unknown, as are the sizes of microbial supergenomes, i.e. pools of genes that are accessible to the given microbial species.
Results: We performed a comprehensive analysis of the genome dynamics in 35 groups (34 bacterial and one archaeal) of closely related microbial genomes using a phylogenetic birth-and-death maximum likelihood model to quantify the rates of gene family gain and loss, as well as expansion and reduction. The results show that loss of gene families dominates the evolution of prokaryotes, occurring at approximately three times the rate of gain. The rates of gene family expansion and reduction are typically seven and twenty times less than the gain and loss rates, respectively. Thus, the prevailing mode of evolution in bacteria and archaea is genome contraction, which is partially compensated by the gain of new gene families via horizontal gene transfer. However, the rates of gene family gain, loss, expansion and reduction vary within wide ranges, with the most stable genomes showing rates about 25 times lower than the most dynamic genomes. For many groups, the supergenome estimated from the fraction of repetitive gene family gains includes about tenfold more gene families than the typical genome in the group although some groups appear to have vast, 'open' supergenomes.
Conclusions: Reconstruction of evolution for groups of closely related bacteria and archaea reveals an extremely rapid and highly variable flux of genes in evolving microbial genomes, demonstrates that extensive gene loss and horizontal gene transfer leading to innovation are the two dominant evolutionary processes, and yields robust estimates of the supergenome size.
Figures
Figure 1
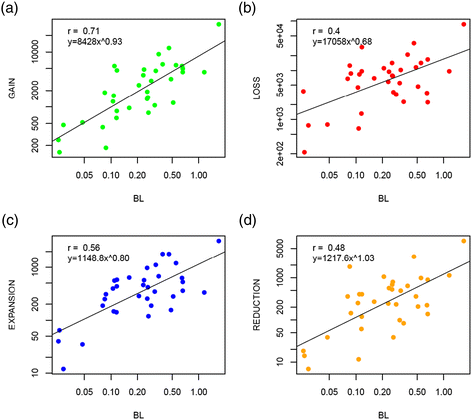
The clock of genome dynamics. The figure shows the correlation of branch lengths and number of (a) gains, (b) losses, (c) expansions and (d) reductions. It excludes singletons, i.e., gains in the terminal branches of the tree. Both x and y axes are have a logarithmic scale. All P < 0.0001. BL, branch length or number of nucleotide substitutions per site.
Figure 2
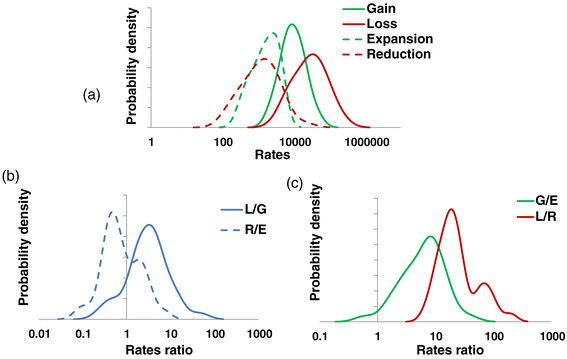
Distributions of the genome dynamics rates across the ATGCs. (a) Rates of gain, loss, expansion and reduction per nucleotide substitution per site. (b) Loss/gain and reduction/expansion ratios. (c) Gain/expansion and loss/reduction ratios. G/E, gain/expansion; L/G, loss/gain; L/R, loss/reduction; R/E, reduction/expansion.
Figure 3
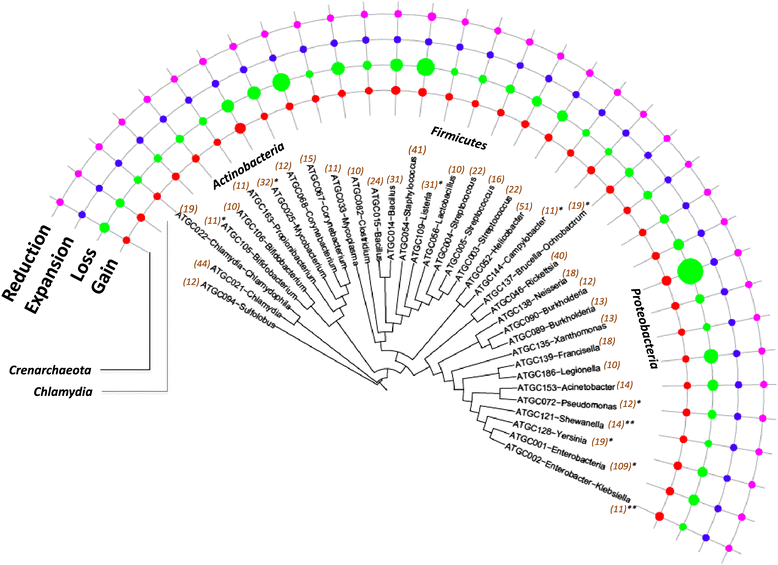
Distribution of the gain, loss, expansion and reduction rates over the evolutionary tree of prokaryotes. The tree is from MicrobesOnline [62]. The areas of the circles are proportional to the rates of the respective events to a logarithmic scale. The numbers in parenthesis indicate the number of species in the ATGC. The ATGCs with episodes of rapid gene gain are denoted with *(<10% of branches) or **(>10% of branches). ATGC, alignable tight genome cluster.
Figure 4
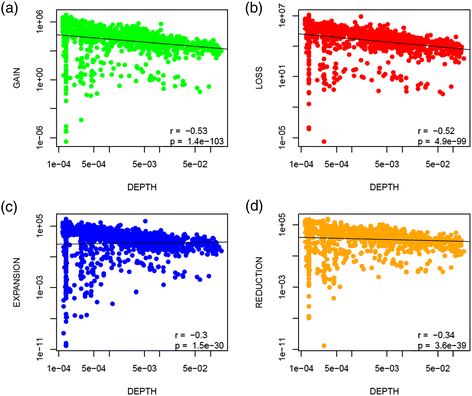
Dependence of the rates of gains, losses, expansion and reductions on phylogenetic depth. (a) Gains, (b) losses, (c) expansions and (d) reductions per unit of branch length vs the phylogenetic depth. The figure excludes singletons, i.e., gains in the terminal branches of the tree are not represented. Both x and y axes have a logarithmic scale. The phylogenetic depth is measured in the number of nucleotide substitutions per site.
Figure 5
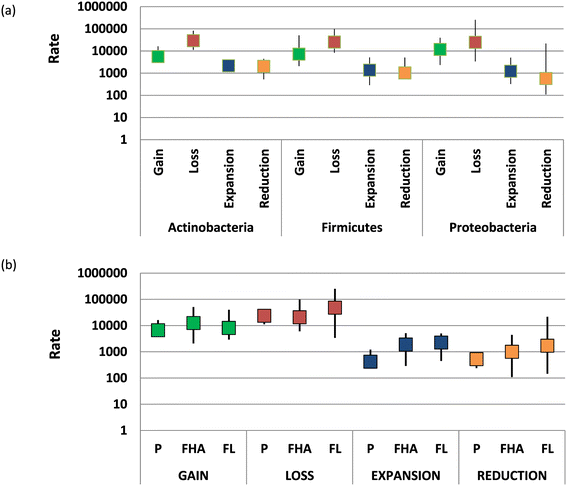
Dependence of the rates of gain, loss, expansion and reduction on bacterial taxonomy and lifestyle. (a) Rates of the four types of event for Actinobacteria, Firmicutes and Proteobacteria. (b) Rates of the four types of event for bacteria and archaea with three different lifestyles. FHA, facultative host-associated; FL, free-living; P, obligate intracellular parasite.
Figure 6
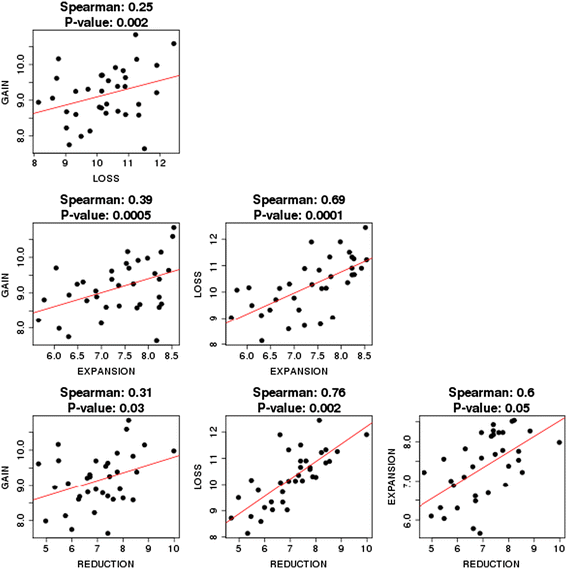
Correlations between the rates of gain, loss, expansion and reduction.
Figure 7
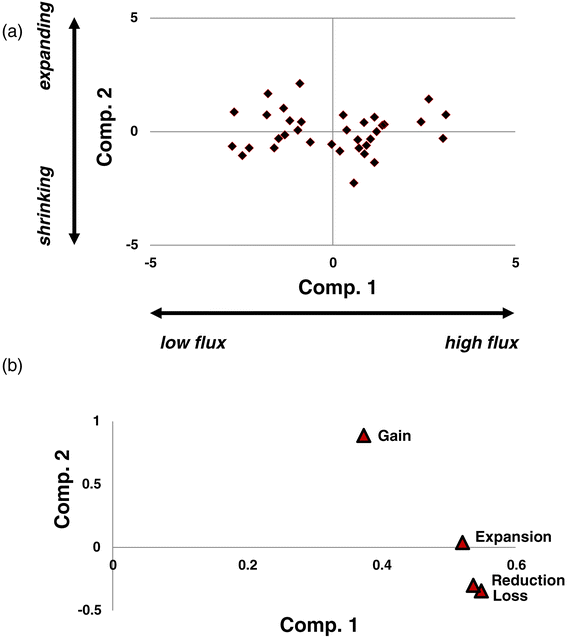
Principal component analysis of the rates of gains, losses, expansions and reductions. (a) XY-plot of the two first two principal components. (b) Principal component analysis loadings. Comp., component.
Figure 8
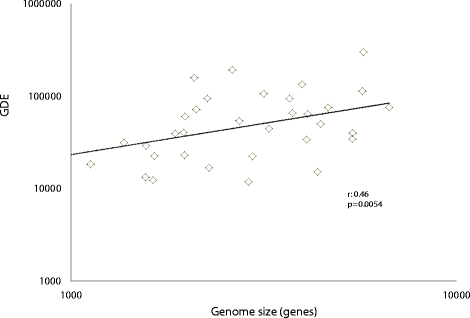
Correlation between gene flux and genome size. The horizontal axis shows the median number of genes in a genome in an ATGC. ATGC, alignable tight genome cluster; GDE, total gene flux (number of genome dynamics events per nucleotide substitution per site).
Figure 9
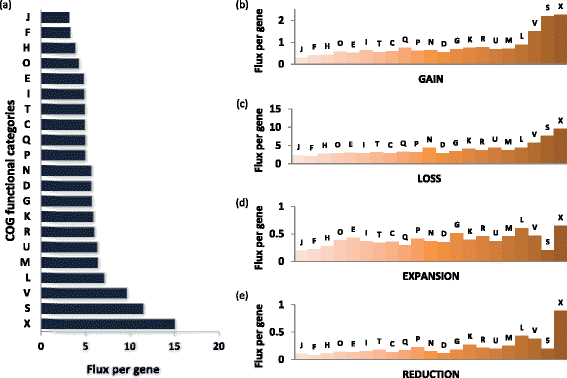
Genome flux by COG functional categories. (a) Flux. (b) Gain. (c) Loss. (d) Expansion. (e) Reduction. Designations of the functional categories (modified from [67]): C, energy production and conversion; D, cell division; E, amino acid metabolism and transport; F, nucleotide metabolism and transport; G, carbohydrate metabolism and transport; H, coenzyme metabolism; I, lipid metabolism; J, translation; K, transcription; L, replication and repair; M, membrane and cell wall structure and biogenesis; N, secretion and motility; O, post-translational modification, protein turnover and chaperone functions; P, inorganic ion transport and metabolism; Q, biosynthesis, transport and catabolism of secondary metabolites; R, general functional prediction only (typically, prediction of biochemical activity); S, function unknown; T, signal transduction; U, intracellular trafficking and secretion; V, defense systems; X, mobilome. COG, cluster of orthologous genes.
Figure 10
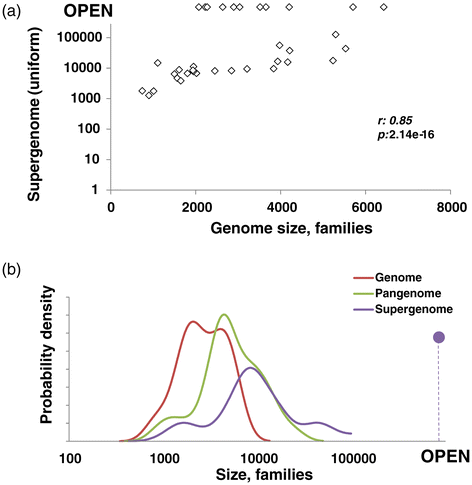
Comparison of genome, pangenome and estimated supergenome sizes. (a) Median genome vs supergenome size. (b) Density distribution of median genome, pangenome and supergenome size.
Figure 11
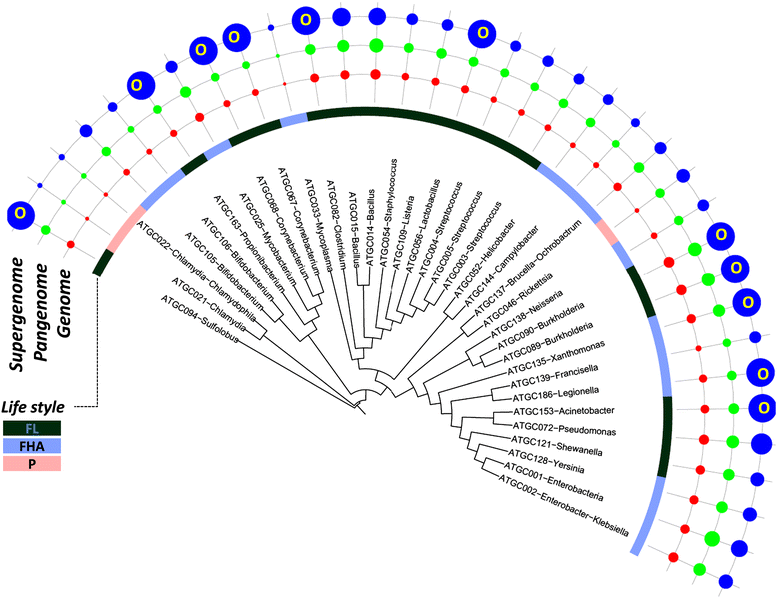
Distribution of the median genome, pangenome and estimated supergenome sizes over the evolutionary tree of prokaryotes. The tree is from MicrobesOnline [73]. Areas of the circles are proportional to the number of genes in the respective genomes (median), pangenome, a006Ed supergenome. FHA, facultative host-associated; FL, free-living; O, open supergenome; P, obligate intracellular parasite.
Similar articles
- Reconstruction of the evolution of microbial defense systems.
Puigbò P, Makarova KS, Kristensen DM, Wolf YI, Koonin EV. Puigbò P, et al. BMC Evol Biol. 2017 Apr 4;17(1):94. doi: 10.1186/s12862-017-0942-y. BMC Evol Biol. 2017. PMID: 28376755 Free PMC article. - Updated clusters of orthologous genes for Archaea: a complex ancestor of the Archaea and the byways of horizontal gene transfer.
Wolf YI, Makarova KS, Yutin N, Koonin EV. Wolf YI, et al. Biol Direct. 2012 Dec 14;7:46. doi: 10.1186/1745-6150-7-46. Biol Direct. 2012. PMID: 23241446 Free PMC article. - The Turbulent Network Dynamics of Microbial Evolution and the Statistical Tree of Life.
Koonin EV. Koonin EV. J Mol Evol. 2015 Jun;80(5-6):244-50. doi: 10.1007/s00239-015-9679-7. Epub 2015 Apr 18. J Mol Evol. 2015. PMID: 25894542 Free PMC article. Review. - Genome trees constructed using five different approaches suggest new major bacterial clades.
Wolf YI, Rogozin IB, Grishin NV, Tatusov RL, Koonin EV. Wolf YI, et al. BMC Evol Biol. 2001 Oct 20;1:8. doi: 10.1186/1471-2148-1-8. BMC Evol Biol. 2001. PMID: 11734060 Free PMC article. - Genomics of bacteria and archaea: the emerging dynamic view of the prokaryotic world.
Koonin EV, Wolf YI. Koonin EV, et al. Nucleic Acids Res. 2008 Dec;36(21):6688-719. doi: 10.1093/nar/gkn668. Epub 2008 Oct 23. Nucleic Acids Res. 2008. PMID: 18948295 Free PMC article. Review.
Cited by
- Theory of prokaryotic genome evolution.
Sela I, Wolf YI, Koonin EV. Sela I, et al. Proc Natl Acad Sci U S A. 2016 Oct 11;113(41):11399-11407. doi: 10.1073/pnas.1614083113. Epub 2016 Oct 4. Proc Natl Acad Sci U S A. 2016. PMID: 27702904 Free PMC article. - Cargo Genes of Tn_7_-Like Transposons Comprise an Enormous Diversity of Defense Systems, Mobile Genetic Elements, and Antibiotic Resistance Genes.
Benler S, Faure G, Altae-Tran H, Shmakov S, Zheng F, Koonin E. Benler S, et al. mBio. 2021 Dec 21;12(6):e0293821. doi: 10.1128/mBio.02938-21. Epub 2021 Dec 7. mBio. 2021. PMID: 34872347 Free PMC article. - Diversity and Evolutionary Dynamics of Antiphage Defense Systems in Ralstonia solanacearum Species Complex.
Castillo JA, Secaira-Morocho H, Maldonado S, Sarmiento KN. Castillo JA, et al. Front Microbiol. 2020 May 20;11:961. doi: 10.3389/fmicb.2020.00961. eCollection 2020. Front Microbiol. 2020. PMID: 32508782 Free PMC article. - Large-scale phylogenomics of aquatic bacteria reveal molecular mechanisms for adaptation to salinity.
Jurdzinski KT, Mehrshad M, Delgado LF, Deng Z, Bertilsson S, Andersson AF. Jurdzinski KT, et al. Sci Adv. 2023 May 26;9(21):eadg2059. doi: 10.1126/sciadv.adg2059. Epub 2023 May 26. Sci Adv. 2023. PMID: 37235649 Free PMC article. - Expanding the type IIB DNA topoisomerase family: identification of new topoisomerase and topoisomerase-like proteins in mobile genetic elements.
Takahashi TS, Da Cunha V, Krupovic M, Mayer C, Forterre P, Gadelle D. Takahashi TS, et al. NAR Genom Bioinform. 2019 Dec 19;2(1):lqz021. doi: 10.1093/nargab/lqz021. eCollection 2020 Mar. NAR Genom Bioinform. 2019. PMID: 33575570 Free PMC article.
References
Publication types
MeSH terms
LinkOut - more resources
Full Text Sources
Other Literature Sources
