Epithelial splicing regulatory proteins 1 (ESRP1) and 2 (ESRP2) suppress cancer cell motility via different mechanisms - PubMed (original) (raw)
Epithelial splicing regulatory proteins 1 (ESRP1) and 2 (ESRP2) suppress cancer cell motility via different mechanisms
Hiroki Ishii et al. J Biol Chem. 2014.
Abstract
ESRP1 (epithelial splicing regulatory protein 1) and ESRP2 regulate alternative splicing events associated with epithelial phenotypes of cells, and both are down-regulated during the epithelial-mesenchymal transition. However, little is known about their expression and functions during carcinogenesis. In this study, we found that expression of both ESRP1 and ESRP2 is plastic: during oral squamous cell carcinogenesis, these proteins are up-regulated relative to their levels in normal epithelium but down-regulated in invasive fronts. Importantly, ESRP1 and ESRP2 are re-expressed in the lymph nodes, where carcinoma cells metastasize and colonize. In head and neck carcinoma cell lines, ESRP1 and ESRP2 suppress cancer cell motility through distinct mechanisms: knockdown of ESRP1 affects the dynamics of the actin cytoskeleton through induction of Rac1b, whereas knockdown of ESRP2 attenuates cell-cell adhesion through increased expression of epithelial-mesenchymal transition-associated transcription factors. Down-regulation of ESRP1 and ESRP2 is thus closely associated with a motile phenotype of cancer cells.
Keywords: Cancer Biology; Cell Invasion; Cell Motility; ESRP; Epithelial-Mesenchymal Transition (EMT); RNA Splicing; Rac1b; SIP1; δEF1.
© 2014 by The American Society for Biochemistry and Molecular Biology, Inc.
Figures
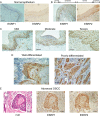
FIGURE 1.
ESRPs are up-regulated during human OSCC carcinogenesis. Expression of human ESRP1 and ESRP2 was investigated by immunohistochemical analysis. A and B, ESRP1 (left) and ESRP2 (right) expression (brown) in normal epithelium (A) and the border between normal epithelium and the dysplastic lesion (B). C, ESRP1 expression (brown) in different stages of dysplasia: mild (left), moderate (middle), and severe (right). D, ESRP1 expression (brown) in well (left) and poorly differentiated (right) OSCC tissues. E, ESRP1 or ESRP2 expression (brown) in advanced OSCC. Serial sections were stained with hematoxylin and eosin (H-E; left), anti-ESRP1 antibody (middle), and anti-ESRP2 antibody (right). Scale bars = 100 μm.
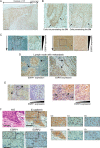
FIGURE 2.
ESRPs are down-regulated in invasive fronts. Expression of human ESRP1 and ESRP2 was investigated by immunohistochemical analysis. A, ESRP1 expression (brown) in the border between carcinoma in situ (CIS) and the invasive lesion. B, ESRP1 expression (brown) in the basal layer where the basement membrane (BM) was intact (left) or where cancer cells penetrated through the basement membrane (right). C, ESRP1 (left) or ESRP2 (right) expression (brown) in the invasive fronts of advanced OSCC. Arrows indicate the direction of tumor invasion. Each high-power field is shown in the panels surrounded by dashed lines. The gradient expression of ESRP1 or ESRP2 is schematically represented as a black slope. D and E, ESRP1 (left) or ESRP2 (right) expression (brown) in a lymph node with metastasis: cancer nests (D, arrows) or those with invasive fronts in the lymphatic tissue (E, arrows). Each high-power field is shown in the panels surrounded by dashed lines. The gradient expression of ESRP1 or ESRP2 is schematically represented as a black slope. F, representative image of the invasive fronts in advanced OSCC. Serial sections were stained with hematoxylin and eosin (H-E), anti-ESRP1 antibody, anti-ESRP2 antibody, and anti-E-cadherin antibody (brown). High-power fields of the noninvasive region (panels a, c, and e) and the tip of the invasive front (panels b, d, and f) are shown. Scale bars = 100 μm.
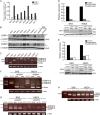
FIGURE 3.
Expression profiles and activities of ESRPs in HNSCC cell lines. A, mRNA levels of ESRP1 and ESRP2 in HNSCC cell lines as determined by quantitative RT-PCR. Expression levels are presented relative to those in T47D breast carcinoma cells, which express both ESRP1 and ESRP2, and each value was normalized to expression of GAPDH in the same sample. HeLa cells were used as a control. Values are means ± S.D. of triplicate measurements. B, protein levels of ESRP1 and ESRP2 in HNSCC cell lines as determined by immunoblot analysis. α-Tubulin was used as a loading control. Bands for each protein were confirmed by siRNAs against ESRP1 (siESRP1) and ESRP2 (siESRP2) in SAS cells. Arrows indicate ESRP1 (upper) and ESRP2 (lower). Asterisks denote nonspecific bands. C, profiles of CD44 variant (CD44v) and standard (CD44s) isoforms in HNSCC cell lines examined by conventional RT-PCR. β-actin was used as an internal control. D and E, knockdown of ESRP1 (D) and ESRP2 (E) in SAS and HSC4 cells. Cells were treated with control siRNA (siControl), ESRP1 siRNA, or ESRP2 siRNA for 48 h. The expression levels of mRNAs and proteins were examined by quantitative RT-PCR (upper) and immunoblotting (lower), respectively. mRNA levels are presented relative to those in cells treated with control siRNA after normalization to the level of GAPDH mRNA (upper). Values are means ± S.D. of triplicate measurements. α-Tubulin was used as a loading control (lower). In E, the arrow and asterisk denote ESRP2 protein and nonspecific bands, respectively. F, expression of CD44 isoforms was examined by conventional RT-PCR in SAS and HSC4 cells after knockdown of ESRP1. β-Actin was used as an internal control. G, expression of CD44 isoforms was examined by conventional RT-PCR after knockdown of ESRP2 in SAS and HSC4 cells. mRNAs extracted from ESRP1 knockdown in SAS and HSC4 cells were used as positive controls. β-Actin was used as an internal control. H, expression of MENA isoforms was examined by conventional PCR in SAS and HSC4 cells after knockdown of ESRP1 or ESRP2. β-Actin was used as an internal control.
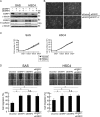
FIGURE 4.
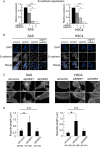
Knockdown of ESRP1 and/or ESRP2 results in increased cancer cell motility. Cells were treated with control (siControl), ESRP1 (siESRP1), or ESRP2 (siESRP2) siRNA 48 h before the following assays. A, protein expression of ESRP1, ESRP2, and E-cadherin in SAS and HSC4 cells in which ESRP1 and/or ESRP2 were knocked down as determined by immunoblotting. α-Tubulin was used as a loading control. B, phase-contrast images of morphological changes in SAS cells after knockdown of ESRP1 and/or ESRP2. Scale bars = 10 μm. C, proliferation of ESRP1- or ESRP2-silenced SAS (left) and HSC4 (right) cells was examined. Values are means ± S.D. of triplicate measurements. D, wound healing assay of SAS and HSC4 cells after knockdown of ESRP1 and/or ESRP2. The results were quantitated as shown (lower). Migration of the wound edge was measured at 10 randomly chosen points in the photograph. Cell migration distances after 12 h at 10 randomly chosen points were compared with the distances at 0 h. Values are means ± S.D. of triplicate measurements. Similar results were obtained in three independent experiments. p values were determined by Student's t test. *, p < 0.01; n.s., not significant.
FIGURE 5.
Mechanisms of enhanced cancer cell motility by ESRP knockdown. A, expression of E-cadherin in ESRP1- and/or ESRP2-silenced SAS and HSC4 cells as determined by quantitative RT-PCR analysis. mRNA levels are presented relative to those in cells treated with control siRNA after normalization to the level of GAPDH mRNA. Values are means ± S.D. of triplicate measurements. Similar results were obtained in three independent experiments. p values were determined by Student's t test. *, p < 0.05; ***, p < 0.001. siESRP1, ESRP1 siRNA; siESRP2, ESRP2 siRNA. B, subcellular localization of E-cadherin (white) in ESRP1 and/or ESRP2 knockdown SAS and HSC4 cells as visualized by immunofluorescence. Nuclei were stained with DAPI (blue). Scale bars = 2.5 μm. siControl, control siRNA. C, phalloidin staining of ESRP1 and/or ESRP2 knockdown SAS and HSC4 cells. High-power fields are shown (lower). Scale bars = 1.0 μm. D, quantification of filopodial length. Each number below the graphs indicates the number of measured filopodia. p values were determined by the median test. *, p < 0.001; n.s., not significant.
FIGURE 6.
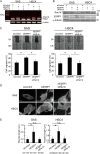
ESRP1 is associated with regulation of alternative splicing of Rac1 mRNA. A, schematic presentation of alternative splicing of Rac1 mRNA. Insertion of exon 3b (57 bp), which yields the Rac1b isoform, was examined. Primers were designed in exons 3 and 4. An ESRP-binding consensus sequence (UGGUGGGUG) is located 274 bp upstream of exon 3b (shown by the asterisk). Fw, forward; Rv, reverse. B and C, changes in Rac1 isoforms in ESRP1-, ESRP2-, and ESRP1/ESRP2-silenced HNSCC cells as determined by conventional PCR (B) or immunoblotting (C). siESRP1, ESRP1 siRNA; siESRP2, ESRP2 siRNA. In C, α-tubulin was used as a loading control. The quantification of Rac1b protein is shown (right). The density of Rac1b protein bands on Western blot images was measured and quantified. Protein levels are presented relative to those in cells treated with control siRNA (siControl) after normalization to the protein level of α-tubulin. Values are means ± S.D. of triplicate measurements. Similar results were obtained in three independent experiments. p values were determined by Student's t test. *, p < 0.05; n.s., not significant. D, detection of the active Rac1b isoform in ESRP1-silenced HNSCC cells by a pulldown assay using GST-PAK fusion protein. Rac1b (brown) was visualized using a specific monoclonal antibody raised against the amino acid sequence encoded by exon 3b. α-Tubulin was used as an input control. E, immunohistochemical detection of Rac1b in human advanced OSCC. The arrow indicates the direction of tumor invasion. The gradient expression of Rac1b is shown schematically as a black slope.
FIGURE 7.
Knockdown of ESRP1 increases cell motility through up-regulating Rac1b. Shown is the knockdown of the Rac1b isoform in SAS or HSC4 cells. Cells were treated with control (siControl), ESRP1 (siESRP1), or Rac1b (siRac1b) siRNA. After 48 h, RNAs or proteins were extracted and subjected to conventional RT-PCR (A) or immunoblotting (B) using anti-Rac1 antibody. In A, β-actin was used as an internal control. In B, the asterisk denotes Rac1, and α-tubulin was used as a loading control. C, wound healing assay of SAS and HSC4 cells in which ESRP1 alone or with Rac1b were knocked down. The results were quantitated as shown (lower). Migration of the wound edge was measured at 10 randomly chosen points in the photograph. Cell migration distances after 12 h at 10 randomly chosen points were compared with the distances at 0 h. Values are means ± S.D. of triplicate measurements. Similar results were obtained in three independent experiments. p values were determined by Student's t test. *, p < 0.01. D, phalloidin staining of SAS and HSC4 cells in which ESRP1 and Rac1b were knocked down. Scale bars = 1.0 μm. E, quantification of filopodial length. Each number below the graphs indicates the number of measured filopodia. p values were determined by the median test. *, p < 0.001; n.s., not significant.
FIGURE 8.
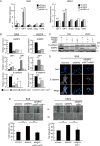
ESRP2 maintains E-cadherin expression by repressing the δEF1 family of transcription factors. A, expression of EMT-associated transcription factors in SAS and HSC4 cells in which ESRP2 or both ESRP1 and ESRP2 were knocked down. After incubation for 48 h, gene expression levels were measured by quantitative RT-PCR. mRNA levels are presented relative to those in cells treated with control siRNA after normalization to the level of GAPDH mRNA. Values are means ± S.D. of triplicate measurements. Similar results were obtained in three independent experiments. p values were determined by Student's t test. **, p < 0.01; ***, p < 0.001; n.s., not significant. B–E, SAS cells were transfected with control siRNA (siControl), with ESRP2 siRNA (siESRP2), or with ESRP2 plus δEF1 (si_δ_EF1) and SIP1 (siSIP1) siRNAs. HSC4 cells were transfected with control siRNA, with ESRP2 siRNA, or with ESRP2 plus SIP1 siRNAs. After incubation for 48 h, cells were used for the following assays. B, mRNA expression of ESRP2 (upper), δEF1/SIP1 (middle), and E-cadherin (lower) examined by quantitative real-time PCR. mRNA levels are presented relative to those in cells treated with control siRNA after normalization to the level of GAPDH mRNA. Values are means ± S.D. of triplicate measurements. Similar results were obtained in three independent experiments. p values were determined by Student's t test. *, p < 0.05; **, p < 0.01; ***, p < 0.001. C, protein levels of E-cadherin and ESRP2 as determined by immunoblotting. α-Tubulin was used as a loading control. D, subcellular localization of E-cadherin (white) in SAS cells in which ESRP2 or both ESRP2 and δEF1/SIP1 were knocked down as visualized by immunofluorescence. Nuclei were stained with DAPI (blue). Scale bars = 2.5 μm. E, wound healing assay of SAS and HSC4 cells in which ESRP2 or both ESRP2 and δEF1/SIP1 were knocked down. The results were quantitated as shown (lower). Migration of the wound edge was measured at 10 randomly chosen points in the photograph. Cell migration distances after 12 h at 10 randomly chosen points were compared with the distances at 0 h. Values are means ± S.D. of triplicate measurements. Similar results were obtained in three independent experiments. p values were determined by Student's t test. **, p < 0.01.
FIGURE 9.
Schematic illustration of regulation of cancer cell motility by ESRPs, the expression of which is plastic. Upper (in vivo findings), during carcinogenesis, ESRP1 and ESRP2 expression is increased in dysplasia, advanced carcinoma, and metastatic lesions compared with normal epithelium but is down-regulated in cells that acquire a motile phenotype during cancer invasion. CIS, carcinoma in situ. Lower (in vitro findings), ESRP1 and ESRP2 suppress cell motility through distinct transcriptional and/or post-transcriptional mechanisms.
Similar articles
- A Regulatory Axis between Epithelial Splicing Regulatory Proteins and Estrogen Receptor α Modulates the Alternative Transcriptome of Luminal Breast Cancer.
Elhasnaoui J, Ferrero G, Miano V, Franchitti L, Tarulli I, Coscujuela Tarrero L, Cutrupi S, De Bortoli M. Elhasnaoui J, et al. Int J Mol Sci. 2022 Jul 16;23(14):7835. doi: 10.3390/ijms23147835. Int J Mol Sci. 2022. PMID: 35887187 Free PMC article. - Dual Roles for Epithelial Splicing Regulatory Proteins 1 (ESRP1) and 2 (ESRP2) in Cancer Progression.
Hayakawa A, Saitoh M, Miyazawa K. Hayakawa A, et al. Adv Exp Med Biol. 2017;925:33-40. doi: 10.1007/5584_2016_50. Adv Exp Med Biol. 2017. PMID: 27401076 - Epithelial splicing regulatory protein 1 and 2 (ESRP1 and ESRP2) upregulation predicts poor prognosis in prostate cancer.
Freytag M, Kluth M, Bady E, Hube-Magg C, Makrypidi-Fraune G, Heinzer H, Höflmayer D, Weidemann S, Uhlig R, Huland H, Graefen M, Bernreuther C, Wittmer C, Tsourlakis MC, Minner S, Dum D, Hinsch A, Luebke AM, Simon R, Sauter G, Schlomm T, Möller K. Freytag M, et al. BMC Cancer. 2020 Dec 18;20(1):1220. doi: 10.1186/s12885-020-07682-8. BMC Cancer. 2020. PMID: 33339518 Free PMC article. - Roles and Regulation of Epithelial Splicing Regulatory Proteins 1 and 2 in Epithelial-Mesenchymal Transition.
Göttgens EL, Span PN, Zegers MM. Göttgens EL, et al. Int Rev Cell Mol Biol. 2016;327:163-194. doi: 10.1016/bs.ircmb.2016.06.003. Epub 2016 Jul 30. Int Rev Cell Mol Biol. 2016. PMID: 27692175 Review. - Epithelial specific splicing regulator proteins as emerging oncogenes in aggressive prostate cancer.
Advani R, Luzzi S, Scott E, Dalgliesh C, Weischenfeldt J, Munkley J, Elliott DJ. Advani R, et al. Oncogene. 2023 Oct;42(43):3161-3168. doi: 10.1038/s41388-023-02838-9. Epub 2023 Sep 26. Oncogene. 2023. PMID: 37752235 Free PMC article. Review.
Cited by
- Down-regulation of ESRP2 inhibits breast cancer cell proliferation via inhibiting cyclinD1.
He C, Chen Y, Zhang X, Feng H, Rao Y, Ji T, Wang W. He C, et al. Sci Rep. 2024 Nov 18;14(1):28475. doi: 10.1038/s41598-024-77980-9. Sci Rep. 2024. PMID: 39557898 Free PMC article. - Immune signature of gene expression pattern shared by autism spectrum disorder and Huntington's disease.
Liu H, Bai Q, Wang X, Jin Y, Ju X, Lu C. Liu H, et al. IBRO Neurosci Rep. 2024 Sep 29;17:311-319. doi: 10.1016/j.ibneur.2024.09.004. eCollection 2024 Dec. IBRO Neurosci Rep. 2024. PMID: 39398347 Free PMC article. - Splicing Machinery Is Impaired in Oral Squamous Cell Carcinomas and Linked to Key Pathophysiological Features.
Sanjuan-Sanjuan A, Alors-Perez E, Sanchez-Frías M, Monserrat-Barbudo JA, Falguera Uceda M, Heredero-Jung S, Luque RM. Sanjuan-Sanjuan A, et al. Int J Mol Sci. 2024 Jun 25;25(13):6929. doi: 10.3390/ijms25136929. Int J Mol Sci. 2024. PMID: 39000035 Free PMC article. - MicroRNAs as the critical regulators of epithelial mesenchymal transition in pancreatic tumor cells.
Tolue Ghasaban F, Ghanei M, Mahmoudian RA, Taghehchian N, Abbaszadegan MR, Moghbeli M. Tolue Ghasaban F, et al. Heliyon. 2024 May 1;10(9):e30599. doi: 10.1016/j.heliyon.2024.e30599. eCollection 2024 May 15. Heliyon. 2024. PMID: 38726188 Free PMC article. Review. - Knockdown of RNA-binding protein IMP3 suppresses oral squamous cell carcinoma proliferation by destabilizing E2F5 transcript.
Wang Z, Zhang H, Li F, Huang C. Wang Z, et al. Aging (Albany NY). 2024 Jan 24;16(2):1897-1910. doi: 10.18632/aging.205466. Epub 2024 Jan 24. Aging (Albany NY). 2024. PMID: 38271139 Free PMC article.
References
- Zeisberg E. M., Tarnavski O., Zeisberg M., Dorfman A. L., McMullen J. R., Gustafsson E., Chandraker A., Yuan X., Pu W. T., Roberts A. B., Neilson E. G., Sayegh M. H., Izumo S., Kalluri R. (2007) Endothelial-to-mesenchymal transition contributes to cardiac fibrosis. Nat. Med. 13, 952–961 - PubMed
- Polyak K., Weinberg R. A. (2009) Transitions between epithelial and mesenchymal states: acquisition of malignant and stem cell traits. Nat. Rev. Cancer 9, 265–273 - PubMed
- Thiery J. P., Acloque H., Huang R. Y., Nieto M. A. (2009) Epithelial to mesenchymal transitions in development and disease. Cell 139, 871–890 - PubMed
- De Craene B., Berx G. (2013) Regulatory networks defining EMT during cancer initiation and progression. Nat. Rev. Cancer 13, 97–110 - PubMed
Publication types
MeSH terms
Substances
LinkOut - more resources
Full Text Sources
Other Literature Sources
Research Materials
