A molecular framework for temperature-dependent gating of ion channels - PubMed (original) (raw)
A molecular framework for temperature-dependent gating of ion channels
Sandipan Chowdhury et al. Cell. 2014.
Abstract
Perception of heat or cold in higher organisms is mediated by specialized ion channels whose gating is exquisitely sensitive to temperature. The physicochemical underpinnings of this temperature-sensitive gating have proven difficult to parse. Here, we took a bottom-up protein design approach and rationally engineered ion channels to activate in response to thermal stimuli. By varying amino acid polarities at sites undergoing state-dependent changes in solvation, we were able to systematically confer temperature sensitivity to a canonical voltage-gated ion channel. Our results imply that the specific heat capacity change during channel gating is a major determinant of thermosensitive gating. We also show that reduction of gating charges amplifies temperature sensitivity of designer channels, which accounts for low-voltage sensitivity in all known temperature-gated ion channels. These emerging principles suggest a plausible molecular mechanism for temperature-dependent gating that reconcile how ion channels with an overall conserved transmembrane architecture may exhibit a wide range of temperature-sensing phenotypes. :
Copyright © 2014 Elsevier Inc. All rights reserved.
Figures
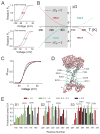
Figure 1. Design template for engineering a temperature modulated ion channel
(A) Arbitrary relative open probability vs voltage (POV) curves for a heat-sensing channel (top) and a cold-sensing channel (bottom) at two temperatures (red: high temperature, blue: low temperature). Arrows indicate the shifts in the curve on heating. (B) ΔG vs T profiles simulated using the equation: ΔG(T) = ΔHC + ΔCP(T−TC) − TΔCPln(T/TC) for two processes, one with a positive ΔCP (solid curve, ΔCP = 3 kcal/(mol.K)) and the other with a negative ΔCP (dotted curve, ΔCP = −3 kcal/(mol.K)) (see also Fig. S1). In both cases. the critical temperature, TC, was 308K (35°C), at which the change in enthalpy, ΔHC, was −3 kcal/mol. The heat sensing and cold sensing regimes of the curves are indicated by the red and blue colors respectively. (C) Relative POV curve of the wild-type Shaker KV channel at 28°C (red) and 8°C (blue) (measured from tail currents) (see also Fig. S1). (D) A model of a hydrated voltage-sensor, deduced from the crystal structure of the KV1.2/2.1 paddle chimera (see Extended experimental procedures in Supplementary Material), showing occupancy of water within the crevices of the voltage-sensor and the sites that were perturbed in this study. The S4 helix is shown as a cartoon while the S1-S3 helices are shown as ribbons. (E) Fractional buried surface area of different residues in the transmembrane segments S1-S3 (residues numbered according the 2R9R structure). The dotted horizontal lines indicate the cut-off for buried surface areas. The bars are colored according to the polarity index of the residue position, deduced from an alignment of 360 KV channel sequences. Residues targeted in this study are marked with arrows, with the residue numbers corresponding to Shaker KV channel. The residue marked with an asterisk, while enriched in polar residues in the alignment, is a hydrophobic residue in Shaker KV channel and was not studied here.
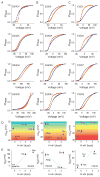
Figure 2. Crevice facing residues of S1-S3 segments sensitize channel opening to temperature
Relative open-probability vs voltage-curves for different perturbations at sites S240 (A), E293 (B) and Y323 (C) mutant, deduced from measurements of tail currents at 5mV voltage intervals (see also Fig. S2). Unless otherwise mentioned, in all cases blue curves indicate measurements at 8°C while red curves indicate measurements at 28°C. The mutation corresponding to each panel is listed in the top left corner of each panel. (D) Correlation of temperature dependent change in the median voltage of channel opening (ΔVM) with the hydrophobicity of perturbation (H-vH scale of biological hydrophobicity (Hessa et al., 2005)) for sites S240 (left panel), E293 (middle panel), Y323 (right panel). The color gradient is used to show the transition from heat (negative ΔVM) to cold sensitivity (positive ΔVM) for the spectrum of mutations. (E) Correlation of median voltage of channel opening (VM) at 28°C, with the hydrophobicity of perturbation for sites S240 (left panel), E293 (middle panel), Y323 (right panel)
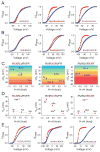
Figure 3. Non-charged residues in S4 segment modulate temperature-sensitivity
(A) Relative POV curves, at two temperatures (28°C, red and 8°C, blue) for hextuplet mutations in the S4 segment where six residues are simultaneously mutated to Ile (left), Met (middle) or Ala (right). (B) Relative POV curves, at two temperatures (28°C, red and 8°C, blue) for quadruplet mutations in the S4 segment where four residues are simultaneously mutated to Ile (left), Met (middle) or Ala (right). (C) Correlation of temperature dependent change in the median voltage of channel opening (ΔVM) with the hydrophobicity of perturbations for the Top (left panel), Middle (middle panel) and Bottom (right panel) doublet mutations (see also Figs. S3). The color gradient is used to show the transition from heat (negative ΔVM) to cold sensitivity (positive ΔVM) for the spectrum of mutations. (D) Correlation of median voltage of channel opening (VM) at 28°C with the hydrophobicity of perturbations for the Top (left panel), Middle (middle panel) and Bottom (right panel) doublet mutations. (E) Relative POV curves at two temperatures (28°C, red and 8°C, blue) for doublet Ser mutations.
Figure 4. Enhancement of heat sensitivity by combining temperature-sensitive perturbations
(A) Relative POV curves for the mutant Y323I-S2Mid at 28°C and 8°C. Horizontal bar plot in the inset shows the temperature dependent shifts (ΔVM) of the mutant (orange), compared with that of Y323I (red) and S2Mid (yellow). (B) Relative POV curves for the mutant Y323I-M6 at 28°C and 15°C. Horizontal bar plots in the inset show the shifts in the median voltage of activation (ΔVM) for Y323I-M6 (orange), Y323I (red) and M6 (yellow). For the Y323I and M6 the shifts correspond to 20°C change in temperature while for the Y323I-M6 the orange bar corresponds to a 13°C change in temperature (the dotted bar corresponds to the shift of the mutant for a 20°C change in temperature expected from a linear extrapolation of the experimental result). (C) and (D) Semi-logarithmic plots of fractional outward current, at -20 mV, at different temperatures vs inverse of temperature, measured over 28°C to 8°C, at 1°C intervals, for S2Bot (C) and Y323I-M6 (D) compared with that of the wild-type channel. Shaded region indicates the 10° - 14°C temperature regime over which the Q10 value was calculated. Using the formula: ΔH = RT2lnQ10/10 described by Clapham and Miller (2011), the ΔH for the two mutants (at -20mV and room temperature, 20°C) are calculated to be 49.9 kcal/mol (for S2Bot, (C)) and 48.5 kcal/mol (for Y323I/M6 (D)).
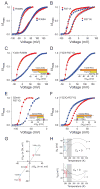
Figure 5. Influence of voltage-sensing charges on temperature sensitivity
(A) Relative POV curves of R368N (triangles) and R368A (circles) at 28°C (red) and 8°C (blue) (B) Relative POV curves of R371Q (triangles) and R371A (circles) at 28°C (red) and 8°C (blue) (see also Fig. S4). (C)-(F) Relative POV curves of a temperature sensitizing mutant (Y323I, (C), (D); S2mid (E); Y323Q (F)) in the background of a charge neutralizing mutant (R368N, (D); R371Q, (D)-(F)). In each case the inset shows the temperature induced ΔVM for the charge neutralizing mutant in red, the temperature sensitizing mutant in yellow and the combination mutant in orange. (G) ΔVM for each of the temperature sensitizing mutants (Y323I, S2mid, Y323Q) in the background of a gating charge neutralization mutant (R368N (blue circle) or R371Q (red circles)) plotted against ΔVM for each of the temperature sensitizing mutants (Y323I, S2mid, Y323Q) in the background of the native channel. The dotted line represents the regression line through the points, which has a slope of 2.06 ± 0.2. (H) Simulated VM vs temperature profile for a cold sensitive process (ΔCP > 0, top panel) and a heat sensitive process (ΔCP < 0, bottom panel), deduced using the equation: VM(T) = {ΔHC + ΔCP(T−TC) − TΔCPln(T/TC)}/z. In each case, dotted curves indicate the profiles for a process with low voltage-sensitivity and solid curves represent a process with high voltage-sensitivity. Arrows indicate the change in the change in VM due to change in temperature.
Figure 6. State-dependent change in solvation is a possible mechanism of temperature dependent gating
The cartoons (Top) and (Bottom) depict the voltage-sensors in resting and activated conformations. Voltage-dependent change in the VSD is associated with a change in solvation of a residue. When the residue is polar (Top), activation will be conferred a negative ΔCP (indicated by the blue halo around the hydration shell) and when the residue is non-polar (Bottom), activation will be conferred a positive ΔCP (indicated by the red halo around the hydration shell). The opposite signs of ΔCP in the two cases will lead to one of them (Top) being heat sensitive and the other (Bottom) being cold sensitive.
Comment in
- Building a temperature-sensitive ion channel.
Tsai MF, Miller C. Tsai MF, et al. Cell. 2014 Aug 28;158(5):977-979. doi: 10.1016/j.cell.2014.08.008. Cell. 2014. PMID: 25171401
Similar articles
- Building a temperature-sensitive ion channel.
Tsai MF, Miller C. Tsai MF, et al. Cell. 2014 Aug 28;158(5):977-979. doi: 10.1016/j.cell.2014.08.008. Cell. 2014. PMID: 25171401 - Ion channel gating: insights via molecular simulations.
Beckstein O, Biggin PC, Bond P, Bright JN, Domene C, Grottesi A, Holyoake J, Sansom MS. Beckstein O, et al. FEBS Lett. 2003 Nov 27;555(1):85-90. doi: 10.1016/s0014-5793(03)01151-7. FEBS Lett. 2003. PMID: 14630324 Review. - Emerging issues of connexin channels: biophysics fills the gap.
Harris AL. Harris AL. Q Rev Biophys. 2001 Aug;34(3):325-472. doi: 10.1017/s0033583501003705. Q Rev Biophys. 2001. PMID: 11838236 Review. - Engineering light-gated ion channels.
Banghart MR, Volgraf M, Trauner D. Banghart MR, et al. Biochemistry. 2006 Dec 26;45(51):15129-41. doi: 10.1021/bi0618058. Epub 2006 Dec 2. Biochemistry. 2006. PMID: 17176035 Review. - The principle of temperature-dependent gating in cold- and heat-sensitive TRP channels.
Voets T, Droogmans G, Wissenbach U, Janssens A, Flockerzi V, Nilius B. Voets T, et al. Nature. 2004 Aug 12;430(7001):748-54. doi: 10.1038/nature02732. Nature. 2004. PMID: 15306801
Cited by
- Transient receptor potential ankyrin 1 channel: An evolutionarily tuned thermosensor.
Sinica V, Vlachová V. Sinica V, et al. Physiol Res. 2021 Jul 12;70(3):363-381. doi: 10.33549/physiolres.934697. Epub 2021 May 12. Physiol Res. 2021. PMID: 33982589 Free PMC article. Review. - Biophysical Investigation of Sodium Channel Interaction with β-Subunit Variants Associated with Arrhythmias.
Llongueras JP, Das S, De Waele J, Capulzini L, Sorgente A, Van Petegem F, Bosmans F. Llongueras JP, et al. Bioelectricity. 2020 Sep 1;2(3):269-278. doi: 10.1089/bioe.2020.0030. Epub 2020 Sep 16. Bioelectricity. 2020. PMID: 34476357 Free PMC article. - An external sodium ion binding site controls allosteric gating in TRPV1 channels.
Jara-Oseguera A, Bae C, Swartz KJ. Jara-Oseguera A, et al. Elife. 2016 Feb 12;5:e13356. doi: 10.7554/eLife.13356. Elife. 2016. PMID: 26882503 Free PMC article. - Temperature sensitivity of two-pore (K2P) potassium channels.
Schneider ER, Anderson EO, Gracheva EO, Bagriantsev SN. Schneider ER, et al. Curr Top Membr. 2014;74:113-33. doi: 10.1016/B978-0-12-800181-3.00005-1. Curr Top Membr. 2014. PMID: 25366235 Free PMC article. Review. - Temperature increases by kilohertz frequency spinal cord stimulation.
Zannou AL, Khadka N, Truong DQ, Zhang T, Esteller R, Hershey B, Bikson M. Zannou AL, et al. Brain Stimul. 2019 Jan-Feb;12(1):62-72. doi: 10.1016/j.brs.2018.10.007. Epub 2018 Oct 17. Brain Stimul. 2019. PMID: 30482674 Free PMC article.
References
- Ahern CA, Horn R. Focused electric field across the voltage sensor of potassium channels. Neuron. 2005;48:25–29. - PubMed
Publication types
MeSH terms
Substances
Grants and funding
- R01 NS081293/NS/NINDS NIH HHS/United States
- T32 HL007936/HL/NHLBI NIH HHS/United States
- 5T32HL007936-09/HL/NHLBI NIH HHS/United States
- R01-NS081293/NS/NINDS NIH HHS/United States
LinkOut - more resources
Full Text Sources
Other Literature Sources


