Immunoglobulin A coating identifies colitogenic bacteria in inflammatory bowel disease - PubMed (original) (raw)
. 2014 Aug 28;158(5):1000-1010.
doi: 10.1016/j.cell.2014.08.006.
Marcel R de Zoete 2, Thomas W Cullen 3, Natasha A Barry 3, Jonathan Stefanowski 1, Liming Hao 4, Patrick H Degnan 3, Jianzhong Hu 5, Inga Peter 5, Wei Zhang 6, Elizabeth Ruggiero 6, Judy H Cho 6, Andrew L Goodman 3, Richard A Flavell 7
Affiliations
- PMID: 25171403
- PMCID: PMC4174347
- DOI: 10.1016/j.cell.2014.08.006
Immunoglobulin A coating identifies colitogenic bacteria in inflammatory bowel disease
Noah W Palm et al. Cell. 2014.
Abstract
Specific members of the intestinal microbiota dramatically affect inflammatory bowel disease (IBD) in mice. In humans, however, identifying bacteria that preferentially affect disease susceptibility and severity remains a major challenge. Here, we used flow-cytometry-based bacterial cell sorting and 16S sequencing to characterize taxa-specific coating of the intestinal microbiota with immunoglobulin A (IgA-SEQ) and show that high IgA coating uniquely identifies colitogenic intestinal bacteria in a mouse model of microbiota-driven colitis. We then used IgA-SEQ and extensive anaerobic culturing of fecal bacteria from IBD patients to create personalized disease-associated gut microbiota culture collections with predefined levels of IgA coating. Using these collections, we found that intestinal bacteria selected on the basis of high coating with IgA conferred dramatic susceptibility to colitis in germ-free mice. Thus, our studies suggest that IgA coating identifies inflammatory commensals that preferentially drive intestinal disease. Targeted elimination of such bacteria may reduce, reverse, or even prevent disease development.
Copyright © 2014 Elsevier Inc. All rights reserved.
Figures
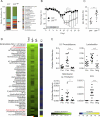
Figure 1. IgA−based sorting and 16S sequencing of fecal bacteria from specific pathogen free (SPF) mice
(A) Overview of IgA−based cell sorting of fecal bacteria combined with 16S rRNA gene sequencing (IgA−SEQ). (B) Representative results and a cartoon of cell sorting of IgA+ and IgA− fecal bacteria from mice. (C) Heatmap depicting IgA Coating Index (ICI) scores and average relative abundance of bacterial genera in Total (Presort), IgA+ and IgA− fractions of fecal bacteria from C57Bl/6 SPF mice (n=17 samples). Relative abundance heatmaps are depicted on a logarithmic scale. Genera that are highly coated with IgA (significantly higher relative abundance in the IgA+ fraction as compared to the IgA− fraction by LEfSe; P < 0.05) are marked with an asterisk. Genera with ICI > 10 are labeled in red. UC, unclassified in the Greengenes reference database. Gen., classified as a distinct but unnamed genus in the Greengenes reference database. (D) Relative abundance of significantly coated bacterial genera in Presort, IgA+ and IgA− fractions. * P < 0.05; *** P < 0.001 (Wilcoxon rank-sum). Indicated are mean ± standard error of the mean. See also Figure S1 and Table S1.
Figure 2. IgA coating identifies colitogenic bacteria in mice with inflammasome-mediated intestinal dysbiosis (SPFdys)
(A) Average relative abundance of bacterial genera of greater than 1% abundance in the intestinal microbiota of SPF and SPFdys mice. UC Prevotellaceae is marked with an arrow. SPFdys mice were co-housed with _Asc_−/− mice to allow for the acquisition of dysbiosis. (B) Dextran Sodium Sulfate (DSS)-induced colitis in SPF (n=5) and SPFdys (n=4) mice. * P < 0.05; ** _P_ < 0.01; *** _P_ < 0.001 (one-way ANOVA). (C) IgA coating of fecal bacteria from 10-16 week old SPF (n=8) and SPFdys (n=9) mice at the steady state. *** _P_ < 0.001 (unpaired Student's _t_-test). (D) Heatmap depicting IgA Coating Index (ICI) scores and average relative abundance of bacterial genera in Total (Presort), IgA+ and IgA− fractions of fecal bacteria from 10-16 week old SPFdys mice (n=14 samples) sampled under steady state conditions. Relative abundance heatmaps are depicted on a logarithmic scale. Genera that are highly coated with IgA (significantly higher relative abundance in the IgA+ fraction as compared to the IgA− fraction by LEfSe; _P_ < 0.05) are marked with an asterisk. Genera with ICI > 10 are labeled in red. (E) Relative abundance of significantly coated genera in Presort, IgA+ and IgA− fractions. * P < 0.05; *** P < 0.001 (Wilcoxon rank-sum). Indicated are mean ± standard error of the mean. UC, unclassified in the Greengenes reference database. Gen., classified as a distinct but unnamed genus in the Greengenes reference database. See also Figure S2 and Table S2.
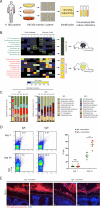
Figure 3. IgA coating of fecal bacteria from healthy humans and inflammatory bowel disease patients
(A) IgA coating of fecal bacteria from 20 healthy subjects, 27 Crohn's disease patients (CD) and 8 Ulcerative colitis patients (UC). *P < 0.05; ***_P_ < 0.001 (one-way ANOVA). (B) Venn-diagram depicting the distribution of highly coated bacterial species in healthy, UC and CD patients. Bacterial taxa that showed an ICI score greater than 10 in at least one subject were classified as highly coated within that group. (C) Heatmap depicting IgA coating index (ICI) scores for bacterial species that are uniquely highly coated (ICI > 10) in IBD and never highly coated or never present in healthy controls. Bars to the right of the heatmap correspond with the color-coding of the Venn-diagram in panel (B). Each column represents an individual human subject. UC, unclassified in the Greengenes reference database. Spp., classified as a distinct but unnamed species in the Greengenes reference database. See also Figure S3 and Table S3.
Figure 4. Isolation of personalized IBD-associated gut microbiota culture collections, assembly of IgA+ and IgA− consortia and colonization of germ-free mice
(A) Strategy for isolation of personalized IBD-associated gut microbiota culture collections. (B) Selection of individual bacterial isolates comprising IgA+ and IgA− consortia and colonization of germ-free mice. Specific isolates that were included in the consortia are boxed in green (IgA−) or red (IgA+). (C) Barplots depicting relative abundance of bacterial taxa in IgA+ and IgA− consortia pre-gavage (D0) and in the feces of IgA+ and IgA− colonized mice 2 weeks post-colonization. All members of the pre-gavage consortia were detectable in colonized mice except Peptinophilus spp. in the IgA− consortium and Streptococcus spp. in the IgA+ consortium. UC, unclassified in the Greengenes reference database. Spp., classified as a distinct but unnamed species in the Greengenes reference database. (D) IgA coating of fecal bacteria from germ-free mice colonized with IgA+ (n=5) or IgA−consortia (n=5) on days 7 and 24 post-colonization. Representative plots are shown. *** P < 0.005 (unpaired Student's t-test). Indicated are mean ± standard error of the mean. (E) Microbiota localization as visualized by 16S rRNA FISH (red) and DAPI (blue) staining. The mucus layer is demarked by two dotted lines. See also Figure S4.
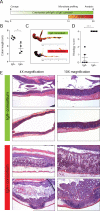
Figure 5. IBD-associated IgA+ bacteria exacerbate DSS-induced colitis in gnotobiotic mice
(A) Timeline of colonization and DSS treatment in germ-free mice colonized with IgA+ and IgA− consortia. (B) Colon length after DSS. * P < 0.05 (unpaired Student's t-test). (C) Gross pathology of large bowels after DSS. Note the extensive bleeding and diarrhea in the IgA+ colonized mice. (D) Colon histopathology scores after DSS. Scores were assigned as follows: 0, Intact colonic architecture. No acute inflammation or epithelial injury; 1, Focal minimal acute inflammation; 2, Focal mild acute inflammation; 3, Severe acute inflammation with multiple crypt abscesses and/or focal ulceration; 4, Severe acute inflammation, multiple crypt abscesses, epithelial loss and extensive ulceration. *** P < 0.0001 (unpaired Student's t-test). (E) Representative histology pictures from hematoxylin and eosin stained colons after DSS. Note that IgA+ colonized mice exhibit extensive inflammation, crypt abscesses, epithelial loss, and ulceration, while all IgA− colonized mice showed either no inflammation or minimal/mild focal inflammation. Data are representative of 3 independent experiments. See also Figure S5.
Comment in
- IgA targets the troublemakers.
Stephens WZ, Round JL. Stephens WZ, et al. Cell Host Microbe. 2014 Sep 10;16(3):265-7. doi: 10.1016/j.chom.2014.08.012. Cell Host Microbe. 2014. PMID: 25211066 - IBD: Microbial drivers of IBD identified by levels of IgA coating.
Leake I. Leake I. Nat Rev Gastroenterol Hepatol. 2014 Nov;11(11):642. doi: 10.1038/nrgastro.2014.166. Epub 2014 Sep 16. Nat Rev Gastroenterol Hepatol. 2014. PMID: 25223872 No abstract available. - [Immunoglobulin A coating identifies colitogenic bacteria in inflammatory bowel disease].
Reinshagen M. Reinshagen M. Z Gastroenterol. 2015 Jan;53(1):53. doi: 10.1055/s-0034-1385651. Epub 2015 Jan 16. Z Gastroenterol. 2015. PMID: 25594709 German. No abstract available.
Similar articles
- Dynamic immunoglobulin responses to gut bacteria during inflammatory bowel disease.
Rengarajan S, Vivio EE, Parkes M, Peterson DA, Roberson EDO, Newberry RD, Ciorba MA, Hsieh CS. Rengarajan S, et al. Gut Microbes. 2020 May 3;11(3):405-420. doi: 10.1080/19490976.2019.1626683. Epub 2019 Jun 16. Gut Microbes. 2020. PMID: 31203722 Free PMC article. - Microbial Signatures and Innate Immune Gene Expression in Lamina Propria Phagocytes of Inflammatory Bowel Disease Patients.
Dheer R, Davies JM, Quintero MA, Damas OM, Deshpande AR, Kerman DH, Sawyer WP, Pignac-Kobinger J, Ban Y, Fernandez I, Burgueno JF, Phillips MC, Abreu MT. Dheer R, et al. Cell Mol Gastroenterol Hepatol. 2020;9(3):387-402. doi: 10.1016/j.jcmgh.2019.10.013. Epub 2019 Nov 15. Cell Mol Gastroenterol Hepatol. 2020. PMID: 31740421 Free PMC article. - Immunoglobulin A Targets a Unique Subset of the Microbiota in Inflammatory Bowel Disease.
Shapiro JM, de Zoete MR, Palm NW, Laenen Y, Bright R, Mallette M, Bu K, Bielecka AA, Xu F, Hurtado-Lorenzo A, Shah SA, Cho JH, LeLeiko NS, Sands BE, Flavell RA, Clemente JC. Shapiro JM, et al. Cell Host Microbe. 2021 Jan 13;29(1):83-93.e3. doi: 10.1016/j.chom.2020.12.003. Epub 2021 Jan 1. Cell Host Microbe. 2021. PMID: 33385335 Free PMC article. - Bridging the gap between host immune response and intestinal dysbiosis in inflammatory bowel disease: does immunoglobulin A mark the spot?
Shapiro JM, Cho JH, Sands BE, LeLeiko NS. Shapiro JM, et al. Clin Gastroenterol Hepatol. 2015 May;13(5):842-6. doi: 10.1016/j.cgh.2015.02.028. Epub 2015 Feb 25. Clin Gastroenterol Hepatol. 2015. PMID: 25725444 Review. - Heme Oxygenase-1 as a Modulator of Intestinal Inflammation Development and Progression.
Sebastián VP, Salazar GA, Coronado-Arrázola I, Schultz BM, Vallejos OP, Berkowitz L, Álvarez-Lobos MM, Riedel CA, Kalergis AM, Bueno SM. Sebastián VP, et al. Front Immunol. 2018 Sep 12;9:1956. doi: 10.3389/fimmu.2018.01956. eCollection 2018. Front Immunol. 2018. PMID: 30258436 Free PMC article. Review.
Cited by
- Visceral adiposity in postmenopausal women is associated with a pro-inflammatory gut microbiome and immunogenic metabolic endotoxemia.
Gaber M, Wilson AS, Millen AE, Hovey KM, LaMonte MJ, Wactawski-Wende J, Ochs-Balcom HM, Cook KL. Gaber M, et al. Microbiome. 2024 Oct 4;12(1):192. doi: 10.1186/s40168-024-01901-1. Microbiome. 2024. PMID: 39367431 Free PMC article. - The dialogue between unconventional T cells and the microbiota.
Lin Q, Kuypers M, Philpott DJ, Mallevaey T. Lin Q, et al. Mucosal Immunol. 2020 Nov;13(6):867-876. doi: 10.1038/s41385-020-0326-2. Epub 2020 Jul 23. Mucosal Immunol. 2020. PMID: 32704035 Review. - The human intestinal B-cell response.
Spencer J, Sollid LM. Spencer J, et al. Mucosal Immunol. 2016 Sep;9(5):1113-24. doi: 10.1038/mi.2016.59. Epub 2016 Jul 27. Mucosal Immunol. 2016. PMID: 27461177 Review. - Gut microbiota and autism spectrum disorders: a bidirectional Mendelian randomization study.
Li Z, Liu S, Liu F, Dai N, Liang R, Lv S, Bao L. Li Z, et al. Front Cell Infect Microbiol. 2023 Dec 14;13:1267721. doi: 10.3389/fcimb.2023.1267721. eCollection 2023. Front Cell Infect Microbiol. 2023. PMID: 38156319 Free PMC article. - Systemic antibody responses against gut microbiota flagellins implicate shared and divergent immune reactivity in Crohn's disease and chronic fatigue syndrome.
Bourgonje AR, Hörstke NV, Fehringer M, Innocenti G, Vogl T. Bourgonje AR, et al. Microbiome. 2024 Jul 29;12(1):141. doi: 10.1186/s40168-024-01858-1. Microbiome. 2024. PMID: 39075559 Free PMC article.
References
- Bankevich A, Nurk S, Antipov D, Gurevich AA, Dvorkin M, Kulikov AS, Lesin VM, Nikolenko SI, Pham S, Prjibelski AD, et al. SPAdes: a new genome assembly algorithm and its applications to single-cell sequencing. Journal of computational biology : a journal of computational molecular cell biology. 2012;19:455–477. - PMC - PubMed
- Bemark M, Boysen P, Lycke NY. Induction of gut IgA production through T cell-dependent and T cell-independent pathways. Annals of the New York Academy of Sciences. 2012;1247:97–116. - PubMed
Publication types
MeSH terms
Substances
Grants and funding
- T32 AR 7107-37/AR/NIAMS NIH HHS/United States
- T32 AR007107/AR/NIAMS NIH HHS/United States
- DP2 GM105456/GM/NIGMS NIH HHS/United States
- GM103574/GM/NIGMS NIH HHS/United States
- HHMI/Howard Hughes Medical Institute/United States
- GM105456/GM/NIGMS NIH HHS/United States
- R01 DK092235/DK/NIDDK NIH HHS/United States
- K01DK094986/DK/NIDDK NIH HHS/United States
- K01 DK094986/DK/NIDDK NIH HHS/United States
- U01 DK062422/DK/NIDDK NIH HHS/United States
LinkOut - more resources
Full Text Sources
Other Literature Sources
Medical
Molecular Biology Databases
Miscellaneous


