Circulating tumor cell clusters are oligoclonal precursors of breast cancer metastasis - PubMed (original) (raw)
. 2014 Aug 28;158(5):1110-1122.
doi: 10.1016/j.cell.2014.07.013.
Aditya Bardia 1, David T Miyamoto 2, Maria C Donaldson 1, Ben S Wittner 1, Joel A Spencer 3, Min Yu 1, Adam Pely 3, Amanda Engstrom 1, Huili Zhu 1, Brian W Brannigan 1, Ravi Kapur 4, Shannon L Stott 5, Toshi Shioda 1, Sridhar Ramaswamy 1, David T Ting 1, Charles P Lin 3, Mehmet Toner 6, Daniel A Haber 7, Shyamala Maheswaran 8
Affiliations
- PMID: 25171411
- PMCID: PMC4149753
- DOI: 10.1016/j.cell.2014.07.013
Circulating tumor cell clusters are oligoclonal precursors of breast cancer metastasis
Nicola Aceto et al. Cell. 2014.
Abstract
Circulating tumor cell clusters (CTC clusters) are present in the blood of patients with cancer but their contribution to metastasis is not well defined. Using mouse models with tagged mammary tumors, we demonstrate that CTC clusters arise from oligoclonal tumor cell groupings and not from intravascular aggregation events. Although rare in the circulation compared with single CTCs, CTC clusters have 23- to 50-fold increased metastatic potential. In patients with breast cancer, single-cell resolution RNA sequencing of CTC clusters and single CTCs, matched within individual blood samples, identifies the cell junction component plakoglobin as highly differentially expressed. In mouse models, knockdown of plakoglobin abrogates CTC cluster formation and suppresses lung metastases. In breast cancer patients, both abundance of CTC clusters and high tumor plakoglobin levels denote adverse outcomes. Thus, CTC clusters are derived from multicellular groupings of primary tumor cells held together through plakoglobin-dependent intercellular adhesion, and though rare, they greatly contribute to the metastatic spread of cancer.
Copyright © 2014 Elsevier Inc. All rights reserved.
Figures
Figure 1. CTC-clusters harbor increased metastatic potential compared to single CTCs
A) Schematic of the experiment. MDA-MB-231-LM2 (LM2) cells expressing GFP (LM2-GFP) or mCherry (LM2-mCherry) cells were mixed at 1:1 ratio and injected in the right mammary gland of immunodeficient mice to generate one-color single CTCs and multicolor CTC-clusters. Accordingly, one-color metastatic foci are derived from a single CTC, while multicolor foci arise predominantly from a CTC-cluster. B) Representative images of single CTCs (GFP- or mCherry-positive) and CTC-clusters (GFP- and mCherry-positive) captured on the HBCTC-Chip (left). Lung metastatic foci derived from a single CTC (GFP- or mCherry-positive) or a CTC-cluster (GFP- and mCherry-positive) are shown (right). GFP (brown), mCherry (red). Blood samples and lung specimens were isolated five weeks after primary tumor development. n=5. C) Bar graphs showing the mean percentage of one-color versus multicolor CTC events captured by the HBCTC-Chip (left), the mean percentage of one-color versus multicolor CTC-clusters (middle), as well as the mean percentage of one-color versus multicolor lung foci (right). n=5. D) Bar graph showing the normalized metastatic potential of single CTCs and CTC-clusters. n=5, *_p_=0.031 by Student’s t test. E) Schematic of the experiment. LM2-GFP cells were injected in the right mammary gland while LM2-mCherry cells were injected in the left mammary gland of immunodeficient mice to generate tumors that give rise to one-color single CTCs and CTC-clusters, as well as rare multicolor CTC-clusters (resulting from aggregation events). Accordingly, one-color metastatic foci are derived from a single CTC or a CTC-cluster, while multicolor foci derive from CTC aggregates. F) Representative images of single CTCs (GFP- or mCherry-positive) and CTC-clusters (GFP- or mCherry-positive) captured on the HBCTC-Chip (left). Lung metastatic foci derived from a single CTC (GFP- or mCherry-positive) or a CTC-cluster (GFP- or mCherry-positive) are shown (right). GFP (brown), mCherry (red). Blood samples and lung specimens were isolated five weeks after primary tumor development. n=5. G) Bar graphs showing the mean percentage of one-color versus rare multicolor CTC events captured by the HBCTC-Chip (left), the mean percentage of one-color versus multicolor CTC-clusters (middle), as well as the mean percentage of one-color versus multicolor lung foci (right). n=5. See also Figure S1 and Figure S2.
Figure 2. CTC-clusters are more resistant to apoptosis at distal metastatic sites
A) Schematic showing MDA-MB-231-LM2-GFP-Luciferase (LM2) cells prepared as single cells (LM2-SC) or as clusters (LM2-CL) prior to injection into the tail vein of immunodeficient mice. 2×10⁵ cells were injected as LM-SC or LM2-CL per mouse. B) Representative bioluminescence images of mice at 0, 6 and 12 days after tail vein injection with LM2-SC or LM2-CL cells (left). n=4. Representative images of GFP-stained sections of mouse lungs after injection with LM2-SC or LM2-CL cells (right). The bar graph shows the mean percentage of GFP-positive cells in lungs from LM2-SC-or LM2-CL-injected mice. n=4; NS=not significant, *_p_=0.03 by Student’s t test. C) Representative images of cleaved caspase 3-stained sections of mouse lungs 24 hours after injection with LM2-SC or LM2-CL cells. The bar graph shows the mean percentage of cleaved caspase 3-positive cells in lungs from LM2-SC- or LM2-CL-injected mice. n=4; *p<0.02 by Student’s t test. D) Lung metastasis growth curve from mice injected with LM2-SC or LM-CL. n=4; p<0.03 by Student’s t test. E) Kaplan-Meier survival plot showing survival rates for mice injected with LM2-SC or LM2-CL. n=4; p<0.016 by Log-rank test. See also Figure S3.
Figure 3. CTC-clusters demonstrate faster clearance rate from the bloodstream
A) Schematic showing the experimental setup for measuring the clearance time of single CTCs and CTC-clusters. Briefly, DiD-stained LM2 cells were prepared as LM2-SC or LM2-CL and injected into the tail vein of immunodeficient mice. In vivo flow cytometry was applied to the ear blood vessels to detect single CTCs and CTC-clusters over a 55 minutes period after injection. Graphs show representative fluorescence peaks corresponding to the transit of a single CTC or CTC-cluster through the ear blood vessel. B) Graph showing single CTCs and CTC-clusters clearance curves. n=5 for single CTCs and n=4 for CTC-clusters, *p<0.01 by two-way ANOVA.
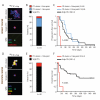
Figure 4. The presence of CTC-clusters in patients with cancer correlates with poor prognosis
A) Representative images of a CTC-cluster, a single CTC and a white blood cell (WBC) isolated from a breast cancer patient using the HBCTC-Chip and stained with wide-spectrum cytokeratin (CK, red), CD45 (green) and DAPI (nuclei, blue). B) A total of 79 breast cancer patients (corresponding to 265 timepoints) were analyzed for the presence of CTCs, with 54 of the 79 patients scoring positive for CTCs. The bar graph shows the percentage of CTC-positive patients having CTC-clusters during more than three time points (red), CTC-clusters across one to three time points (blue) or single CTCs only (black). C) Kaplan-Meier progression-free survival plot showing progression rates for breast cancer patients having CTC-clusters during more than three time points (red), CTC-clusters across one to three time points (blue) or single CTCs only (black). The mean progression-free survival time for each group is given in parentheses. _p_=0.0002 by Log-rank test. D) Representative images of a CTC-cluster, a single CTC and a white blood cell (WBC) isolated from a prostate cancer patient using the HBCTC-Chip and stained with prostate-specific antigen (PSA, red), prostate-specific membrane antigen (PSMA, yellow), CD45 (green) and DAPI (nuclei, blue). B) A total of 64 prostate cancer patients (corresponding to 202 timepoints) were analyzed for the presence of CTCs, with 48 of the 64 patients scoring positive for CTCs. The bar graph shows the percentage of CTC-positive patients having CTC-clusters during at least one time point (red) or single CTCs only (black). C) Kaplan-Meier overall survival plot showing progression rates for prostate cancer patients having CTC-clusters during at least one time point (red) or single CTCs only (black). The mean overall survival time for each group is given in parentheses. _p_=0.0001 by Log-rank test. See also Table S1.
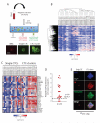
Figure 5. RNA sequencing of CTC-clusters and single CTCs reveals a CTC-clusters-associated gene set
A) Illustration of the experimental setup (top). Representative images of a labeled white blood cell (WBC, red), a single CTC and a CTC-cluster (green) (bottom). B) Heatmap showing unsupervised hierarchical clustering of 15 single CTCs pools and matched 14 CTC-clusters isolated from 10 breast cancer patients (SC: single CTCs, CL: CTC-cluster). C) Heatmap showing the top 31 transcripts upregulated in CTC-clusters. n=15 for single CTCs and n=14 for CTC-clusters; q<0.01, log2 fold change (FC) >1 in more than 70% intra-patient comparisons (SC: single CTCs, CL: CTC-cluster). D) Graph showing log2 fold increase in plakoglobin for each comparison between matched CTC-clusters versus single CTCs. The threshold line represents a q<0.01 and log2 fold increase >1. E) Representative images of a single CTC and a CTC-cluster captured on the HBCTC-Chip from a breast cancer patient and stained with wide-spectrum cytokeratin (CK, red), plakoglobin (green) and DAPI (nuclei, blue). See also Figure S4 and Table S2.
Figure 6. Plakoglobin expression correlates with decreased distant metastasis-free survival
A) Kaplan-Meier distant metastasis-free survival plot showing progression rates for patients whose primary tumor expressed either “low plakoglobin” or “high plakoglobin” transcript. n=1956; _p_=0.008 by Log-rank test. B) Representative images of plakoglobin (red) and CD31 (blood vessels, brown)-stained tissue sections of matched primary tumor (left) and bone metastasis (right) from a hormone receptor-positive breast cancer patient with high CTC-cluster counts. Arrows indicate blood vessels in “high plakoglobin” regions. Nuclei are stained with hematoxylin. The bar graph (middle) shows plakoglobin reads per million in matched single CTCs and CTC-clusters isolated from the same patient. n=3; *_p_=0.031. See also Figure S5 and Figure S6.
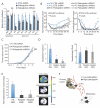
Figure 7. Plakoglobin is required for CTC-cluster formation and lung metastasis
A) Bar graph showing the relative cell-to-cell adhesion in a panel of mammary epithelial cells and breast cancer cell lines grown in the presence or absence of plakoglobin. n=5; *p<0.04. B) Lung metastasis growth curves from mice injected with LM2-GFP-Luciferase (left) or BT474-GFP-Luciferase (right) cells expressing control or plakoglobin shRNAs and prepared as single cells (SC) or clusters (CL). n=4; *p<0.05, **p<0.04 by Student’s t test. C) LM2-GFP-Luciferase tumor growth curves in the presence or absence of plakoglobin. n=4; NS=not significant. D) Bar graphs showing the normalized number of CTC-clusters (left) and single CTCs (right) per ml of blood. Blood samples were isolated 4 weeks after primary tumor development and processed with the HBCTC-Chip. n=4; *p<0.05 by Student’s t test. E) Bar graph showing normalized lung photon counts from mice bearing a LM2-GFP-Luciferase control or plakoglobin knockdown primary tumor for 4 weeks. n=4; *p<0.045 by Student’s t test. F) Schematic showing that “high plakoglobin” regions in the primary tumor are likely to generate CTC-clusters with increased metastatic potential. See also Figure S7.
Comment in
- Metastasis: Working in groups.
Seton-Rogers S. Seton-Rogers S. Nat Rev Cancer. 2014 Oct;14(10):645. doi: 10.1038/nrc3823. Epub 2014 Sep 11. Nat Rev Cancer. 2014. PMID: 25209057 No abstract available. - Cancer: Staying together on the road to metastasis.
Bottos A, Hynes NE. Bottos A, et al. Nature. 2014 Oct 16;514(7522):309-10. doi: 10.1038/514309a. Nature. 2014. PMID: 25318518 No abstract available.
Similar articles
- Relevance of CTC Clusters in Breast Cancer Metastasis.
Piñeiro R, Martínez-Pena I, López-López R. Piñeiro R, et al. Adv Exp Med Biol. 2020;1220:93-115. doi: 10.1007/978-3-030-35805-1_7. Adv Exp Med Biol. 2020. PMID: 32304082 Review. - In Vivo Detection of CTC and CTC Plakoglobin Status Helps Predict Prognosis in Patients with Metastatic Breast Cancer.
Xie N, Hu Z, Tian C, Xiao H, Liu L, Yang X, Li J, Wu H, Lu J, Gao J, Hu X, Cao M, Shui Z, Ouyang Q. Xie N, et al. Pathol Oncol Res. 2020 Oct;26(4):2435-2442. doi: 10.1007/s12253-020-00847-7. Epub 2020 Jun 18. Pathol Oncol Res. 2020. PMID: 32557169 - A microfluidic device for label-free, physical capture of circulating tumor cell clusters.
Sarioglu AF, Aceto N, Kojic N, Donaldson MC, Zeinali M, Hamza B, Engstrom A, Zhu H, Sundaresan TK, Miyamoto DT, Luo X, Bardia A, Wittner BS, Ramaswamy S, Shioda T, Ting DT, Stott SL, Kapur R, Maheswaran S, Haber DA, Toner M. Sarioglu AF, et al. Nat Methods. 2015 Jul;12(7):685-91. doi: 10.1038/nmeth.3404. Epub 2015 May 18. Nat Methods. 2015. PMID: 25984697 Free PMC article. - Dissecting Breast Cancer Circulating Tumor Cells Competence via Modelling Metastasis in Zebrafish.
Martínez-Pena I, Hurtado P, Carmona-Ule N, Abuín C, Dávila-Ibáñez AB, Sánchez L, Abal M, Chaachou A, Hernández-Losa J, Cajal SRY, López-López R, Piñeiro R. Martínez-Pena I, et al. Int J Mol Sci. 2021 Aug 27;22(17):9279. doi: 10.3390/ijms22179279. Int J Mol Sci. 2021. PMID: 34502201 Free PMC article. - Circulating tumor cell clusters-associated gene plakoglobin and breast cancer survival.
Lu L, Zeng H, Gu X, Ma W. Lu L, et al. Breast Cancer Res Treat. 2015 Jun;151(3):491-500. doi: 10.1007/s10549-015-3416-1. Epub 2015 May 10. Breast Cancer Res Treat. 2015. PMID: 25957595 Review.
Cited by
- The Relevance of Circadian Clocks to Stem Cell Differentiation and Cancer Progression.
Malik A, Nalluri S, De A, Beligala D, Geusz ME. Malik A, et al. NeuroSci. 2022 Mar 29;3(2):146-165. doi: 10.3390/neurosci3020012. eCollection 2022 Jun. NeuroSci. 2022. PMID: 39483369 Free PMC article. Review. - Breast cancer secretes anti-ferroptotic MUFAs and depends on selenoprotein synthesis for metastasis.
Ackermann T, Shokry E, Deshmukh R, Anand J, Galbraith LCA, Mitchell L, Rodriguez-Blanco G, Villar VH, Sterken BA, Nixon C, Zanivan S, Blyth K, Sumpton D, Tardito S. Ackermann T, et al. EMBO Mol Med. 2024 Oct 21. doi: 10.1038/s44321-024-00142-x. Online ahead of print. EMBO Mol Med. 2024. PMID: 39433871 - Circulating tumor cells in pancreatic cancer: more than liquid biopsy.
Li Z, Qin C, Zhao B, Li T, Zhao Y, Zhang X, Wang W. Li Z, et al. Ther Adv Med Oncol. 2024 Oct 9;16:17588359241284935. doi: 10.1177/17588359241284935. eCollection 2024. Ther Adv Med Oncol. 2024. PMID: 39421679 Free PMC article. Review. - Direct visualization of emergent metastatic features within an ex vivo model of the tumor microenvironment.
Anandi L, Garcia J, Ros M, Janská L, Liu J, Carmona-Fontaine C. Anandi L, et al. Life Sci Alliance. 2024 Oct 17;8(1):e202403053. doi: 10.26508/lsa.202403053. Print 2025 Jan. Life Sci Alliance. 2024. PMID: 39419548 Free PMC article. - Improving the Prognostic and Predictive Value of Circulating Tumor Cell Enumeration: Is Longitudinal Monitoring the Answer?
Fabisiewicz A, Szostakowska-Rodzos M, Grzybowska EA. Fabisiewicz A, et al. Int J Mol Sci. 2024 Oct 2;25(19):10612. doi: 10.3390/ijms251910612. Int J Mol Sci. 2024. PMID: 39408942 Free PMC article. Review.
References
- Alford D, Taylor-Papadimitriou J. Cell adhesion molecules in the normal and cancerous mammary gland. Journal of mammary gland biology and neoplasia. 1996;1:207–218. - PubMed
- Alix-Panabieres C, Pantel K. Circulating tumor cells: liquid biopsy of cancer. Clinical chemistry. 2013;59:110–118. - PubMed
- Baccelli I, Schneeweiss A, Riethdorf S, Stenzinger A, Schillert A, Vogel V, Klein C, Saini M, Bauerle T, Wallwiener M, et al. Identification of a population of blood circulating tumor cells from breast cancer patients that initiates metastasis in a xenograft assay. Nature biotechnology. 2013;31:539–544. - PubMed
Publication types
MeSH terms
Substances
Grants and funding
- P50 CA086355-12/CA/NCI NIH HHS/United States
- R01 CA129933/CA/NCI NIH HHS/United States
- EB008047/EB/NIBIB NIH HHS/United States
- P41 E8015903-02S1/PHS HHS/United States
- K12 CA087723/CA/NCI NIH HHS/United States
- HHMI/Howard Hughes Medical Institute/United States
- U01 EB012493/EB/NIBIB NIH HHS/United States
- R01 EB008047/EB/NIBIB NIH HHS/United States
- P50 CA086355/CA/NCI NIH HHS/United States
LinkOut - more resources
Full Text Sources
Other Literature Sources
Medical


