MIF Receptor CD74 is Restricted to Microglia/Macrophages, Associated with a M1-Polarized Immune Milieu and Prolonged Patient Survival in Gliomas - PubMed (original) (raw)
. 2015 Jul;25(4):491-504.
doi: 10.1111/bpa.12194. Epub 2014 Nov 20.
Corinna Preusse 2, Anna-Eva Blank 1, Cornelia Zachskorn 1 3 4, Peter Baumgarten 1 5, Lixi Caspary 1, Anne K Braczynski 1, Jakob Weissenberger 6, Hansjürgen Bratzke 7, Sandy Reiß 8, Sandra Pennartz 8, Ria Winkelmann 9, Christian Senft 6 5 3, Karl H Plate 1 3 4, Jörg Wischhusen [ 10](#full-view-affiliation-10 "Junior Research Group "Tumour Progression and Immune Escape", Interdisciplinary Center for Clinical Research, Department for Obstetrics and Gynecology, University of Würzburg, Würzburg, Germany."), Werner Stenzel 2, Patrick N Harter 1 3 4, Michel Mittelbronn 1 3 4
Affiliations
- PMID: 25175718
- PMCID: PMC8029437
- DOI: 10.1111/bpa.12194
MIF Receptor CD74 is Restricted to Microglia/Macrophages, Associated with a M1-Polarized Immune Milieu and Prolonged Patient Survival in Gliomas
Pia S Zeiner et al. Brain Pathol. 2015 Jul.
Abstract
The macrophage migration inhibitory factor (MIF) receptor CD74 is overexpressed in various neoplasms, mainly in hematologic tumors, and currently investigated in clinical studies. CD74 is quickly internalized and recycles after antibody binding, therefore it constitutes an attractive target for antibody-based treatment strategies. CD74 has been further described as one of the most up-regulated molecules in human glioblastomas. To assess the potential relevance for anti-CD74 treatment, we determined the cellular source and clinicopathologic relevance of CD74 expression in human gliomas by immunohistochemistry, immunofluorescence, immunoblotting, cell sorting analysis and quantitative polymerase chain reaction (qPCR). Furthermore, we fractionated glioblastoma cells and glioma-associated microglia/macrophages (GAMs) from primary tumors and compared CD74 expression in cellular fractions with whole tumor lysates. Our results show that CD74 is restricted to GAMs in vivo, while being absent in tumor cells, the latter strongly expressing its ligand MIF. Most interestingly, a higher amount of CD74-positive GAMs was associated with beneficial patient survival constituting an independent prognostic parameter and with an anti-tumoral M1 polarization. In summary, CD74 expression in human gliomas is restricted to GAMs and positively associated with patient survival. In conclusion, CD74 represents a positive prognostic marker most probably because of its association with an M1-polarized immune milieu in high-grade gliomas.
Keywords: CD74; MIF; glioma; immune polarization.
© 2014 International Society of Neuropathology.
Conflict of interest statement
The authors declare that they have no conflict of interest.
Figures
Figure 1
CD
74
mRNA
levels increase with the grade of malignancy in human glioma tissue. The
R
epository of
M
olecular
B
rain
N
eoplasia
D
ata (
REMBRANDT
) data analysis of the
CD
74 gene expression (median expression × 103) in 454 gliomas [
REMBRANDT N
ational
I
nstitutes of
H
ealth (
NIH
) 2011;
https://caintegrator.nci.nih.gov/rembrandt/
]. Three different probesets were studied: 1567627_at (red; on chromosome 5 at 149.762876 Mb on the plus strand); 1567628_at (blue; on chromosome 5 at 149.762876 on the minus strand); 209619_at (green; on chromosome at 149.761492 Mb on the minus strand).
Figure 2
CD
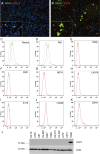
74 expression is absent in human malignant glioma cell lines. In double‐immunofluorescence (
IF
) staining
CD
74 (
A
lexa 568, red) was absent in all tested glioma cell lines (not shown), only glial fiber acid protein (
GFAP
) (
A
lexa 488, green) was positive in (A)
U
251 and (B)
U
373 (original magnification ×10 in A and B; images taken with the
E
clipse 80
i
fluorescent microscope). While human lymphoma cell lines
R
amos (C) and
R
aji (D) exhibited
CD
74 expression on the cell surface thereby serving as positive controls, glioma cell lines (E–K) did not show
CD
74 expression. The
CD
74 immunoblot from glioma cell lysates and human tonsil as positive control showed a complete absence of
CD
74 protein in glioma cell lines (L).
Figure 3
CD
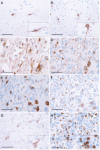
74 is strongly expressed in normal and neoplastic central nervous system (
CNS
) tissue in vivo. Representative immunhistochemical stainings showing
CD
74 expression on a distinct cellular subset in (A) normal‐appearing grey matter (n = 44), (B) normal‐appearing white matter (n = 16) and astrocytomas of (C)
W
orld
H
ealth
O
rganization (
WHO
) grade
I
(n = 47), (D)
WHO
grade
II
(n = 16), (E)
WHO
grade
III
(n = 35) as well as (F) glioblastoma,
WHO
grade
IV
(n = 252). Histomorphologic characteristics of
CD
74‐positive cells were also analyzed with regard to the microlocalisation such as (F)
GBM
tumor centers (n = 252), (G)
GBM
infiltration zones (n = 37) or (H) in
GBM
recurrence (n = 114). While in tumor centers of both primary (F) and recurrent (H)
GBMs CD
74 expression was detected on the surface of mostly rounded to ovoid cells,
CD
74 expression in normal
CNS
tissue (A, B) and
GBM
infiltration zones (G) was mainly observed on elongated cellular protrusions. (scale bars = 50 μm; inserts = higher magnification).
Figure 4
CD
74 expression is differentially regulated in astrocytic tumors and normal central nervous system (
CNS
) tissues.
B
ox and
W
hisker plots for
CD
74‐positive cells (in %) in astrocytomas
I
–
IV
,
GBM
infiltration zones as well as normal‐appearing
CNS
tissues are depicted. The relative amount of
CD
74‐positive cells in pilocytic astrocytoma,
W
orld
H
ealth
O
rganization (
WHO
) grade
I
(n = 47); diffuse astrocytoma
WHO
grade
II
(n = 16); anaplastic astrocytoma
WHO
grade
III
(n = 35); glioblastoma
WHO
grade
IV
(n = 252),
GBM
infiltration zone (n = 37), normal‐appearing white matter of
GBM
samples (
NAWM
; n = 16) as well as normal‐appearing grey matter of
GBM
samples (
NAGM
; n = 44) was statistically assessed using the nonparametric
W
ilcoxon's test. A significance level of alpha = 0.05 was chosen for all testings. For adjustment of the _P_‐values because of multiple testing we used the method of
B
onferroni–
H
olm. Statistical analysis was performed using
JMP
8.0.1 software (
SAS
).
Figure 5
CD
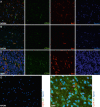
74 expression in vivo is restricted to microglia cells in normal central nervous system (
CNS
) tissues as well as glioma‐associated microglia/macrophages (
GAMs
) in gliomas. Representative double‐immunofluorescence (
IF
) stainings of
CD
74 (
A
lexa 488, green) and the microglia/macrophage marker Iba1 (
A
lexa 568, red) show a colocalization in (A) normal white (n = 4), (B) grey matter (n = 4) and (C) glioblastoma World Health Organization (
WHO
) grade
IV
(n = 15) samples (images A–C were taken with the
C
1 confocal microscope). No colocalization of the ligand migration inhibitory factor (
MIF
) (
A
lexa 488, green) and its receptor
CD
74 (
A
lexa 568, red) was seen in (D) normal brain or (E) glioblastoma
WHO
grade
IV
samples (images D–E were taken with the
E
clipse 80
i
fluorescent microscope; original magnification A–D: 20×; E: 40×). In addition, pilocytic astrocytoma
WHO
grade
I
(n = 2) as well as
WHO
grade
II
(n = 2) and
III
(n = 2) astrocytomas were assessed revealing similar staining results (data not shown).
Figure 6
CD
74
mRNA
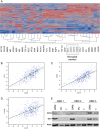
and protein levels correlate with the content of glioma‐associated microglia/macrophages (
GAMs
). Hierarchical cluster analyses (A) of gene expression signatures of selected key factors of immune cells, glioblastoma cells as well as glioblastoma micromilieu of 424 primary glioblastomas and 11 normal brain samples deriving from the cancer genome atlas (
TCGA
) data portal using the
A
gilent 244
K G
4502
A
microarray to determine
mRNA
profiles. Hierarchical clustering of this data was performed using the
W
ard's minimum variance method. Dark red color indicates a perfect positive correlation (+1) gradually decreasing to a perfect negative correlation (−1) indicated in blue. Correlation analyses of the same data subset comparing
CD
74 with either (B) Iba1 (
AIF
1), (C)
CD
68 or (D) CD11
b
(
ITGAM
) are depicted.
CD
74 and Iba1 immunoblotting (E) of
GAMs
, glioblastoma cells (
PC
) and whole glioblastoma tissue (
T
) of three different patients with primary glioblastoma
W
orld
H
ealth
O
rganization (
WHO
) grade
IV
showing a positive correlation of
CD
74 and Iba1 protein expression. Actin served as positive control.
Figure 7
The migration inhibitory factor (
MIF
)‐
CD
74 system is associated with a distinct
M
1‐polarized, phagocytic glioma‐associated microglia/macrophage (
GAM
)‐phenotype in glioblastomas. Light microscopy of unstimulated
GAMs
(A) or
GAMs
after stimulation with (B) recombinant human
MIF
(
rhMIF
) 10 ng/mL, (C) human recombinant macrophage colony stimulating factor (
rhM
‐
CSF
) 10 ng/mL, (D)
rhMIF
10 ng/mL and
rhM
‐
CSF
10 ng/mL, (E)
rhMIF
10 ng/mL and neutralizing anti‐
CD
74 antibody (
GAM
in A–E were derived from glioblastoma
W
orld
H
ealth
O
rganization (
WHO
) grade
IV
). (
F
) Differential mRNA expression for classical M1/M2 molecules as assessed by quantitative polymerase chain reaction (
qPCR
) [using
T
aq
M
an
F
ast
U
niversal
PCR M
aster
M
ix, the target assay (
A
pplied
B
iosystems) and 20 ng of complementary DNA (
cDNA
) ] did not reveal any considerable differences between the stimulation of
GAMs
with
MIF
and an anti‐
CD
74 approach as compared with the
IgG
1 isotype (at the same concentration as anti‐
CD
74 antibody) or negative (bovine serum albumin at 10 ng/mL also serving as diluent for
rhMIF
) control. (G) Analyses of the cancer genome atlas (
TCGA
) data using the
R
2 platform revealed a distinct, mainly
M
1‐based profile with additional phagocytic or adhesion molecules (correlation with
CD
74 expression is given in descending order).
Figure 8
The amount of
CD
74‐positive glioma‐associated microglia/macrophages (
GAMs
) is an independent prognostic marker for patient survival in
GBM
.
K
aplan–
M
eier survival curves of
GBM
patients were obtained by performing median split for
CD
74 (high expression > 15%
CD
74‐positive
GAMs
; low expression ≤ 15%
CD
74‐positive
GAMs
) levels. Curves were compared by both log–rank (P = 0.0018) and
W
ilcoxon (P = 0.0066) tests. Multivariate analysis was performed using the
C
ox proportional hazard model controlling for
CD
74‐positive
GAMs
(positive cells/all cells),
Ki
67 proliferation rate,
CD
68‐positive
GAMs
, sex and patient age.
Similar articles
- Distribution and prognostic impact of microglia/macrophage subpopulations in gliomas.
Zeiner PS, Preusse C, Golebiewska A, Zinke J, Iriondo A, Muller A, Kaoma T, Filipski K, Müller-Eschner M, Bernatz S, Blank AE, Baumgarten P, Ilina E, Grote A, Hansmann ML, Verhoff MA, Franz K, Feuerhake F, Steinbach JP, Wischhusen J, Stenzel W, Niclou SP, Harter PN, Mittelbronn M. Zeiner PS, et al. Brain Pathol. 2019 Jul;29(4):513-529. doi: 10.1111/bpa.12690. Epub 2019 Jan 15. Brain Pathol. 2019. PMID: 30506802 Free PMC article. - Blocking the MIF-CD74 axis augments radiotherapy efficacy for brain metastasis in NSCLC via synergistically promoting microglia M1 polarization.
Liu L, Wang J, Wang Y, Chen L, Peng L, Bin Y, Ding P, Zhang R, Tong F, Dong X. Liu L, et al. J Exp Clin Cancer Res. 2024 Apr 29;43(1):128. doi: 10.1186/s13046-024-03024-9. J Exp Clin Cancer Res. 2024. PMID: 38685050 Free PMC article. - Expression and prognostic value of JAM-A in gliomas.
Rosager AM, Sørensen MD, Dahlrot RH, Boldt HB, Hansen S, Lathia JD, Kristensen BW. Rosager AM, et al. J Neurooncol. 2017 Oct;135(1):107-117. doi: 10.1007/s11060-017-2555-0. Epub 2017 Jul 4. J Neurooncol. 2017. PMID: 28677106 Free PMC article. - The controversial role of microglia in malignant gliomas.
Wei J, Gabrusiewicz K, Heimberger A. Wei J, et al. Clin Dev Immunol. 2013;2013:285246. doi: 10.1155/2013/285246. Epub 2013 Jul 24. Clin Dev Immunol. 2013. PMID: 23983766 Free PMC article. Review. - Origin, activation, and targeted therapy of glioma-associated macrophages.
Xu C, Xiao M, Li X, Xin L, Song J, Zhan Q, Wang C, Zhang Q, Yuan X, Tan Y, Fang C. Xu C, et al. Front Immunol. 2022 Oct 6;13:974996. doi: 10.3389/fimmu.2022.974996. eCollection 2022. Front Immunol. 2022. PMID: 36275720 Free PMC article. Review.
Cited by
- Remote Neuroinflammation in Newly Diagnosed Glioblastoma Correlates with Unfavorable Clinical Outcome.
Bartos LM, Quach S, Zenatti V, Kirchleitner SV, Blobner J, Wind-Mark K, Kolabas ZI, Ulukaya S, Holzgreve A, Ruf VC, Kunze LH, Kunte ST, Hoermann L, Härtel M, Park HE, Groß M, Franzmeier N, Zatcepin A, Zounek A, Kaiser L, Riemenschneider MJ, Perneczky R, Rauchmann BS, Stöcklein S, Ziegler S, Herms J, Ertürk A, Tonn JC, Thon N, von Baumgarten L, Prestel M, Tahirovic S, Albert NL, Brendel M. Bartos LM, et al. Clin Cancer Res. 2024 Oct 15;30(20):4618-4634. doi: 10.1158/1078-0432.CCR-24-1563. Clin Cancer Res. 2024. PMID: 39150564 Free PMC article. - Glioma-Associated Microglia Characterization in the Glioblastoma Microenvironment through a 'Seed-and Soil' Approach: A Systematic Review.
Menna G, Mattogno PP, Donzelli CM, Lisi L, Olivi A, Della Pepa GM. Menna G, et al. Brain Sci. 2022 May 31;12(6):718. doi: 10.3390/brainsci12060718. Brain Sci. 2022. PMID: 35741603 Free PMC article. Review. - Distribution and prognostic impact of microglia/macrophage subpopulations in gliomas.
Zeiner PS, Preusse C, Golebiewska A, Zinke J, Iriondo A, Muller A, Kaoma T, Filipski K, Müller-Eschner M, Bernatz S, Blank AE, Baumgarten P, Ilina E, Grote A, Hansmann ML, Verhoff MA, Franz K, Feuerhake F, Steinbach JP, Wischhusen J, Stenzel W, Niclou SP, Harter PN, Mittelbronn M. Zeiner PS, et al. Brain Pathol. 2019 Jul;29(4):513-529. doi: 10.1111/bpa.12690. Epub 2019 Jan 15. Brain Pathol. 2019. PMID: 30506802 Free PMC article. - Applying causal discovery to single-cell analyses using CausalCell.
Wen Y, Huang J, Guo S, Elyahu Y, Monsonego A, Zhang H, Ding Y, Zhu H. Wen Y, et al. Elife. 2023 May 2;12:e81464. doi: 10.7554/eLife.81464. Elife. 2023. PMID: 37129360 Free PMC article. - Microglia-Centered Combinatorial Strategies Against Glioblastoma.
Martins TA, Schmassmann P, Shekarian T, Boulay JL, Ritz MF, Zanganeh S, Vom Berg J, Hutter G. Martins TA, et al. Front Immunol. 2020 Sep 29;11:571951. doi: 10.3389/fimmu.2020.571951. eCollection 2020. Front Immunol. 2020. PMID: 33117364 Free PMC article. Review.
References
- Al Abed Y, Dabideen D, Aljabari B, Valster A, Messmer D, Ochani M et al (2005) ISO‐1 binding to the tautomerase active site of MIF inhibits its pro‐inflammatory activity and increases survival in severe sepsis. J Biol Chem 280:36541–36544. - PubMed
- An JH, Lee SY, Jeon JY, Cho KG, Kim SU, Lee MA (2009) Identification of gliotropic factors that induce human stem cell migration to malignant tumor. J Proteome Res 8:2873–2881. - PubMed
- Apte RS, Sinha D, Mayhew E, Wistow GJ, Niederkorn JY (1998) Cutting edge: role of macrophage migration inhibitory factor in inhibiting NK cell activity and preserving immune privilege. J Immunol 160:5693–5696. - PubMed
- Bacher M, Schrader J, Thompson N, Kuschela K, Gemsa D, Waeber G, Schlegel J (2003) Up‐regulation of macrophage migration inhibitory factor gene and protein expression in glial tumour cells during hypoxic and hypoglycemic stress indicates a critical role for angiogenesis in glioblastoma multiforme. Am J Pathol 162:11–17. - PMC - PubMed
- Baron N, Deuster O, Noelker C, Stüer C, Strik H, Schaller C et al (2011) Role of macrophage migration inhibitory factor in primary glioblastoma multiforme cells. J Neurosci Res 89:711–717. - PubMed
MeSH terms
Substances
LinkOut - more resources
Full Text Sources
Other Literature Sources
Medical
Miscellaneous


