Genetic evidence for the role of plasmacytoid dendritic cells in systemic lupus erythematosus - PubMed (original) (raw)
Genetic evidence for the role of plasmacytoid dendritic cells in systemic lupus erythematosus
Vanja Sisirak et al. J Exp Med. 2014.
Abstract
Systemic lupus erythematosus (SLE) is an autoimmune disorder characterized by the production of antibodies to self-nucleic acids, immune complex deposition, and tissue inflammation such as glomerulonephritis. Innate recognition of self-DNA and -RNA and the ensuing production of cytokines such as type I interferons (IFNs) contribute to SLE development. Plasmacytoid dendritic cells (pDCs) have been proposed as a source of pathogenic IFN in SLE; however, their net contribution to the disease remains unclear. We addressed this question by reducing gene dosage of the pDC-specific transcription factor E2-2 (Tcf4), which causes a specific impairment of pDC function in otherwise normal animals. We report that global or DC-specific Tcf4 haplodeficiency ameliorated SLE-like disease caused by the overexpression of the endosomal RNA sensor Tlr7. Furthermore, Tcf4 haplodeficiency in the B6.Sle1.Sle3 multigenic model of SLE nearly abolished key disease manifestations including anti-DNA antibody production and glomerulonephritis. Tcf4-haplodeficient SLE-prone animals showed a reduction of the spontaneous germinal center reaction and its associated gene expression signature. These results provide genetic evidence that pDCs are critically involved in SLE pathogenesis and autoantibody production, confirming their potential utility as therapeutic targets in the disease.
© 2014 Sisirak et al.
Figures
Figure 1.
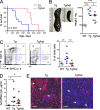
Tcf4 haplodeficiency ameliorates SLE-like disease in Tlr7 transgenic mice. Tlr7.Tg males, haplodeficient for Tcf4 (Tg/het) or their _Tcf4_-sufficient littermates (Tg), were analyzed. (A) Kaplan-Meier survival plot (n = 7–10). Significance was determined by log-rank test. (B) Splenic size (left) and splenic weights were determined for individual 50-wk-old transgenic animals and WT controls (right). (C) Peripheral blood cells from the indicated mice were analyzed by flow cytometry (left); thresholds of positive staining and percentages of cells within the resulting quadrants are indicated. The frequencies of the CD11c+ MHC cl. II− population (top left quadrant) in individual 30-wk-old animals were determined (right). Data were pooled from 3 independent experiments. (D) Anti-RNA IgG levels in the sera of 30–40-wk-old animals were determined by ELISA. Data were pooled from 3 independent experiments. (E) Kidney cryosections of 50–60-wk-old animals were stained for IgG (red) and DNA (blue) and analyzed by fluorescence microscopy (bars, 100 µm). Arrows show kidney glomeruli. Shown is a representative of 5 animals in each group from 2 independent experiments. Horizontal bars indicate mean. *, P ≤ 0.05; **, P ≤ 0.01; ***, P ≤ 0.001.
Figure 2.
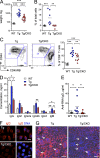
DC-specific Tcf4 haplodeficiency ameliorates disease in Tlr7 transgenic mice. Tlr7.Tg _Tcf4_flox/+ _Itgax_-Cre− males (Tg) or their _Itgax_-Cre+ littermates with DC-specific Tcf4 CKO (Tg/CKO) were analyzed along with WT controls. (A) Splenic weights were determined in individual 60-wk-old animals. (B) Frequencies of CD11c+ MHC cl. II− myeloid cells in the peripheral blood of 30–40-wk-old animals were determined by flow cytometry. Data were pooled from 3 independent experiments. (C) Peripheral blood cells from the indicated 30–40-wk-old mice were analyzed by flow cytometry, gated on CD4+ T cells, and the frequencies of activated CD44+ CD45RB− cells among CD4+ T cells were determined. Data were pooled from 4 independent experiments. (D) Levels of total IgM, IgG, and IgG subclasses in the sera of 30–40-wk-old animals were determined by ELISA (mean ± SD of 5 animals per group pooled from 2 independent experiments). (E) Anti-RNA IgG levels in the sera of 30–40-wk-old animals were determined by ELISA. Data were pooled from 3 independent experiments. (F) Fixed HEp-2 cells were incubated with sera from Tg mice, stained for IgG (red) alone or with DNA (blue), and analyzed by fluorescence microscopy (bars, 20 µm). Images are representative of 2 independent staining experiments. (G) Kidney cryosections of 60-wk-old animals were stained for IgG (red) and DNA (blue) and analyzed by fluorescence microscopy (bars, 100 µm). Arrows show kidney glomeruli. Images are representative of 6 animals in each group from 2 independent experiments. Horizontal bars indicate mean. *, P ≤ 0.05; **, P ≤ 0.01; ***, P ≤ 0.001.
Figure 3.
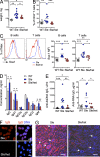
Tcf4 haplodeficiency ameliorates immune activation in B6_.Sle1.Sle3_ mice. 30-wk-old B6_.Sle1.Sle3_ mice (Sle) or their Tcf4 haplodeficient littermates (Sle/het) were analyzed along with WT controls. (A) Splenic weights were determined in individual indicated animals. (B) Peripheral blood cells from the indicated mice were analyzed by flow cytometry, gated on CD4+ T cells, and the frequencies of activated CD44+ CD45RB− cells among CD4+ T cells were determined. Data were pooled from 3 independent experiments. (C) Sca-1 expression on gated B and T cells (left) and mean fluorescent intensities (MFIs) of Sca-1 on these cells from individual mice was determined by flow cytometry. Data were pooled from 3 independent experiments (right). (D and E) Levels of total IgM, IgG, and IgG subclasses (mean ± SD; D), anti-dsDNA, and anti-RNA IgG (E) in the sera of indicated experimental groups were measured by ELISA. Data were pooled from 2 independent experiments. (F) Fixed Hep2 cells were incubated with sera from Sle mice, stained for IgG (red) alone or with DNA (blue), and analyzed by fluorescence microscopy (bars, 20 µm). Images are representative of 2 independent staining experiments. (G) Kidney cryosections were stained for IgG (red) and DNA (blue) and analyzed by florescence microscopy (bars, 100 µm). Arrows show kidney glomeruli. Images are representative of 9 animals in each group from 3 independent experiments. Horizontal bars indicate mean. *, P ≤ 0.05; **, P ≤ 0.01; ***, P ≤ 0.001.
Figure 4.
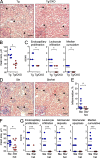
Tcf4 haplodeficiency ameliorates kidney disease in SLE-prone mice. (A) Kidney paraffin sections from Tlr7.Tg animals with or without DC-specific Tcf4 CKO (Tg/CKO) were stained with H&E and analyzed by microscopy (bars, 100 µm). Arrows show kidney glomeruli, with a representative glomerulus on the inset. Images are representative of 6 animals in each group from 2 independent experiments. (B) Mean diameter of kidney glomeruli was determined in individual 60-wk-old Tlr7.Tg animals. (C) Histopathological score of indicated disease parameters in the kidneys from individual Tlr7.Tg animals were determined using microscopy. (D) Kidney paraffin sections from B6_.Sle1.Sle3_ mice with (Sle/het) or without (Sle) Tcf4 haplodeficiency were stained with H&E and analyzed by microscopy (bars, 100 µm). Arrows show kidney glomeruli, with a representative glomerulus on the inset. Images are representative of 9 animals in each group from 2 independent experiments. (E–G) Percentage of parenchyma with interstitial inflammation in the kidneys (E), mean diameter of kidney glomeruli (F), and histopathological scores of indicated disease parameters (G) were determined in individual B6_.Sle1.Sle3_ animals. Horizontal bars indicate mean. *, P ≤ 0.05; **, P ≤ 0.01; ***, P ≤ 0.001.
Figure 5.
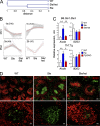
Tcf4 haplodeficiency reduces GC signature in SLE-prone mice. (A and B) Total splenocytes from individual 30-wk-old WT (n = 2), B6_.Sle1.Sle3_ (Sle, n = 3), or B6_.Sle1.Sle3 Tcf4_+/− (Sle/het, n = 3) mice were analyzed by expression microarrays. (A) Unsupervised hierarchical clustering of the total expression profiles of each sample group. (B) Unsupervised PCA-based clustering of genes whose expression was significantly changed between groups. Shown are clusters of genes with common pattern of differential expression according to the two principal components (PC1 and PC2). No additional clusters or principal components were identified in the PCA. Data represent expression trajectories of individual genes (gray) and a mean trajectory (red) across sample groups; the number of genes in each cluster is indicated. (C) The expression of Aicda was analyzed in total splenocytes from B6_.Sle1.Sle3_ mice without (Sle) or with (Sle/het) Tcf4 haplodeficiency (top), or from Tlr7.Tg animals without (Tg) or with (Tg/CKO) DC-specific Tcf4 CKO (bottom). The expression of the IFN-inducible gene Ifi203 is shown as a control. Data represent relative expression in each sample group as determined by qRT-PCR (mean ± SD of 5 and 3 animals per group for Sle and Tg samples, respectively). *, P ≤ 0.05; **, P ≤ 0.01. (D) Spleen sections from WT, B6_.Sle1.Sle3_ (Sle), or B6_.Sle1.Sle3 Tcf4_+/− (Sle/het) mice were stained for total B cells (B220, red) and GC B cells (PNA, green). Shown is overall splenic architecture (top row: bars 100 µm) and representative GCs (bottom row: bars 20 µm). Representative of 3 spleens per genotype.
Comment in
- Connective tissue diseases: depleting plasmacytoid dendritic cells: a new therapeutic approach in SLE?
Onuora S. Onuora S. Nat Rev Rheumatol. 2014 Oct;10(10):573. doi: 10.1038/nrrheum.2014.160. Epub 2014 Sep 16. Nat Rev Rheumatol. 2014. PMID: 25224304 No abstract available.
Similar articles
- B cell autophagy mediates TLR7-dependent autoimmunity and inflammation.
Weindel CG, Richey LJ, Bolland S, Mehta AJ, Kearney JF, Huber BT. Weindel CG, et al. Autophagy. 2015;11(7):1010-24. doi: 10.1080/15548627.2015.1052206. Autophagy. 2015. PMID: 26120731 Free PMC article. - Neutrophil Extracellular Trap Mitochondrial DNA and Its Autoantibody in Systemic Lupus Erythematosus and a Proof-of-Concept Trial of Metformin.
Wang H, Li T, Chen S, Gu Y, Ye S. Wang H, et al. Arthritis Rheumatol. 2015 Dec;67(12):3190-200. doi: 10.1002/art.39296. Arthritis Rheumatol. 2015. PMID: 26245802 Clinical Trial. - Heat shock protein 90 associates with Toll-like receptors 7/9 and mediates self-nucleic acid recognition in SLE.
Saito K, Kukita K, Kutomi G, Okuya K, Asanuma H, Tabeya T, Naishiro Y, Yamamoto M, Takahashi H, Torigoe T, Nakai A, Shinomura Y, Hirata K, Sato N, Tamura Y. Saito K, et al. Eur J Immunol. 2015 Jul;45(7):2028-41. doi: 10.1002/eji.201445293. Epub 2015 Apr 28. Eur J Immunol. 2015. PMID: 25871979 - Sequential activation of conventional and plasmacytoid dendritic cells in autoimmune pancreatitis and systemic lupus erythematosus: similarities and dissimilarities.
Hara A, Watanabe T, Minaga K, Kamata K, Strober W, Kudo M. Hara A, et al. Front Immunol. 2025 Feb 18;16:1554492. doi: 10.3389/fimmu.2025.1554492. eCollection 2025. Front Immunol. 2025. PMID: 40040712 Free PMC article. Review. - Female predisposition to TLR7-driven autoimmunity: gene dosage and the escape from X chromosome inactivation.
Souyris M, Mejía JE, Chaumeil J, Guéry JC. Souyris M, et al. Semin Immunopathol. 2019 Mar;41(2):153-164. doi: 10.1007/s00281-018-0712-y. Epub 2018 Oct 1. Semin Immunopathol. 2019. PMID: 30276444 Review.
Cited by
- Type 1 Interferons Induce Changes in Core Metabolism that Are Critical for Immune Function.
Wu D, Sanin DE, Everts B, Chen Q, Qiu J, Buck MD, Patterson A, Smith AM, Chang CH, Liu Z, Artyomov MN, Pearce EL, Cella M, Pearce EJ. Wu D, et al. Immunity. 2016 Jun 21;44(6):1325-36. doi: 10.1016/j.immuni.2016.06.006. Immunity. 2016. PMID: 27332732 Free PMC article. - Protein Tyrosine Phosphatase PTPRS Is an Inhibitory Receptor on Human and Murine Plasmacytoid Dendritic Cells.
Bunin A, Sisirak V, Ghosh HS, Grajkowska LT, Hou ZE, Miron M, Yang C, Ceribelli M, Uetani N, Chaperot L, Plumas J, Hendriks W, Tremblay ML, Häcker H, Staudt LM, Green PH, Bhagat G, Reizis B. Bunin A, et al. Immunity. 2015 Aug 18;43(2):277-88. doi: 10.1016/j.immuni.2015.07.009. Epub 2015 Jul 28. Immunity. 2015. PMID: 26231120 Free PMC article. - Utilizing type I interferon expression in the identification of antiphospholipid syndrome subsets.
Cecchi I, Radin M, Rodríguez-Carrio J, Tambralli A, Knight JS, Sciascia S. Cecchi I, et al. Expert Rev Clin Immunol. 2021 Apr;17(4):395-406. doi: 10.1080/1744666X.2021.1901581. Epub 2021 Mar 30. Expert Rev Clin Immunol. 2021. PMID: 33686921 Free PMC article. Review. - Cyclical palmitoylation regulates TLR9 signalling and systemic autoimmunity in mice.
Ni H, Wang Y, Yao K, Wang L, Huang J, Xiao Y, Chen H, Liu B, Yang CY, Zhao J. Ni H, et al. Nat Commun. 2024 Jan 2;15(1):1. doi: 10.1038/s41467-023-43650-z. Nat Commun. 2024. PMID: 38169466 Free PMC article. - A pathogenic role of plasmacytoid dendritic cells in autoimmunity and chronic viral infection.
Barrat FJ, Su L. Barrat FJ, et al. J Exp Med. 2019 Sep 2;216(9):1974-1985. doi: 10.1084/jem.20181359. Epub 2019 Aug 16. J Exp Med. 2019. PMID: 31420375 Free PMC article. Review.
References
- Agrawal, H., Jacob N., Carreras E., Bajana S., Putterman C., Turner S., Neas B., Mathian A., Koss M.N., Stohl W., et al. . 2009. Deficiency of type I IFN receptor in lupus-prone New Zealand mixed 2328 mice decreases dendritic cell numbers and activation and protects from disease. J. Immunol. 183:6021–6029 10.4049/jimmunol.0803872 - DOI - PMC - PubMed
- Baccala, R., Gonzalez-Quintial R., Blasius A.L., Rimann I., Ozato K., Kono D.H., Beutler B., and Theofilopoulos A.N.. 2013. Essential requirement for IRF8 and SLC15A4 implicates plasmacytoid dendritic cells in the pathogenesis of lupus. Proc. Natl. Acad. Sci. USA. 110:2940–2945 10.1073/pnas.1222798110 - DOI - PMC - PubMed
- Baechler, E.C., Batliwalla F.M., Karypis G., Gaffney P.M., Ortmann W.A., Espe K.J., Shark K.B., Grande W.J., Hughes K.M., Kapur V., et al. . 2003. Interferon-inducible gene expression signature in peripheral blood cells of patients with severe lupus. Proc. Natl. Acad. Sci. USA. 100:2610–2615 10.1073/pnas.0337679100 - DOI - PMC - PubMed
- Bar-On, L., Birnberg T., Lewis K.L., Edelson B.T., Bruder D., Hildner K., Buer J., Murphy K.M., Reizis B., and Jung S.. 2010. CX3CR1+ CD8α+ dendritic cells are a steady-state population related to plasmacytoid dendritic cells. Proc. Natl. Acad. Sci. USA. 107:14745–14750 10.1073/pnas.1001562107 - DOI - PMC - PubMed
- Båve, U., Magnusson M., Eloranta M.L., Perers A., Alm G.V., and Rönnblom L.. 2003. FcγRIIa is expressed on natural IFN-α-producing cells (plasmacytoid dendritic cells) and is required for the IFN-α production induced by apoptotic cells combined with lupus IgG. J. Immunol. 171:3296–3302 10.4049/jimmunol.171.6.3296 - DOI - PubMed
Publication types
MeSH terms
Substances
LinkOut - more resources
Full Text Sources
Other Literature Sources
Medical
Molecular Biology Databases
