Systematic screening reveals a role for BRCA1 in the response to transcription-associated DNA damage - PubMed (original) (raw)
. 2014 Sep 1;28(17):1957-75.
doi: 10.1101/gad.241620.114.
Thomas Rolland 2, Guillaume Adelmant 3, Xianfang Xia 2, Matthew S Owen 2, Amélie Dricot 2, Travis I Zack 4, Nidhi Sahni 2, Yves Jacob 5, Tong Hao 2, Kristine M McKinney 1, Allison P Clark 1, Deepak Reyon 6, Shengdar Q Tsai 6, J Keith Joung 6, Rameen Beroukhim 7, Jarrod A Marto 3, Marc Vidal 2, Suzanne Gaudet 2, David E Hill 2, David M Livingston 8
Affiliations
- PMID: 25184681
- PMCID: PMC4197947
- DOI: 10.1101/gad.241620.114
Systematic screening reveals a role for BRCA1 in the response to transcription-associated DNA damage
Sarah J Hill et al. Genes Dev. 2014.
Abstract
BRCA1 is a breast and ovarian tumor suppressor. Given its numerous incompletely understood functions and the possibility that more exist, we performed complementary systematic screens in search of new BRCA1 protein-interacting partners. New BRCA1 functions and/or a better understanding of existing ones were sought. Among the new interacting proteins identified, genetic interactions were detected between BRCA1 and four of the interactors: TONSL, SETX, TCEANC, and TCEA2. Genetic interactions were also detected between BRCA1 and certain interactors of TONSL, including both members of the FACT complex. From these results, a new BRCA1 function in the response to transcription-associated DNA damage was detected. Specifically, new roles for BRCA1 in the restart of transcription after UV damage and in preventing or repairing damage caused by stabilized R loops were identified. These roles are likely carried out together with some of the newly identified interactors. This new function may be important in BRCA1 tumor suppression, since the expression of several interactors, including some of the above-noted transcription proteins, is repeatedly aberrant in both breast and ovarian cancers.
Keywords: BRCA1 interaction screening; DNA damage; transcription.
© 2014 Hill et al.; Published by Cold Spring Harbor Laboratory Press.
Figures
Figure 1.
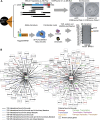
Bipartite screening effort to identify new protein-interacting partners for BRCA1 (see also Supplemental Figs. S1, S2A–H; Supplemental Tables S1–S5). (A) The Y2H and TAP-MS screening methods used are outlined here. In the Y2H screen, depicted at the top, full-length BRCA1 (p220) and fragments strategically designed to contain specific BRCA1 functional domains (shown in the map) were screened against the human ORFeome version 5.1. The two example plates shown represent full-length BRCA1 and fragment 33 screened against the same 94 members of the ORFeome. The TAP-MS operation sequence is depicted at the bottom. Nuclei were harvested from HeLa S3 cells stably expressing Flag-StrepTactin (SII)-tagged BARD1 or empty vector as a control. The nuclei were fractionated into soluble nuclear and chromatin fractions from which the complexes were tandemly immunoprecipitated. A silver-stained gel depicting a small fraction of one of the three purifications is shown at the bottom of the panel. (S) Soluble fraction; (C) chromatin fraction. (B) This network represents BARD1 and BRCA1 as the central nodes for TAP-MS associations and direct biophysical Y2H interactions, respectively, with all interactors from the screen emanating from them. The code for edge color and style as well as node color is defined in the key below the network.
Figure 2.
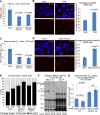
BRCA1 is required to prevent or repair DNA damage associated with transcription arrest (see also Supplemental Figs. S2I [for siRNA validation], S3A–C). (A) IC50s for DRB sensitivity in U2OS cells depleted of BRCA1 or controls. U2OS cells were transfected with either siGL2 as a control, siBRCA1 exon 13, or siBRCA1 3′ untranslated region (UTR) and tested for sensitivity to varying doses of DRB by colony formation assay. The experiment was repeated a minimum of three times for each siRNA. IC50s were estimated by fitting a nonlinear regression curve to the data from each individual experiment for each siRNA, and the bar graph shows the average of the IC50 values calculated from the replicates for each siRNA. The error bars represent the standard deviation between the IC50s from the multiple experiments. The _P_-values above the bars (calculated from a two-tailed _t_-test) indicate the significance of the difference in IC50 values between the siGL2 control and each individual BRCA1 siRNA. (B) In the left panel, representative photos are shown of U2OS cells incubated for 24 h in medium containing either 100 μM DRB or an equivalent volume of ethanol (Mock) and then stained for the classic DNA damage marker γH2AX. This experiment was repeated four times, and the percentage of cells containing five or more γH2AX foci under each condition was counted for each repetition. The bar graph in the right panel represents the average of these percentages for each treatment, and the error bars represent the standard deviation between replicates. The _P_-value indicates the significance of the difference between the vehicle and DRB treatment as demonstrated by a two-tailed _t_-test. (C) IC50s for α-amanitin sensitivity in U2OS cells depleted of BRCA1 or controls. U2OS cells were transfected with either siGL2, siBRCA1 exon 13, or siBRCA1 3′ UTR and tested for sensitivity to varying doses of α-amanitin by colony formation assay. The experiment was repeated a minimum of three times for each siRNA. IC50s were estimated by fitting a nonlinear regression curve to the data from each individual experiment for each siRNA, and the bar graph shows the average of the IC50 values calculated from the replicates for each siRNA. The error bars represent the standard deviation between the IC50s from the multiple experiments. The _P_-values (calculated by a two-tailed _t_-test) demonstrate the significance of the difference between the IC50s for each BRCA1 siRNA compared with the siGL2 control. (D) In the left panel, representative photos are shown of U2OS cells incubated for 24 h in medium containing either 10 μM α-amanitin or an equivalent volume of ddH2O and then stained for the classic DNA damage marker γH2AX. This experiment was repeated three times, and the percentage of cells containing five or more γH2AX foci under each condition was counted for each repetition. The bar graph in the right panel represents the average of these percentages for each treatment, and the error bars represent the standard deviation between replicates. The _P_-value (calculated by a two-tailed _t_-test) indicates the significance of the difference between the vehicle and α-amanitin treatment. (E) Bar graph representing the percentage of cells with two different tail length ranges (0–60 pixels represented as the gray part of the bar, and >60 pixels represented as the black part of the bar) from alkaline comet assays performed on U2OS cells transfected independently with either siGL2, siBRCA1 exon 13, or siBRCA1 3′ UTR and then cultured in medium containing either 0.35 uM α-amanitin (AA) or the equivalent amount of water (H2O) for 24 h. The bars represent the average of the percentages from a minimum of three separate experiments for each siRNA, and the error bars represent the standard deviation between these experiments. _P_-values that compare the differences in percentages of cells with tail lengths >60 were calculated using a two-tailed _t_-test. The significant _P_-values for different comparisons are as follows: siGL2-H2O versus siGL2-AA >60 pixels, P = 0.0106; siBRCA1 exon 13-H2O versus siBRCA1 exon 13-AA >60 pixels, P = 0.0165; siBRCA1 3′ UTR-H2O versus siBRCA1 3′ UTR-AA >60 pixels, P = 0.0096; siGL2-AA versus siBRCA1 exon 13-AA >60 pixels, P = 0.0005; and siGL2-AA versus siBRCA1 3′ UTR-AA >60 pixels, P = 0.0001. (F) Immunoprecipitation-Western blot of wild-type HCC38 (WT) and HCC38+BRCA1 (B1) cDNA lines transfected with siRNAs used in G (siGL2 and siBRCA1 3′ UTR [3′ UTR]). Arrows indicate various BRCA1 isoforms (p220 is full-length BRCA1 and is what we refer to as BRCA1 throughout the text; Δ11b is a shorter isoform lacking exon 11). (G) Wild-type HCC38 cells (WT) or HCC38 cells stably expressing HA-tagged BRCA1 (BRCA1 OE: overexpressed) transfected with either siGL2 or a BRCA1 siRNA targeting its 3′ UTR (3′ UTR) and tested for sensitivity to varying doses of α-amanitin by colony formation assay. The experiment was repeated three times. IC50s were estimated by fitting a nonlinear regression curve to the data from each individual experiment for each siRNA, and the bar graph shows the average of the IC50 values calculated from the replicates for each siRNA. The error bars represent the standard deviation between the IC50s from the three experiments. _P_-values were calculated using a two-tailed _t_-test for the differences observed in IC50s and are shown on the bar graph. (The brightness for every photo in B and D was increased by 40% and the contrast was increased by 20% using PowerPoint to overcome the difficulty of converting to PDF. Please note that these images are best viewed in the electronic version of the figure and not on a printed page.)
Figure 3.
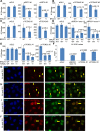
BRCA1 interacts genetically with various transcription-associated proteins, one of which has not been previously linked with transcription or transcription-associated DNA damage (see also Supplemental Figs. S2I,J,M,N,O [for siRNA validation], S3D, S4, S5). (A–C) WT/WT (WT) and BRCA1+/− (+/−) U2OS cell lines were transfected with a control (siGL2) and multiple gene-specific siRNAs to search for synthetic lethality upon codepletion of specific gene products together with BRCA1. The average number of colonies from at least three separate experiments is shown for the WT/WT and BRCA1+/− cell lines transfected with either siGL2 or two different siRNAs targeting either SETX (A), TCEANC (B), or TCEA2 (C). The error bars represent the standard deviation between the replicates of the experiment, and the _P_-values (calculated by a two-tailed _t_-test on a union of all replicates of the repetitions of the experiments) indicate the significance of the difference in colony number between heterozygous mutants and the WT/WT line for the gene-specific siRNA transfections. Due to differences in colony-forming efficiency with each siRNA, the siGL2 results can only be compared with siGL2 and so forth. (D) The average number of colonies from three separate experiments is shown for WT/WT, BRCA1+/−, and TONLS+/− U2OS cell lines transfected with either siGL2, siBRCA1 exon 13, or siBRCA1 exon 11. The plots are designed as described above. (E) The average number of colonies from three separate experiments is shown for WT/WT, BRCA1+/−, and TONLS+/− U2OS cell lines transfected with siGL2, siTONSL #1, or siTONSL #2, plotted as described above. (F) UV IC50s for U2OS cells depleted of TONSL or BRCA1 compared with controls are shown. U2OS cells were transfected with siRNAs, plated at a suitable density for colony formation, treated with varying doses of UV, and later stained and counted. The experiment was repeated four times. The IC50 was estimated by fitting a nonlinear regression curve to the data from each individual experiment for each siRNA, and the bar graph shows the average value calculated from the four replicates for each siRNA. The error bars represent the standard deviation between the four experiments. The _P_-values (calculated by a two-tailed _t_-test) indicate the significance of the difference between the siGL2 values and the three individual gene-specific siRNAs. (G,H) Representative immunofluorescence photos of U2OS cells treated with 30 J UV-C through micropores and stained for TONSL and cyclobutane pyrimidine dimers (CPDs are a marker of UV damage) (G) or TONSL and BRCA1 (H) 4 h after treatment. Yellow arrows indicate examples of cells in which there is either CPD–TONSL or BRCA1–TONSL costaining. (I,J) U2OS cells stably expressing either G1-specific Cdt1-RFP (I, red) or S-phase-specific Geminin-GFP (J, green) degrons were irradiated with 30 J through micropores and, 4 h later, stained for BRCA1 and TONSL. Normally, Geminin and Cdt1 are stably expressed in S phase and G1, respectively, and are rapidly degraded upon exit from these phases (Sakaue-Sawano et al. 2008). Tagging them or their isolated degrons with fluorescent markers has been a useful way to mark cells being studied by immunofluorescence in specific phases of the cell cycle. In this method, the fluorescent tag is only expressed in the phase of the cell cycle in which the degron is inactive (Sakaue-Sawano et al. 2008). Yellow arrows indicate phase-specific cells in which TONSL localized in UV micropores. (Please note that these images are best viewed in the electronic version of the figure and not on a printed page.)
Figure 4.
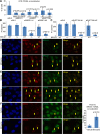
BRCA1, TONSL, and FACT interact functionally at sites of UV damage (see also Supplemental Figs. S2I,J,K,L, S4, S6). (A) The bar graph represents the average number of U2OS cells containing TONSL in CPD-positive micropores from four separate experiments in which cells were transfected with a control siRNA (siGL2) or one of two different BRCA1-, SSRP1-, or SUPT16H-specific siRNAs. After transfection, the cells were irradiated with 30 J UV and stained 4 h later for BRCA1, CPDs, and TONSL. The error bars represent the standard deviation between the counts from the four experiments. The _P_-values (calculated by a two-tailed _t_-test) demonstrate the significance of the difference between the siGL2 values and the various gene-specific siRNA values. (B,C) The average number of colonies from three separate experiments is shown for the WT/WT (WT) and BRCA1+/− (+/−) U2OS cell lines transfected with either siGL2 or two different siRNAs targeting either SSRP1 (B) or, independently, SUPT16H (C). The plots are designed as described in Figure 3. (D–F) U2OS cells were incubated in medium containing 0.5 mM mimosine or an equivalent volume of vehicle for 24 h and then irradiated with 30 J through micropores, allowed to recover for 4 h, and costained for SSRP1 and BRCA1 (D), SSRP1 and TONSL (E), and TONSL and BRCA1 (F). Arrows mark some of the cells where colocalization is observed. The BRCA1–TONSL costaining in F was repeated four times, and the number of cells in which TONSL and BRCA1 colocalized in micropores in either vehicle- or Mimosine-containing medium was counted each time. The bar graph in the right panel of F shows the average percentage of cells containing colocalizing BRCA1 and TONSL under both conditions. The bars are the averages from four experiments, and the error bars represent the standard deviation between experiments. The _P_-value (calculated using a two-tailed _t_-test) indicates the significance of the difference between vehicle- and Mimosine-treated cells. (Please note that these images are best viewed in the electronic version of the figure and not on a printed page.)
Figure 5.
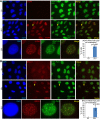
Active RNA polymerase and BRCA1 colocalize in distinct foci after UV damage (see also Supplemental Figs. S7, S8). (A,B) U2OS cells were exposed to 0 J or 25 J (whole-cell irradiation, without micropore filters), fixed with methanol–acetic acid 4 h later, and costained for either active RNA polymerase (RNA Pol II pS5) and γH2AX (A) or RNA Pol II pS5 and BRCA1 (B). One representative photo of a field of cells is shown for each staining after 0 J and 25 J of UV, and one representative cell from the 25-J photo in which there is significant colocalization between the costained proteins has been cut out and magnified using PowerPoint at the bottom of the panel. Yellow arrows point to the magnified cell in the 25-J field of cells photos. In addition, at the right of the magnified photos is a bar graph showing the average percentage of cells containing three or more colocalizing foci for the stained protein pair in that panel. A minimum of 200 cells were counted for each treatment in each experiment. The bars in each bar graph represent the average percentages from three separate experiments for each staining pair, and the error bars represent the standard deviation between experiments. The _P_-values (calculated by a two-tailed _t_-test) represent the significance of the difference between the 0-J and 25-J counts. In the bar graph in A, the 0-J value is extremely low compared with the 25-J value and is difficult to see in the bar graph. The average percent for 0 J in A was 0.49, with a standard deviation of 0.84. The 0-J value in the bar graph in B is also very low when compared with the 25-J value. The average percent for 0 J in B was 0.82, with a standard deviation of 1.03. (The brightness for every photo in the figure has been increased by 40% using PowerPoint to overcome the difficulty of converting to PDF. Please note that these images are best viewed in the electronic version of the figure and not on a printed page.)
Figure 6.
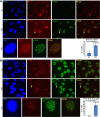
BRCA1 and TFIIS localize to sites of UV-induced transcription-associated DNA damage (see also Supplemental Figs. S7, S8). (A,B) U2OS cells were treated with 0 J or 25 J (whole-cell irradiation, without micropore filters), fixed with methanol-acetic acid 4 h later, and costained for either γH2AX and BRCA1 (A) or RNA Pol II pS5 and TFIIS (B). One representative photo of a field of cells is shown for each staining after 0-J and 25-J irradiation, and one representative cell from the 25-J photo in which there is significant colocalization between the costained proteins has been cut out and magnified using PowerPoint below the two fields. Yellow arrows point to the magnified cell in the 25-J photos. In addition, at the right of the magnified photos is a bar graph showing the average percentage of cells containing three or more colocalizing foci for the staining pair in that panel. A minimum of 200 cells was counted for each treatment in each experiment. The bars in each bar graph represent the average percentages from three separate experiments for each staining pair, and the error bars represent the standard deviation between experiments. The _P_-values (calculated by a _t_-test) represent the significance of the difference between the 0-J and 25-J counts. The 0-J value in the bar graph in B is very low and difficult to see compared with the 25-J value. The average percent for 0 J in B was 0.64, with a standard deviation of 0.73. (The brightness for each photo in the figure has been increased by 40% using PowerPoint to overcome the difficulty of converting to PDF. Please note that these images are best viewed in the electronic version of the figure and not on a printed page.)
Figure 7.
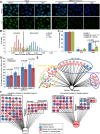
BRCA1 functions in multiple ways at sites of transcription arrest, and its transcription-associated damage repair function is relevant in breast and ovarian cancer development and progression (see also Supplemental Figs. S2I [for siRNA validation], S7I; Supplemental Table S6). (A–C) The role of BRCA1 in transcription restart following UV damage was measured and compared in control siRNA and BRCA1 siRNA (either siBRCA1 exon 13 or siBRCA1 3′ UTR) transfected U2OS cells by measuring RNA synthesis using 5-ethinyl uridine (EU) uptake over a 2-h labeling period (Dinant et al. 2013). siRNA transfected cells were exposed to an equivalent air exposure (mock) or 8 J, labeled with EU for 2 h either immediately (air sample; referred to as “mock” in the figures) or 2 or 16 h after UV treatment, fixed, and stained. Photographs were taken of the stained cells for each treatment at each time point, and at least 300 nuclei were analyzed for their mean fluorescent intensity using CellProfiler for each treatment at each time point. Representative photos of the siGL2 cells and one of the siBRCA1-treated sets of cells are shown in A at each time point. The merged Hoechst-EU staining is shown at the top, and the EU staining alone is shown at the bottom. A histogram depicting the distribution of mean nuclear EU intensities from one representative experiment for siGL2 is shown in B. The arrested cells, appearing at the left, revealed a lower EU-staining intensity than the recovered cells at the right. The black line denotes two standard deviations below the mean of the mock distribution. Irradiated cells at the right of this line are considered to have recovered to normal transcriptional levels, whereas those at the left are considered to be transcriptionally arrested (cf. siGL2-2 h and siGL2-16 h with siGL2-Mock, and siBRCA1-2 h and siBRCA1-16 h with siBRCA1-Mock). The bar graph in C shows the percentage of cells for each siRNA that has recovered based on the above calculations at a given time point. Results are the average of three experiments, and the error bars represent the standard deviation between experiments. _P_-values were calculated using a two-tailed _t_-test. (D) To test the possibility that BRCA1 is involved in preventing or repairing R-loop-associated DNA damage, U2OS cells were transfected with either siGL2 or one of three different BRCA1-specific siRNAs (targeting exon 13, exon 11, or the 3′ UTR) on days 1 and 2, transfected with either empty vector or RNASEH1 on day 3, and then fixed 24 h later. The cells were costained for γH2AX and RNASEH1. For vector+siRNA transfected cells, the number of cells containing five or more γH2AX foci was counted from the whole population, and for the RNASEH1+siRNA transfected cells, the number of RNASEH1-expressing cells containing five or more γH2AX foci was counted. A minimum of 150 cells was counted for each treatment in each experiment. This experiment was repeated five times for each siRNA, and the average percentage of cells containing five or more γH2AX foci for each siRNA with either vector or RNASEH1 expression was calculated from these five experiments and is represented by the bars in the bar graph shown here comparing the vector and RNASEH1 values for each siRNA. The error bars represent the standard deviation between the five replicates, and the _P_-values (calculated by a two-tailed _t_-test) above the paired counts represent the statistical significance of the difference between the vector and RNASEH counts for each individual siRNA. (E) A network representing overlap between genes in the BRCA1 interactome and previously reported gene expression profiling results obtained from breast and ovarian tumors. The expression of genes detected as BRCA1-interacting protein partners (BRCA1 Interactome) was queried in various gene expression profiling data sets in Oncomine Concepts Map for both breast and ovarian cancers. Each group of nodes encircled by different colors represents a molecular concept with which the BRCA1 interactome is associated, and the individual nodes represent significantly associated data sets within that particular concept with a _Q_-value ≤0.01 (the majority are overexpression data sets). The width of each edge reflects the number of overlapping genes between the BRCA1 interactome and the linked data set—the wider the edge, the greater the overlapping gene number. Node color represents the tumor type analyzed in the linked data set. (Pink) Breast; (blue) ovarian. (F) Networks representing the genes from the BRCA1 interactome that were found to be in either amplified (left panel) or deleted (right panel) regions in a statistically significant way (P < 0.05 and Q < 0.25) in a TCGA (The Cancer Genome Atlas) data set for breast cancers or ovarian cancers or across 11 different cancers. The nodes are grouped according to association with select GO terms, and the key to node color is noted below the networks.
Similar articles
- BRCA1 recruitment to transcriptional pause sites is required for R-loop-driven DNA damage repair.
Hatchi E, Skourti-Stathaki K, Ventz S, Pinello L, Yen A, Kamieniarz-Gdula K, Dimitrov S, Pathania S, McKinney KM, Eaton ML, Kellis M, Hill SJ, Parmigiani G, Proudfoot NJ, Livingston DM. Hatchi E, et al. Mol Cell. 2015 Feb 19;57(4):636-647. doi: 10.1016/j.molcel.2015.01.011. Mol Cell. 2015. PMID: 25699710 Free PMC article. - The role of BRCA1 in DNA damage response.
Wu J, Lu LY, Yu X. Wu J, et al. Protein Cell. 2010 Feb;1(2):117-23. doi: 10.1007/s13238-010-0010-5. Protein Cell. 2010. PMID: 21203981 Free PMC article. Review. - Identification of Filamin A as a BRCA1-interacting protein required for efficient DNA repair.
Velkova A, Carvalho MA, Johnson JO, Tavtigian SV, Monteiro AN. Velkova A, et al. Cell Cycle. 2010 Apr 1;9(7):1421-33. doi: 10.4161/cc.9.7.11256. Epub 2010 Apr 1. Cell Cycle. 2010. PMID: 20305393 Free PMC article. - BRCA1, a 'complex' protein involved in the maintenance of genomic stability.
Savage KI, Harkin DP. Savage KI, et al. FEBS J. 2015 Feb;282(4):630-46. doi: 10.1111/febs.13150. Epub 2014 Dec 2. FEBS J. 2015. PMID: 25400280 Review. - Functional Link between BRCA1 and BAP1 through Histone H2A, Heterochromatin and DNA Damage Response.
Fukuda T, Tsuruga T, Kuroda T, Nishikawa H, Ohta T. Fukuda T, et al. Curr Cancer Drug Targets. 2016;16(2):101-9. doi: 10.2174/1568009615666151030102427. Curr Cancer Drug Targets. 2016. PMID: 26517537 Review.
Cited by
- BRCA1 binds TERRA RNA and suppresses R-Loop-based telomeric DNA damage.
Vohhodina J, Goehring LJ, Liu B, Kong Q, Botchkarev VV Jr, Huynh M, Liu Z, Abderazzaq FO, Clark AP, Ficarro SB, Marto JA, Hatchi E, Livingston DM. Vohhodina J, et al. Nat Commun. 2021 Jun 10;12(1):3542. doi: 10.1038/s41467-021-23716-6. Nat Commun. 2021. PMID: 34112789 Free PMC article. - Deciphering the BRCA1 Tumor Suppressor Network.
Jiang Q, Greenberg RA. Jiang Q, et al. J Biol Chem. 2015 Jul 17;290(29):17724-17732. doi: 10.1074/jbc.R115.667931. Epub 2015 Jun 5. J Biol Chem. 2015. PMID: 26048987 Free PMC article. Review. - Emerging role for R-loop formation in hepatocellular carcinoma.
Baek H, Park SU, Kim J. Baek H, et al. Genes Genomics. 2023 May;45(5):543-551. doi: 10.1007/s13258-022-01360-8. Epub 2023 Jan 12. Genes Genomics. 2023. PMID: 36635460 Review. - Tandem Affinity Purification and Mass Spectrometry (TAP-MS) for the Analysis of Protein Complexes.
Adelmant G, Garg BK, Tavares M, Card JD, Marto JA. Adelmant G, et al. Curr Protoc Protein Sci. 2019 Jun;96(1):e84. doi: 10.1002/cpps.84. Epub 2019 Feb 1. Curr Protoc Protein Sci. 2019. PMID: 30706993 Free PMC article. - TONSL Is an Immortalizing Oncogene and a Therapeutic Target in Breast Cancer.
Khatpe AS, Dirks R, Bhat-Nakshatri P, Mang H, Batic K, Swiezy S, Olson J, Rao X, Wang Y, Tanaka H, Liu S, Wan J, Chen D, Liu Y, Fang F, Althouse S, Hulsey E, Granatir MM, Addison R, Temm CJ, Sandusky G, Lee-Gosselin A, Nephew K, Miller KD, Nakshatri H. Khatpe AS, et al. Cancer Res. 2023 Apr 14;83(8):1345-1360. doi: 10.1158/0008-5472.CAN-22-3667. Cancer Res. 2023. PMID: 37057595 Free PMC article.
References
- Aguilera A, Garcia-Muse T. 2012. R loops: from transcription byproducts to threats to genome stability. Mol Cell 46: 115–124 - PubMed
- Bhatia V, Barroso SI, Garcia-Rubio ML, Tumini E, Herrera-Moyano E, Aguilera A. 2014. BRCA2 prevents R-loop accumulation and associates with TREX-2 mRNA export factor PCID2. Nature 511: 362–365 - PubMed
Publication types
MeSH terms
Substances
Grants and funding
- DP1 GM105378/GM/NIGMS NIH HHS/United States
- P01 CA080111/CA/NCI NIH HHS/United States
- R01 HG001715/HG/NHGRI NIH HHS/United States
- R01 CA136512/CA/NCI NIH HHS/United States
- T32 GM007753/GM/NIGMS NIH HHS/United States
- U54CA112962/CA/NCI NIH HHS/United States
- R01HG001715/HG/NHGRI NIH HHS/United States
- P01 NS047572/NS/NINDS NIH HHS/United States
- DP1 GM105378/DP/NCCDPHP CDC HHS/United States
- U54 CA112962/CA/NCI NIH HHS/United States
- P01NS047572/NS/NINDS NIH HHS/United States
- F30 CA167895/CA/NCI NIH HHS/United States
- P50CA089393/CA/NCI NIH HHS/United States
- 1F30CA167895-01/CA/NCI NIH HHS/United States
- P50 CA089393/CA/NCI NIH HHS/United States
- P01CA080111/CA/NCI NIH HHS/United States
- R01CA136512/CA/NCI NIH HHS/United States
LinkOut - more resources
Full Text Sources
Other Literature Sources
Miscellaneous
