Serine catabolism regulates mitochondrial redox control during hypoxia - PubMed (original) (raw)
. 2014 Dec;4(12):1406-17.
doi: 10.1158/2159-8290.CD-14-0250. Epub 2014 Sep 3.
Jing Fan 2, Sriram Venneti 1, Ying-Wooi Wan 3, Bruce R Pawel 4, Ji Zhang 1, Lydia W S Finley 1, Chao Lu 1, Tullia Lindsten 1, Justin R Cross 5, Guoliang Qing 6, Zhandong Liu 7, M Celeste Simon 8, Joshua D Rabinowitz 2, Craig B Thompson 9
Affiliations
- PMID: 25186948
- PMCID: PMC4258153
- DOI: 10.1158/2159-8290.CD-14-0250
Serine catabolism regulates mitochondrial redox control during hypoxia
Jiangbin Ye et al. Cancer Discov. 2014 Dec.
Abstract
The de novo synthesis of the nonessential amino acid serine is often upregulated in cancer. In this study, we demonstrate that the serine catabolic enzyme, mitochondrial serine hydroxymethyltransferase (SHMT2), is induced when MYC-transformed cells are subjected to hypoxia. In mitochondria, SHMT2 can initiate the degradation of serine to CO2 and NH4+, resulting in net production of NADPH from NADP+. Knockdown of SHMT2 in MYC-dependent cells reduced cellular NADPH:NADP+ ratio, increased cellular reactive oxygen species, and triggered hypoxia-induced cell death. In vivo, SHMT2 suppression led to impaired tumor growth. In MYC-amplified neuroblastoma patient samples, there was a significant correlation between SHMT2 and hypoxia-inducible factor-1 α (HIF1α), and SHMT2 expression correlated with unfavorable patient prognosis. Together, these data demonstrate that mitochondrial serine catabolism supports tumor growth by maintaining mitochondrial redox balance and cell survival.
Significance: In this study, we demonstrate that the mitochondrial enzyme SHMT2 is induced upon hypoxic stress and is critical for maintaining NADPH production and redox balance to support tumor cell survival and growth.
©2014 American Association for Cancer Research.
Conflict of interest statement
Conflict of interest disclosure:
Craig B. Thompson is a co-founder of Agios Pharmaceuticals and a member of the Board of Directors of Merck.
Figures
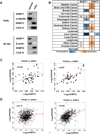
Figure 1. The mitochondrial isoform of SHMT is overexpressed in cancers
(A) Immunoblots for cytosolic and mitochondrial fractions of Kelly or SF188 cells are shown. COX IV is a mitochondrial marker, α-tubulin and β-actin are cytosolic markers. (B) The expression of SHMT isoforms in human cancers. Analysis was performed using the Oncomine Database. Orange indicates overexpression in cancer, blue indicates downregulation in cancer, the numbers indicate the number of cases for each cancer where the fold changes of gene expression are statistically significant (fold change ≥2, p<1E-4). (C) SHMT2 expression correlates with PHGDH expression in neuroblastoma. Pearson correlation: p (PHGDH vs SHMT1)=0.014 (left), p (PHGDH vs SHMT2)=9.6×10⁻⁸ (right). (D) SHMT2 expression correlates with PHGDH expression in breast cancer. p (PHGDH vs SHMT1)=7×10⁻⁷ (left), p (PHGDH vs SHMT2)<1×10⁻⁸ (right).
Figure 2. The hypoxic induction of SHMT2 depends on HIF-1
(A) The promoter sequence of human SHMT2. E-boxes (CACGTG) are shown in red, HREs (NCGTG) are shown in green. (B) Hypoxia induces SHMT2 expression. Kelly cells were exposed to normoxia or 0.5% O2 for 6 or 16 hours. mRNA levels were measured using Q-PCR and normalized to normoxia control. (C) CoCl2 treatment induces SHMT2 expression. Kelly cells were treated with 50µM CoCl2 for 5 or 16 hours. mRNA levels were measured using Q-PCR and normalized to normoxia control. (D) The hypoxic induction of SHMT2 depends on HIF-1. Kelly cells were transfected with 30nM control siRNA or siRNA targeting HIF-1α or HIF-2α. After 48 hours, cells were exposed to 0.5% O2 for 8 (for Q-PCR) or 16 hours (for immunoblot). mRNA levels were measured using Q-PCR and normalized to normoxia control (left panel). HIF-1α and HIF-2α knockdown were confirmed by immunoblot (right panel). Nor= Normoxia; Hyp= Hypoxia. For panel B-D, data represent Mean ± S.D of triplicate PCR reactions, representative of three independent experiments is shown. *p<0.05, **p<0.01, determined by Student’s two-tailed t-test.
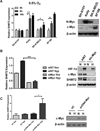
Figure 3. MYC is required for the hypoxic induction of SHMT2
(A)SH-SY5Y, Kelly, SK-N-BE(2) and SF188 cells were exposed to 0.5% O2 for 6 or 16 hours. Left: mRNA levels were measured using Q-PCR and normalized to normoxia control. Right: Immunoblots of N-Myc and c-Myc in the four cell lines. (B) SF188 cells were transfected with c-Myc siRNA and exposed to normoxia (Nor) or 0.5% O2 (Hyp) for 8 (for Q-PCR) or 16 hours (for immunoblot), mRNA levels were measured using Q-PCR (left). Protein levels of HIF-1α, Myc and SHMT2 were exammed by immunoblot (right). (C) SH-SY5Y cells were transfected with 2µg pcDNA-c-Myc or vector control (VC). After 48h, transfected cells were exposed to normoxia (Nor) or 0.5% O2 (Hyp) for 8h. mRNA levels were measured using Q-PCR (left). c-Myc overexpression was confirmed using immunoblot (right). For panel A–C, Data represent Mean ± S.D of triplicate PCR reactions, representative of three independent experiments is shown. *p<0.05, **p<0.01, determined by Student’s two-tailed t-test.
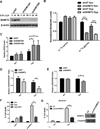
Figure 4. SHMT2 is necessary for maintaining redox balance and cell survival under hypoxia
(A) Kelly cells were infected by lentivirus expressing shRNA targeting SHMT2 (two independent vectors #1 and #2) or a non-targeting control (shNT). After puromycin selection, stable pool of cells was exposed to 0.5% O2 for 24 and 48 hours. SHMT2 knockdown was confirmed by immunoblot. (B) Kelly cells were exposed to 0.5% O2 for 16h, and then labeled with 0.4mM U-13C-serine for 2h in DMEM without serine or glycine. The relative amounts of U-13C-serine and U-13C-glycine were measured using GC-MS. All values are normalized to normoxic shNT control cells (Data represent Mean ± S.D of three biological repeats, representative of two independent experiments is shown). (C) Kelly cells were exposed to normoxia (Nor) or 0.5% O2 (Hyp) for 6h. ROS levels were measured using a flow cytometry-based DCFH assay. All values are normalized to normoxic shNT control cells (Data represent Mean ± S.E.M of three independent experiments). (D) Kelly cells were exposed to normoxia (Nor) or 0.5% O2 (Hyp) for 24 hours. Cellular NADPH and NADP+ were measured using LC-MS (Data represent Mean ± S.E.M of three biological repeats, representative of three independent experiments is shown). (E) Cellular GSH/GSSG ratios were measured using a glutathione colorimetric assay kit. (F) Kelly cells were exposed to normoxia (Nor) or 0.5% O2 (Hyp) for 48 hours with or without 3mM NAC, % cell death was determined using Trypan Blue staining. (G) SH-SY5Y cells were infected by lentivirus expressing pLenti-GIII-CMV-SHMT2 or vector control (VC). After puromycin selection, cells were exposed to normoxia (Nor) or 0.5% O2 (Hyp) for 48 hours. % cell death was determined using Trypan Blue staining. For panels F&G, data represent Mean ± S.D of three biological repeats, representative of three independent experiments is shown. *p<0.05, **p<0.01, ***p<0.001, determined by Student’s two-tailed t-test.
Figure 5. Knockdown of SHMT2 reduces xenograft tumor growth in vivo
Control and shSHMT2 Kelly cells were injected into flanks of athymic nu/nu mice at 2×10⁶ cells/tumor. Tumor volumes were measured twice a week (A). Mice were photographed (B), tumors were harvested and weighed following euthanasia of the mice (C). Data represent Mean ± S.E.M, n=10, *p<0.05, determined by Student’s two-tailed t-test.
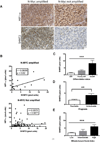
Figure 6. Expression of SHMT2 and HIF-1α correlate in aggressive neuroblastomas
Human neuroblastoma microarray with 123 tumor samples in duplicates were stained for SHMT2 and HIF-1α, staining was quantified using Matlab software. (A) Representative images of HIF-1α and SHMT2 (40×) from N-myc amplified or N-myc non-amplified neuroblastoma samples. (B) SHMT2 and HIF-1α staining correlate in N-Myc amplified tumor samples, but not in tumors without N-myc amplification. (C-E) SHMT2 expression significantly correlates with tumor dedifferentiation and poor prognosis. C: ANOVA, ***p<0.001. D: Student’s test, **p<0.01. E: ANOVA, ***p<0.001.
Figure 7. A model for the role of SHMT2 in maintaining mitochondrial redox control
Under normoxia, enhanced levels of Myc upregulate SHMT2 to promote serine-dependent one-carbon unit generation in the mitochondria (see Figure 3). The formate released from mitochondria contributes to purine synthesis in the cytosol, thus satisfying cellular needs for proliferation (49, 50). During hypoxia, because proliferation is inhibited, and the reduced demand for purines slows the serine catabolic flux. However, HIF-1α stabilization further induces SHMT2 to compensate, facilitating continued NADPH generation and mitochondrial redox balance (see Figures 2 and 4). Abbreviations: PKM2, pyruvate kinase M2; PHGDH, phosphoglycerate dehydrogenase; SHMT, serine hydroxymethyltransferase ; MTHFD, methylenetetrahydrofolate dehydrogenase; THF, tetrahydrofolate.
Comment in
- Mitochondrial one-carbon metabolism maintains redox balance during hypoxia.
Martínez-Reyes I, Chandel NS. Martínez-Reyes I, et al. Cancer Discov. 2014 Dec;4(12):1371-3. doi: 10.1158/2159-8290.CD-14-1228. Cancer Discov. 2014. PMID: 25477105 Free PMC article.
Similar articles
- Serine-dependent redox homeostasis regulates glioblastoma cell survival.
Engel AL, Lorenz NI, Klann K, Münch C, Depner C, Steinbach JP, Ronellenfitsch MW, Luger AL. Engel AL, et al. Br J Cancer. 2020 Apr;122(9):1391-1398. doi: 10.1038/s41416-020-0794-x. Epub 2020 Mar 17. Br J Cancer. 2020. PMID: 32203214 Free PMC article. - SHMT2 promotes cell viability and inhibits ROS-dependent, mitochondrial-mediated apoptosis via the intrinsic signaling pathway in bladder cancer cells.
Zhang Y, Liu Z, Wang X, Jian H, Xiao H, Wen T. Zhang Y, et al. Cancer Gene Ther. 2022 Oct;29(10):1514-1527. doi: 10.1038/s41417-022-00470-5. Epub 2022 Apr 14. Cancer Gene Ther. 2022. PMID: 35422087 - SHMT2 Promotes Gastric Cancer Development through Regulation of HIF1α/VEGF/STAT3 Signaling.
Wang W, Wang M, Du T, Hou Z, You S, Zhang S, Ji M, Xue N, Chen X. Wang W, et al. Int J Mol Sci. 2023 Apr 12;24(8):7150. doi: 10.3390/ijms24087150. Int J Mol Sci. 2023. PMID: 37108312 Free PMC article. - Serine hydroxymethyltransferase 2: a novel target for human cancer therapy.
Xie M, Pei DS. Xie M, et al. Invest New Drugs. 2021 Dec;39(6):1671-1681. doi: 10.1007/s10637-021-01144-z. Epub 2021 Jul 3. Invest New Drugs. 2021. PMID: 34215932 Review. - Carrot and stick: HIF-alpha engages c-Myc in hypoxic adaptation.
Huang LE. Huang LE. Cell Death Differ. 2008 Apr;15(4):672-7. doi: 10.1038/sj.cdd.4402302. Epub 2008 Jan 11. Cell Death Differ. 2008. PMID: 18188166 Review.
Cited by
- Metabolic requirements for cancer cell proliferation.
Keibler MA, Wasylenko TM, Kelleher JK, Iliopoulos O, Vander Heiden MG, Stephanopoulos G. Keibler MA, et al. Cancer Metab. 2016 Aug 18;4:16. doi: 10.1186/s40170-016-0156-6. eCollection 2016. Cancer Metab. 2016. PMID: 27540483 Free PMC article. - Cancer Cells Don't Live Alone: Metabolic Communication within Tumor Microenvironments.
Li F, Simon MC. Li F, et al. Dev Cell. 2020 Jul 20;54(2):183-195. doi: 10.1016/j.devcel.2020.06.018. Epub 2020 Jul 7. Dev Cell. 2020. PMID: 32640203 Free PMC article. Review. - Prognostic and therapeutic value of mitochondrial serine hydroxyl-methyltransferase 2 as a breast cancer biomarker.
Zhang L, Chen Z, Xue D, Zhang Q, Liu X, Luh F, Hong L, Zhang H, Pan F, Liu Y, Chu P, Zheng S, Lou G, Yen Y. Zhang L, et al. Oncol Rep. 2016 Nov;36(5):2489-2500. doi: 10.3892/or.2016.5112. Epub 2016 Sep 20. Oncol Rep. 2016. PMID: 27666119 Free PMC article. - LKB1 loss links serine metabolism to DNA methylation and tumorigenesis.
Kottakis F, Nicolay BN, Roumane A, Karnik R, Gu H, Nagle JM, Boukhali M, Hayward MC, Li YY, Chen T, Liesa M, Hammerman PS, Wong KK, Hayes DN, Shirihai OS, Dyson NJ, Haas W, Meissner A, Bardeesy N. Kottakis F, et al. Nature. 2016 Nov 17;539(7629):390-395. doi: 10.1038/nature20132. Epub 2016 Oct 31. Nature. 2016. PMID: 27799657 Free PMC article. - The expression and clinical significance of serine hydroxymethyltransferase2 in gastric cancer.
Shan Y, Liu D, Li Y, Wu C, Ye Y. Shan Y, et al. PeerJ. 2024 Jan 4;12:e16594. doi: 10.7717/peerj.16594. eCollection 2024. PeerJ. 2024. PMID: 38188143 Free PMC article.
References
Publication types
MeSH terms
Substances
Grants and funding
- K08 CA181475/CA/NCI NIH HHS/United States
- HHMI/Howard Hughes Medical Institute/United States
- P30 CA008748/CA/NCI NIH HHS/United States
- R01 CA163591/CA/NCI NIH HHS/United States
- R01 CA105463/CA/NCI NIH HHS/United States
- K99 CA184239/CA/NCI NIH HHS/United States
- P01 CA104838/CA/NCI NIH HHS/United States
LinkOut - more resources
Full Text Sources
Other Literature Sources


