Toward a systems understanding of plant-microbe interactions - PubMed (original) (raw)
Review
Toward a systems understanding of plant-microbe interactions
Akira Mine et al. Front Plant Sci. 2014.
Abstract
Plants are closely associated with microorganisms including pathogens and mutualists that influence plant fitness. Molecular genetic approaches have uncovered a number of signaling components from both plants and microbes and their mode of actions. However, signaling pathways are highly interconnected and influenced by diverse sets of environmental factors. Therefore, it is important to have systems views in order to understand the true nature of plant-microbe interactions. Indeed, systems biology approaches have revealed previously overlooked or misinterpreted properties of the plant immune signaling network. Experimental reconstruction of biological networks using exhaustive combinatorial perturbations is particularly powerful to elucidate network structure and properties and relationships among network components. Recent advances in metagenomics of microbial communities associated with plants further point to the importance of systems approaches and open a research area of microbial community reconstruction. In this review, we highlight the importance of a systems understanding of plant-microbe interactions, with a special emphasis on reconstruction strategies.
Keywords: experimental network reconstruction; microbial community; pathogen effector; phytohormone; plant immunity; robustness; systems biology; tunability.
Figures
FIGURE 1
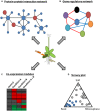
A schematic representation of systems approaches using functional genomics. (A) A protein–protein interaction network represents a global picture of a system at the protein level. In this example, several plant hub proteins (large blue circles) that interact with many plant proteins (small blue circles) are targeted by microbial effectors (large red circles). This approach was used in Mukhtar et al. (2011). (B) Gene regulatory network modeling infers regulatory relationships among components of a system. As an example, a network consisting of seven components (circles with different colors) with positive and negative regulatory relationships (red and blue lines, respectively) is depicted. This approach was used in Sato et al. (2010). (C) Co-expression module analysis is useful to visualize behavior of a system under certain conditions. As an example, co-regulated genes under different conditions are visualized in the heatmap. Red and green boxes indicate up-regulated and down-regulated genes in a certain condition, respectively. This approach was used in Zou et al. (2011), Atkinson et al. (2013), Prasch and Sonnewald (2013), and Rasmussen et al. (2013). (D) A ternary plot is used to show influence by three variables on composition. This example depicts bacterial OTUs whose relative abundance changes according to the three compartments, soil, rhizosphere, and root. Blue circles mark OTUs enriched in the root compartment. This approach was used in Bulgarelli et al. (2012) and Lundberg et al. (2012).
FIGURE 2
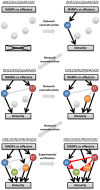
A schematic representation of a stepwise reconstruction of a plant immune signaling network from a ground level state. The Arabidopsis dde2/ein2/pad4/_sid2-_quadruple mutant is considered a ground level state of the plant immune signaling network consisting of the JA, ET, PAD4, and SA signaling sectors. Network reconstruction from the ground level state to the wild-type state via all combinatorial mutants is conducted to quantitatively measure contribution of the individual sectors to immunity (black lines) and activities (circles) and predict their regulatory relationships (gray lines). These predictions are experimentally verified (red lines). For simplicity, only one example is shown for triple, double, and single mutants. This approach was used in Tsuda et al. (2009) and Kim et al. (2014).
FIGURE 3
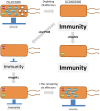
A schematic representation of a stepwise reconstruction of a functional effector repertoire of Pseudomonas syringae. The P. syringae pv. tomato (Pto) DC3000 mutant lacking 28 effectors (DC3000D28E) is considered a ground level state for virulence. AvrPtoB but not HopM1 is sufficient to promote in planta bacterial growth. HopM1 requires AvrPtoB to promote bacterial growth. The remaining six effectors (AvrE, HopE1, HopG1, HopAM1, HopAA1, and HopN1) support bacterial growth to near the wild-type level in the presence of AvrPtoB and HopM1. This approach was used in Cunnac et al. (2011).
Similar articles
- Microbial Hub Taxa Link Host and Abiotic Factors to Plant Microbiome Variation.
Agler MT, Ruhe J, Kroll S, Morhenn C, Kim ST, Weigel D, Kemen EM. Agler MT, et al. PLoS Biol. 2016 Jan 20;14(1):e1002352. doi: 10.1371/journal.pbio.1002352. eCollection 2016 Jan. PLoS Biol. 2016. PMID: 26788878 Free PMC article. - Network biology to uncover functional and structural properties of the plant immune system.
Mishra B, Kumar N, Mukhtar MS. Mishra B, et al. Curr Opin Plant Biol. 2021 Aug;62:102057. doi: 10.1016/j.pbi.2021.102057. Epub 2021 Jun 5. Curr Opin Plant Biol. 2021. PMID: 34102601 Review. - Macromolecular crowding: chemistry and physics meet biology (Ascona, Switzerland, 10-14 June 2012).
Foffi G, Pastore A, Piazza F, Temussi PA. Foffi G, et al. Phys Biol. 2013 Aug;10(4):040301. doi: 10.1088/1478-3975/10/4/040301. Epub 2013 Aug 2. Phys Biol. 2013. PMID: 23912807 - Systems Biology of Plant-Microbiome Interactions.
Rodriguez PA, Rothballer M, Chowdhury SP, Nussbaumer T, Gutjahr C, Falter-Braun P. Rodriguez PA, et al. Mol Plant. 2019 Jun 3;12(6):804-821. doi: 10.1016/j.molp.2019.05.006. Epub 2019 May 23. Mol Plant. 2019. PMID: 31128275 Review. - Modulation of Plant Defense System in Response to Microbial Interactions.
Nishad R, Ahmed T, Rahman VJ, Kareem A. Nishad R, et al. Front Microbiol. 2020 Jul 3;11:1298. doi: 10.3389/fmicb.2020.01298. eCollection 2020. Front Microbiol. 2020. PMID: 32719660 Free PMC article. Review.
Cited by
- Metabolomics Insights into Chemical Convergence in Xanthomonas perforans and Metabolic Changes Following Treatment with the Small Molecule Carvacrol.
Jibrin MO, Liu Q, Guingab-Cagmat J, Jones JB, Garrett TJ, Zhang S. Jibrin MO, et al. Metabolites. 2021 Dec 16;11(12):879. doi: 10.3390/metabo11120879. Metabolites. 2021. PMID: 34940636 Free PMC article. - An incoherent feed-forward loop mediates robustness and tunability in a plant immune network.
Mine A, Nobori T, Salazar-Rondon MC, Winkelmüller TM, Anver S, Becker D, Tsuda K. Mine A, et al. EMBO Rep. 2017 Mar;18(3):464-476. doi: 10.15252/embr.201643051. Epub 2017 Jan 9. EMBO Rep. 2017. PMID: 28069610 Free PMC article. - Phylotranscriptomics of the Pentapetalae Reveals Frequent Regulatory Variation in Plant Local Responses to the Fungal Pathogen Sclerotinia sclerotiorum.
Sucher J, Mbengue M, Dresen A, Barascud M, Didelon M, Barbacci A, Raffaele S. Sucher J, et al. Plant Cell. 2020 Jun;32(6):1820-1844. doi: 10.1105/tpc.19.00806. Epub 2020 Apr 7. Plant Cell. 2020. PMID: 32265317 Free PMC article. - Profiling the extended phenotype of plant pathogens: Challenges in Bacterial Molecular Plant Pathology.
Preston GM. Preston GM. Mol Plant Pathol. 2017 Apr;18(3):443-456. doi: 10.1111/mpp.12530. Epub 2017 Feb 16. Mol Plant Pathol. 2017. PMID: 28026146 Free PMC article. Review. - Salicylic acid signal transduction: the initiation of biosynthesis, perception and transcriptional reprogramming.
Seyfferth C, Tsuda K. Seyfferth C, et al. Front Plant Sci. 2014 Dec 9;5:697. doi: 10.3389/fpls.2014.00697. eCollection 2014. Front Plant Sci. 2014. PMID: 25538725 Free PMC article.
References
Publication types
LinkOut - more resources
Full Text Sources
Other Literature Sources


