Spatial control of the GEN1 Holliday junction resolvase ensures genome stability - PubMed (original) (raw)
Spatial control of the GEN1 Holliday junction resolvase ensures genome stability
Ying Wai Chan et al. Nat Commun. 2014.
Abstract
Holliday junction (HJ) resolvases are necessary for the processing of persistent recombination intermediates before cell division. Their actions, however, need to be restricted to the late stages of the cell cycle to avoid the inappropriate cleavage of replication intermediates. Control of the yeast HJ resolvase, Yen1, involves phosphorylation changes that modulate its catalytic activity and nuclear import. Here, we show that GEN1, the human ortholog of Yen1, is regulated by a different mechanism that is independent of phosphorylation. GEN1 is controlled exclusively by nuclear exclusion, driven by a nuclear export signal (NES) that restricts GEN1 actions to mitosis when the nuclear membrane breaks down. Construction of a nuclear-localized version of GEN1 revealed that its premature actions partially suppress phenotypes associated with loss of BLM and MUS81, but cause elevated crossover formation. The spatial control of GEN1 therefore contributes to genome stability, by avoiding competition with non-crossover promoting repair pathways.
Figures
Figure 1. Cellular localization of GEN1.
(a) HeLa cells expressing GEN1-FLAP were treated with or without hydroxyurea (HU, 2 mM), camptothecin (CPT, 20 nM) or cisplatin (Cis-Pt, 2 μM) for 16 h. GEN1, γH2AX and DNA were visualized using an anti-GFP antibody (green), an anti-γH2AX antibody (red) and DAPI staining (blue), respectively. (b) Cell fractionation to determine the localization of GEN1. Fractions were analysed by western blotting for the indicated proteins. (c) HeLa cells expressing GEN1-FLAP were treated with or without 25 nM LMB for 4 h. GEN1 and DNA were visualized as in a. (d) As c, except the LMB-treated cells were stained for Cyclin A (red) to identify S- and G2-phase cells. (e) As a, with α-tubulin staining decorating the mid-body and marking late mitotic cells. Scale bars, 10 μm.
Figure 2. GEN1 activity is independent of its phosphorylation status.
(a,b) Extracts were prepared from HeLa cells expressing GEN1-FLAP after synchronization with thymidine (Thy) or nocodazole (Noc), as indicated. Cell extracts were analysed by western blotting for the indicated proteins (a). GEN1-FLAP was affinity purified from each sample by GFP pull down, treated with active or heat-inactivated λ-phosphatase (95 °C), and assayed for HJ resolution activity (b). Phosphorylated GEN1 was detected using an anti-phosphoserine antibody (p-Ser) that is specific for CDK substrates. (c,d) Extracts were prepared from HeLa cells expressing GEN1-FLAP after release from nocodazole arrest at the indicated time points. Cell extracts were analysed by western blotting for the indicated proteins (c). GEN1-FLAP was affinity purified from each sample by GFP pull down and assayed for HJ resolution activity (d).
Figure 3. Functional activity of a GEN1 phosphomutant.
(a) Extracts were prepared from GEN1 −/− Flp-In T-REx 293 cells expressing GEN1WT or GEN18A after synchronization with Thymidine (Thy) or Nocodazole (Noc) as indicated. Cell extracts were analysed by western blotting for the indicated proteins. GEN1-FLAG was affinity purified from each sample using anti-FLAG M2 agarose beads and assayed for HJ resolution activity. Parental Flp-In T-Rex 293 cells (293) were used as a control. (b) Biochemical fractionation of GEN1 −/− cells expressing GEN1WT or GEN18A after overnight synchronization with Nocodazole. The whole-cell extract (total), soluble and chromatin (Chr) fractions were analysed by western blotting for the indicated proteins. (c) Flp-In T-Rex 293 cells, GEN1 −/− cells and GEN1 −/− cells expressing GEN1WT or GEN18A were treated with cisplatin (2 μM) for 1 h. SCE formation was quantified as described. Forty metaphase cells (>1,600 chromosomes) were counted per condition. Black bars represent the mean number of SCEs per 100 chromosomes per spread. P values were determined using a two-tailed _t_-test. NS: not significant.
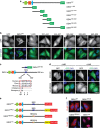
Figure 4. Cytoplasmic localization of GEN1 is directed by a nuclear export signal.
(a) Schematic representation of a series of GEN1 truncations. The green hexagon, the orange square and the blue ellipse represent the XPG-N, XPG-I and the helix–hairpin–helix domains, respectively. GFP signifies the C-terminal tag. (b) HeLa cells, transfected with the GEN1-GFP tagged constructs, or GFP alone, were visualized by immunofluorescence. GEN1-GFP and DNA were visualized as in Fig. 1. (c) Schematic representation of the putative nuclear export signal (NES) of GEN1, which is conserved between various mammalian species. (d) HeLa cells, transfected with GEN1526–683-GFP or GEN1526–683(4A)-GFP, were treated with or without LMB. GEN1 and DNA were visualized as above. (e) Schematic representation of GEN1WT, GEN1 with 3xNLS sequences (GEN13xNLS), GEN1 with mutated NES (GEN1NES(4A)) and GEN1 with a mutated NES and 3xNLS sequences (GEN1nuc). (f) HeLa cells, transfected with the GEN1 constructs shown in e, were analysed for GEN1-FLAG and DNA using an anti-FLAG antibody and DAPI staining, respectively. Scale bars, 10 μm.
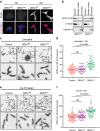
Figure 5. Expression of nuclear GEN1 leads to elevated SCE formation.
(a) Flp-In T-REx 293 cells stably expressing GEN1WT or GEN1nuc were treated with or without tetracycline (Tet) for 48 h. GEN1 and DNA were visualized using an anti-FLAG antibody and DAPI staining, respectively. Scale bar, 10 μm. (b) Biochemical fractionation of cells expressing GEN1WT or GEN1nuc after overnight synchronization with hydroxyurea (2 mM). The fractions were analysed by western blotting for the indicated proteins. (c) Representative images of metaphase spreads from parental Flp-In T-REx 293 cells (control), and cells expressing GEN1WT or GEN1nuc. (d) Quantification of SCE formation, as determined in c. Each data point represents a single metaphase. 60 metaphase cells (>2,600 chromosomes) were counted per condition. Black bars represent the mean number of SCEs per 100 chromosomes per spread. P values were determined using a two-tailed _t_-test. (e) As c, except the cells were treated with cisplatin (2 μM). (f) Quantification of SCE formation, as in e.
Figure 6. Rescue of BLM/MUS81 defects by expression of GEN1nuc.
(a) Clonogenic cell survival assays were carried out on Flp-In T-REx 293 cells expressing GEN1WT or GEN1nuc (±Tet) and depleted for the indicated proteins. Cell survival after treatment with the control siRNA is defined as 100%. The data represent the mean±s.d. of at least three independent experiments. P values were determined using a two-tailed _t_-test. (b) Representative images of metaphase spreads of Flp-In T-REx 293 cells treated with the indicated siRNAs. Three types of chromosome aberrations (chromatid breaks, isochromatid breaks and radial chromosomes) were identified and quantified. (c) Flp-In T-REx 293 cells expressing GEN1WT or GEN1nuc (±Tet) were treated with the indicated siRNAs, and metaphase spreads were analysed and quantified for the indicated chromosome aberrations. One-hundred twenty metaphase cells (>5,500 chromosomes) were analysed. The data represent the mean number of aberrations per 100 chromosomes per spread±s.e.m. P values were determined using a two-tailed _t_-test.
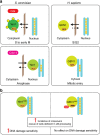
Figure 7. Distinct mechanisms of regulatory control for S. cerevisiae Yen1 and human GEN1.
(a) Regulatory control mechanisms (see text for details). (b) Phenotypic effects of expressing Yen1ON and GEN1nuc (see text for details).
Similar articles
- Aberrant chromosome morphology in human cells defective for Holliday junction resolution.
Wechsler T, Newman S, West SC. Wechsler T, et al. Nature. 2011 Mar 31;471(7340):642-6. doi: 10.1038/nature09790. Epub 2011 Mar 13. Nature. 2011. PMID: 21399624 Free PMC article. - Cdc14 targets the Holliday junction resolvase Yen1 to the nucleus in early anaphase.
García-Luis J, Clemente-Blanco A, Aragón L, Machín F. García-Luis J, et al. Cell Cycle. 2014;13(9):1392-9. doi: 10.4161/cc.28370. Epub 2014 Mar 5. Cell Cycle. 2014. PMID: 24626187 Free PMC article. - The human Holliday junction resolvase GEN1 rescues the meiotic phenotype of a Schizosaccharomyces pombe mus81 mutant.
Lorenz A, West SC, Whitby MC. Lorenz A, et al. Nucleic Acids Res. 2010 Apr;38(6):1866-73. doi: 10.1093/nar/gkp1179. Epub 2009 Dec 29. Nucleic Acids Res. 2010. PMID: 20040574 Free PMC article. - Resolution of Recombination Intermediates: Mechanisms and Regulation.
West SC, Blanco MG, Chan YW, Matos J, Sarbajna S, Wyatt HD. West SC, et al. Cold Spring Harb Symp Quant Biol. 2015;80:103-9. doi: 10.1101/sqb.2015.80.027649. Epub 2015 Sep 14. Cold Spring Harb Symp Quant Biol. 2015. PMID: 26370409 Review. - Holliday junction processing enzymes as guardians of genome stability.
Sarbajna S, West SC. Sarbajna S, et al. Trends Biochem Sci. 2014 Sep;39(9):409-19. doi: 10.1016/j.tibs.2014.07.003. Epub 2014 Aug 14. Trends Biochem Sci. 2014. PMID: 25131815 Review.
Cited by
- Nuclear and cytoplasmic WDR-23 isoforms mediate differential effects on GEN-1 and SKN-1 substrates.
Spatola BN, Lo JY, Wang B, Curran SP. Spatola BN, et al. Sci Rep. 2019 Aug 13;9(1):11783. doi: 10.1038/s41598-019-48286-y. Sci Rep. 2019. PMID: 31409866 Free PMC article. - Resolution of the Holliday junction recombination intermediate by human GEN1 at the single-molecule level.
Sobhy MA, Bralić A, Raducanu VS, Takahashi M, Tehseen M, Rashid F, Zaher MS, Hamdan SM. Sobhy MA, et al. Nucleic Acids Res. 2019 Feb 28;47(4):1935-1949. doi: 10.1093/nar/gky1280. Nucleic Acids Res. 2019. PMID: 30590761 Free PMC article. - Hold your horSSEs: controlling structure-selective endonucleases MUS81 and Yen1/GEN1.
Blanco MG, Matos J. Blanco MG, et al. Front Genet. 2015 Jul 30;6:253. doi: 10.3389/fgene.2015.00253. eCollection 2015. Front Genet. 2015. PMID: 26284109 Free PMC article. Review. - Human Holliday junction resolvase GEN1 uses a chromodomain for efficient DNA recognition and cleavage.
Lee SH, Princz LN, Klügel MF, Habermann B, Pfander B, Biertümpfel C. Lee SH, et al. Elife. 2015 Dec 18;4:e12256. doi: 10.7554/eLife.12256. Elife. 2015. PMID: 26682650 Free PMC article. - An Overview of the Molecular Mechanisms of Recombinational DNA Repair.
Kowalczykowski SC. Kowalczykowski SC. Cold Spring Harb Perspect Biol. 2015 Nov 2;7(11):a016410. doi: 10.1101/cshperspect.a016410. Cold Spring Harb Perspect Biol. 2015. PMID: 26525148 Free PMC article. Review.
References
- Petermann E. & Helleday T. Pathways of mammalian replication fork restart. Nat. Rev. Mol. Cell Biol. 11, 683–687 (2010). - PubMed
- Holliday R. A mechanism for gene conversion in fungi. Genet. Res. Camb. 5, 282–304 (1964). - PubMed
- West S. C. Molecular views of recombination proteins and their control. Nat. Rev. Mol. Cell Biol. 4, 435–445 (2003). - PubMed
Publication types
MeSH terms
Substances
Grants and funding
- 11582/CRUK_/Cancer Research UK/United Kingdom
- 2009MAYPR01/BCN_/Breast Cancer Now/United Kingdom
- 249145/ERC_/European Research Council/International
- A3563/CRUK_/Cancer Research UK/United Kingdom
LinkOut - more resources
Full Text Sources
Other Literature Sources
Molecular Biology Databases


