The cyclic dinucleotide c-di-AMP is an allosteric regulator of metabolic enzyme function - PubMed (original) (raw)
. 2014 Sep 11;158(6):1389-1401.
doi: 10.1016/j.cell.2014.07.046.
Philip H Choi 2, Mimi Precit 1, Matthieu Delince 3, Daniel A Pensinger 4, TuAnh Ngoc Huynh 1, Ashley R Jurado 2, Young Ah Goo 5, Martin Sadilek 6, Anthony T Iavarone 7, John-Demian Sauer 4, Liang Tong 8, Joshua J Woodward 9
Affiliations
- PMID: 25215494
- PMCID: PMC4166403
- DOI: 10.1016/j.cell.2014.07.046
The cyclic dinucleotide c-di-AMP is an allosteric regulator of metabolic enzyme function
Kamakshi Sureka et al. Cell. 2014.
Abstract
Cyclic di-adenosine monophosphate (c-di-AMP) is a broadly conserved second messenger required for bacterial growth and infection. However, the molecular mechanisms of c-di-AMP signaling are still poorly understood. Using a chemical proteomics screen for c-di-AMP-interacting proteins in the pathogen Listeria monocytogenes, we identified several broadly conserved protein receptors, including the central metabolic enzyme pyruvate carboxylase (LmPC). Biochemical and crystallographic studies of the LmPC-c-di-AMP interaction revealed a previously unrecognized allosteric regulatory site 25 Å from the active site. Mutations in this site disrupted c-di-AMP binding and affected catalytic activity of LmPC as well as PC from pathogenic Enterococcus faecalis. C-di-AMP depletion resulted in altered metabolic activity in L. monocytogenes. Correction of this metabolic imbalance rescued bacterial growth, reduced bacterial lysis, and resulted in enhanced bacterial burdens during infection. These findings greatly expand the c-di-AMP signaling repertoire and reveal a central metabolic regulatory role for a cyclic dinucleotide.
Copyright © 2014 Elsevier Inc. All rights reserved.
Figures
Figure 1. Identification of c-di-AMP-interacting proteins from L. monocytogenes
(A) Schematic diagram of chemical proteomics used to identify c-di-AMP interacting proteins. 1° and 2° represent direct and indirect specific binding proteins. (B) Representative pull-down from bacterial lysates with c-di-AMP (+) and control sepharose (-). The remaining lanes from the SDS-PAGE gel have been removed for clarity. (C) Quantitative shotgun proteomics of c-di-AMP binding proteins. Data are sorted based upon fold change (FC) in spectral count ratio (c-di-AMP sepharose/control sepharose). Data points in red represent proteins with FC >7 (horizontal black line) and a false discovery rate (FDR) < 0.05. (D) List of top hits identified by chemical proteomics. Studies performed in L. monocytogenes strain 10403S. Locus numbers based on strain EGD-e (Accession number: NC_003210.1). Proteins in bold confirmed for direct c-di-AMP binding with (E) purified recombinant proteins or (F) crude cell lysate for proteins identified by chemical proteomics. Data are mean ± SEM (_N_=2). *P<0.05 (Students _t_-test, two-tailed). See also Figure S1-S3.
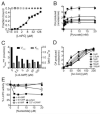
Figure 2. LmPC specifically binds and is inhibited by c-di-AMP
(A) Binding titration of c-di-AMP and LmPC using 32P-c-di-AMP. (B) Enzymatic activity of LmPC in the presence of Acetyl-CoA (100 μM), varied pyruvate, and c-di-AMP concentrations as indicated. (C) Rate constants of pyruvate turnover in the presence of c-di-AMP. (D) Enzymatic activity of PC in the presence of pyruvate (20 mM), varied Acetyl-CoA (allosteric activator) and c-di-AMP concentrations as indicated. (E) PC activity in the presence of nucleotide analogues. Data reported as percent activity relative to that without added nucleotide. All data reported as the mean +/− SEM. See also Figure S4.
Figure 3. Crystal structure of LmPC in complex with c-di-AMP
(A). Omit Fo-Fc electron density map for c-di-AMP at 2.5 Å resolution, contoured at 3′ (B). Schematic drawing of the structure of LmPC tetramer in complex with two c-di-AMP molecules. The domains of monomer 1 are colored separately, according to the diagram at the bottom of the panel. c-di-AMP is shown as a sphere model and labeled cdA (carbon atoms in black). The metal ion in the active site of the CT domain is shown as a gray sphere and labeled M2+. The distance from the CT active site and c-di-AMP binding site is indicated with the red line. (C). Detailed interactions between c-di-AMP and LmPC. Hydrogen-bonding interactions are indicated with dashed lines (in red). Water molecules are shown as red spheres. All structure figures were produced with PyMOL (
). See also Table S1 and Figure S5.
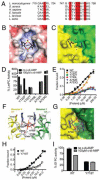
Figure 4. Functional analysis of the c-di-AMP binding site of PC
(A). Conservation of residues in the c-di-AMP binding site. The five residues in the binding site are highlighted in red. (B). Molecular surface of the LmPC binding site for c-di-AMP (labeled cdA), colored by the electrostatic potential (red: negative, blue: positive). (C). Molecular surface of SaPC at the CT dimer interface. The c-di-AMP molecule is shown as a reference in stick models. (D). Effects of c-di-AMP on the catalytic activity of wild-type and mutant LmPC. (E). Titration curve showing varied sensitivity of wild-type and mutant LmPC to c-di-AMP. (F) LmPC c-di-AMP binding pocket with corresponding EfPC amino acid variations. (G) Surface view of modeled EfPC. (H) C-di-AMP binding to WT and Y718T EfPC. (I) Activity of WT and Y718T EfPC in the presence and absence of c-di-AMP. Data are mean ± SEM (D, E, G, and H). See also Figure S6.
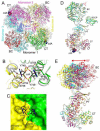
Figure 5. Large conformational differences in the structure of apo LmPC
(A). Overlay of the structure of LmPC in complex with c-di-AMP (in color) with that of apo LmPC (in gray). The superposition was based on monomer 1. Large differences in the positions of the other monomers are visible. (B). Conformational differences in the c-di-AMP binding site in the structure of apo LmPC. (C). Molecular surface of apo LmPC at the CT dimer interface. The c-di-AMP molecule would clash with the enzyme in this conformation. (D). Overlay of the four monomers of the LmPC tetramer in the complex with c-di-AMP. The superposition is based on the CT domain only. A small conformational difference is seen for the BC domain. (E). Overlay of the four monomers of the apo LmPC tetramer. Large differences are observed in the positions and orientations of the BC domains.
Figure 6. Metabolic imbalance specifically alters L. monocytogenes intracellular growth
(A) De novo biosynthesis of amino acids and labeling patterns from 13C-glucose by L. monocytogenes. Dark spheres, 13C. Light spheres, natural abundance carbon. (B) 13C enrichment into Ala, Asp, and Glx from mid-exponential L. monocyotogenes strains. (C) Magnitude of growth of L. monocytogenes strains in iBMMs. Data reported as the ratio of CFU recovered at 8 hpi relative to 0.5 hpi. (D) 13C enrichment into Ala, Asp, and Glx from mid-exponential L. monocyotogenes strains. (E) Immortalized murine bone marrow derived macrophages were infected with L. monocytogenes and CFU were enumerated at the indicated times. (F) Plaque area from mouse fibroblasts (L2 cells) infected with indicated strains and normalized to WT. (G) Bacterial burden in organs 48 h post infection with the median indicated by a horizontal bar. (C-F) Data are mean ± SEM. (B-G) Data are representative of at least two independent experiments.. (D) *P<0.001 (Students _t_-test, two-tailed). See also Figure S7.
Figure 7. C-di-AMP-induced metabolic imbalance provokes intracellular bacteriolysis and host cell pyroptosis
(A) Cytotoxicity induced in primary BMMs by the indicated strains following infection was measured by LDH release. (B) Intracellular lysis of bacterial strains in iBMMs as measure by reported plasmid delivery. Percent lysis was determined by normalizing to Holin-Lysin and uninfected controls. (C) Lysis of L. monocytogenes strains grown in BHI. (D) Growth of cΔ_dacA L. monocytogenes_ in WT (closed symbols) and Caspase 1−/− (open symbols) BMMs. Data are mean ± SEM and are representative of at least two independent experiments. *P<0.05 (Students _t_-test, two-tailed); NS, not significant.
Similar articles
- Structural and functional studies of pyruvate carboxylase regulation by cyclic di-AMP in lactic acid bacteria.
Choi PH, Vu TMN, Pham HT, Woodward JJ, Turner MS, Tong L. Choi PH, et al. Proc Natl Acad Sci U S A. 2017 Aug 29;114(35):E7226-E7235. doi: 10.1073/pnas.1704756114. Epub 2017 Aug 14. Proc Natl Acad Sci U S A. 2017. PMID: 28808024 Free PMC article. - Cyclic di-AMP is critical for Listeria monocytogenes growth, cell wall homeostasis, and establishment of infection.
Witte CE, Whiteley AT, Burke TP, Sauer JD, Portnoy DA, Woodward JJ. Witte CE, et al. mBio. 2013 May 28;4(3):e00282-13. doi: 10.1128/mBio.00282-13. mBio. 2013. PMID: 23716572 Free PMC article. - (p)ppGpp and c-di-AMP Homeostasis Is Controlled by CbpB in Listeria monocytogenes.
Peterson BN, Young MKM, Luo S, Wang J, Whiteley AT, Woodward JJ, Tong L, Wang JD, Portnoy DA. Peterson BN, et al. mBio. 2020 Aug 25;11(4):e01625-20. doi: 10.1128/mBio.01625-20. mBio. 2020. PMID: 32843560 Free PMC article. - A jack of all trades: the multiple roles of the unique essential second messenger cyclic di-AMP.
Commichau FM, Dickmanns A, Gundlach J, Ficner R, Stülke J. Commichau FM, et al. Mol Microbiol. 2015 Jul;97(2):189-204. doi: 10.1111/mmi.13026. Epub 2015 May 9. Mol Microbiol. 2015. PMID: 25869574 Review. - Replenishing the cyclic-di-AMP pool: regulation of diadenylate cyclase activity in bacteria.
Pham TH, Liang ZX, Marcellin E, Turner MS. Pham TH, et al. Curr Genet. 2016 Nov;62(4):731-738. doi: 10.1007/s00294-016-0600-8. Epub 2016 Apr 13. Curr Genet. 2016. PMID: 27074767 Review.
Cited by
- Chemical proteomics reveals a second family of cyclic-di-AMP hydrolases.
Helmann JD. Helmann JD. Proc Natl Acad Sci U S A. 2015 Feb 17;112(7):1921-2. doi: 10.1073/pnas.1500077112. Epub 2015 Jan 30. Proc Natl Acad Sci U S A. 2015. PMID: 25637595 Free PMC article. No abstract available. - A distinct holoenzyme organization for two-subunit pyruvate carboxylase.
Choi PH, Jo J, Lin YC, Lin MH, Chou CY, Dietrich LEP, Tong L. Choi PH, et al. Nat Commun. 2016 Oct 6;7:12713. doi: 10.1038/ncomms12713. Nat Commun. 2016. PMID: 27708276 Free PMC article. - Identification of novel genetic factors that regulate c-di-AMP production in Staphylococcus aureus using a riboswitch-based biosensor.
Kviatkovski I, Zhong Q, Vaidya S, Gründling A. Kviatkovski I, et al. mSphere. 2024 Oct 29;9(10):e0032124. doi: 10.1128/msphere.00321-24. Epub 2024 Sep 17. mSphere. 2024. PMID: 39287429 Free PMC article. - Cyclic Di-adenosine Monophosphate Regulates Metabolism and Growth in the Oral Commensal Streptococcus mitis.
Rørvik GH, Liskiewicz KA, Kryuchkov F, Naemi AO, Aasheim HC, Petersen FC, Küntziger TM, Simm R. Rørvik GH, et al. Microorganisms. 2020 Aug 20;8(9):1269. doi: 10.3390/microorganisms8091269. Microorganisms. 2020. PMID: 32825526 Free PMC article. - Inhibition of the Staphylococcus aureus c-di-AMP cyclase DacA by direct interaction with the phosphoglucosamine mutase GlmM.
Tosi T, Hoshiga F, Millership C, Singh R, Eldrid C, Patin D, Mengin-Lecreulx D, Thalassinos K, Freemont P, Gründling A. Tosi T, et al. PLoS Pathog. 2019 Jan 22;15(1):e1007537. doi: 10.1371/journal.ppat.1007537. eCollection 2019 Jan. PLoS Pathog. 2019. PMID: 30668586 Free PMC article.
References
Publication types
MeSH terms
Substances
Grants and funding
- T32 GM095421/GM/NIGMS NIH HHS/United States
- U54 AI057141/AI/NIAID NIH HHS/United States
- R01 DK067238/DK/NIDDK NIH HHS/United States
- T32 GM007367/GM/NIGMS NIH HHS/United States
- OD012208/OD/NIH HHS/United States
- U54AI057141/AI/NIAID NIH HHS/United States
- R01DK067238/DK/NIDDK NIH HHS/United States
- P41 GM111244/GM/NIGMS NIH HHS/United States
- S10 OD012018/OD/NIH HHS/United States
- GM007367/GM/NIGMS NIH HHS/United States
LinkOut - more resources
Full Text Sources
Other Literature Sources


