TLR5-mediated sensing of gut microbiota is necessary for antibody responses to seasonal influenza vaccination - PubMed (original) (raw)
. 2014 Sep 18;41(3):478-492.
doi: 10.1016/j.immuni.2014.08.009. Epub 2014 Sep 11.
Rajesh Ravindran 1, Benoit Chassaing 2, Frederic A Carvalho 3, Mohan S Maddur 1, Maureen Bower 4, Paul Hakimpour 5, Kiran P Gill 1, Helder I Nakaya 6, Felix Yarovinsky 7, R Balfour Sartor 4, Andrew T Gewirtz 2, Bali Pulendran 8
Affiliations
- PMID: 25220212
- PMCID: PMC4169736
- DOI: 10.1016/j.immuni.2014.08.009
TLR5-mediated sensing of gut microbiota is necessary for antibody responses to seasonal influenza vaccination
Jason Z Oh et al. Immunity. 2014.
Abstract
Systems biological analysis of immunity to the trivalent inactivated influenza vaccine (TIV) in humans revealed a correlation between early expression of TLR5 and the magnitude of the antibody response. Vaccination of Trl5(-/-) mice resulted in reduced antibody titers and lower frequencies of plasma cells, demonstrating a role for TLR5 in immunity to TIV. This was due to a failure to sense host microbiota. Thus, antibody responses in germ-free or antibiotic-treated mice were impaired, but restored by oral reconstitution with a flagellated, but not aflagellated, strain of E. coli. TLR5-mediated sensing of flagellin promoted plasma cell differentiation directly and by stimulating lymph node macrophages to produce plasma cell growth factors. Finally, TLR5-mediated sensing of the microbiota also impacted antibody responses to the inactivated polio vaccine, but not to adjuvanted vaccines or the live-attenuated yellow fever vaccine. These results reveal an unappreciated role for gut microbiota in promoting immunity to vaccination.
Copyright © 2014 Elsevier Inc. All rights reserved.
Figures
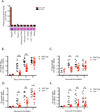
Figure 1. TIV induces antibody responses in a TLR5-dependent manner without directly signaling through TLR5
(A) SEAP concentrations in the supernatant of a TLR5-NFkB reporter cell line co-cultured with the indicated panel of TLR ligands and vaccines. Culture supernatant was assayed for reporter activity at 20 hours of incubation. Data shown are mean O.D. values ± SEM and representative of two independent experiments. (B–E) TIV-specific IgG total (B), IgM (C), IgG1 (D), IgG2c (E) concentrations in the serum of_Tlr5−/−_ or littermate WT mice. The raw O.D. values shown were obtained using serum (diluted by a factor of 1:200) from three independent experiments assayed concurrently in (B) and two independent experiments in (C–E). Data are represented as the means ± SEM. See also Figure S1.
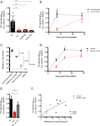
Figure 2. Host Microbiota is Necessary for Early Antibody Response to TIV
(A) TIV-specific IgG concentrations in serum serum of_Trl5−/−_, antibiotic-treated, or germ-free, or WT mice on day 7 following vaccination. The raw O.D. values shown were obtained using serum diluted by a factor of 1:200. Data are representative of three independent experiments and shown as means ± SEM. (B) Kinetics of TIV-specific IgG levels induced in conventional or germ-free mice. The raw O.D. values shown were obtained using serum diluted by a factor of 1:200. Data are representative of three independent experiments and shown as means ± SEM. (C) Bacteria in stool samples quantified by qPCR. (D) Kinetics of TIV-specific IgG concentrations induced in antibiotic-treated or untreated mice. The raw O.D. values shown were obtained using serum diluted by a factor of 1:200. Data are representative of five independent experiments and shown as means ± SEM. (E) TIV-specific IgG concentrations on day 7-post vaccination in_Tlr5−/−_ mice, littermate WT, and conventionalized germ-free mice. Serum samples assayed at1:200 dilution and shown as means ± SEM. (F) Pair-wise analysis of baseline bacterial with levels of TIV-specific IgG in corresponding mice at day 7-post vaccination. See also Figure S2.
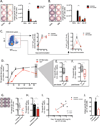
Figure 3. Impact of TLR5 signaling and Microbiota in Primary and Secondary B cell Responses
(A, B) Frequency of TIV-specific antibody secreting cells (ASC) in the draining LN of germ-free or SPF mice (A) and mice treated with a cocktail of broad-spectrum antibiotics or left untreated (B). Representative spot formations are shown and total frequencies are expressed as the means ± SEM in the graphs on the right. Data are representative of three independent experiments. (C) Relative frequencies of germinal center B cells (GL7+, CD138−, intracellular IgG (heavy and light chain) and short-lived plasma cells (GL7−, CD138+, intracellular IgG(heavy and light chain)+) gated from a population of CD11b−TCRb− cells (left and right graphs, respectively). (D–F) Tlr5−/− and littermate WT mice were vaccinated with TIV and vaccine-specific serum IgG concentrations were measured at the indicated time points following vaccination by serum ELISA. (E) Preboost and (F) day 5-post boost serum concentrations of TIV-specific IgG. Raw O.D. values shown were obtained using serum diluted by a factor of 1:3600 and 1:400, respectively. Data are represented as means ± SEM. (G) Frequency of TIV-specific ASCs in the LN and (H) levels of TIV-specific IgG at day 5 –post boost injection in antibiotic-treated or untreated mice. Boost dose of TIV was administered 50 days following prime immunization. Representative spot formations are shown on the left and ASC frequencies expressed as means ± SEM in the graph. Raw O.D. values were obtained from serum assayed at a dilution of 1:3200. (I) Pairwise analysis was conducted using the levels of TIV-specific serum IgG antibodies measured by ELISA corresponding to the frequency of TIV-specific ASCs in the dLN. (J) Frequency of TIV-specific ASCs in the bone marrow on day 5-post boost injection. See also Figure S3
Figure 4. Multiple Types of Bacteria Are Necessary to Mediate Antibody Response to TIV
(A–D) Composition of the microbiota in antibiotics-treated or untreated mice. Diversity and specific bacterial components of the host microbiota were assessed using genomic bacterial DNA sequence analyses as described in Experimental Procedures. (A) Relative abundance of specific bacterial phyla present in the two mouse groups. (B) Unweighted Unifrac principal coordinate analyses using the QIIME analysis software. (C) Rarefaction curves for untreated or antibiotics treated (ATB) groups generated based on the sequenced 16S rRNA gene libraries. Data are depicted as the number of unique operational taxonomic units (OTUs). (D) A “nearest-shrunken centroid” classification analyses identifying bacterial taxa groups highly represented in either of the two clustered groups. Data shown are relative abundance of each OTU identified by this classification method represented in a heat map (white (least abundance) to red (most abundant)). (E) TIV-specific IgG concentrations on day 7-post vaccination in mice untreated or treated with either vancomycin or polymixin B. Raw O.D. values shown were obtained using serum diluted by a factor of 1:200. (F) TIV-specific IgG concentrations in mice treated with antibiotics or with neomycin alone. Raw O.D. values shown were obtained using serum diluted by a factor of 1:200 and expressed as means ± SEM. See also Figure S4.
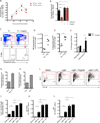
Figure 5. Cellular Targets of TLR5 Activation following TIV vaccination
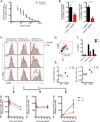
(A) TIV-specific IgG antibody response in WT or_Tlr5−/−_ bone marrow chimeric mice. Raw O.D. values were obtained using serum diluted at 1:100 and expressed as means ± SEM. (B) TIV-specific IgG concentrations in antibiotics-treated or untreated mice vaccinated with TIV alone or mixed with flagellin (day 7). Raw O.D. values were obtained using serum diluted at 1:100 and expressed as means ± SEM. Data are representative of three independent experiments. (C–F) WT mice were vaccinated with TIV alone or mixed with flagellin. dLNs were examined on day 7-post vaccination. (C) Dot plots shown represent a population of CD45+TCRβ− gated cells (top panel) and concentrations of intracellular IgG in CD138+ B cells (bottom panel). (D) Levels of intracellular IgG in CD138+ B cells are represented as the mean fluorescence intensity values. (E) Relative frequencies IgG producing CD138+ B cells (F) Relative frequencies of plasmablasts (CD138+B220+) and short-lived PCs (CD138+ B220low) as depicted in (C, top panel). (G) TLR5 expression in naïve B cells and plasmablast/short-lived PC (Pb/SL-PC) cells analyzed by qRT-PCR. Data represent mean TLR5 mRNA (normalized to GAPDH) in arbitrary units ± SEM. Data shown are one of three independently sorted B cell samples assayed in triplicates. (H) TLR5 expression in in vitro stimulated B cells analyzed as in (G). Data shown are representative of two independent experiments. (I–L) In vitro stimulated B cells in the presence of flagellin or LPS following 6 days in culture. Data shown are representative of two independent experiments. (I) Representative dot plots depicting gating and relative frequencies of CD138+ B cells. (J) Relative frequencies of CD138+ B cells (plasmablast/SL-PC). (K) Amount of secreted of IgG and IgM (L) in culture supernatant samples assayed by ELISA at a dilution of 1:400. Data are expressed as the means ± SEM. See also Figure S5.
Figure 6. Flagellin activates multiple subsets of macrophages in the LN and induces IL-6 production in macrophages via TLR5
(A) TIV-specific serum IgG levels at day 7-post vaccination in WT mice pre-treated with clodrosome or encapsome. Data shown are representative of two independent experiments and are expressed as the means ± SEM. (B) TIV-specific serum IgG1 levels in LysMCre+ MyD88loxp or Cre- MyD88loxp mice at day 7-post vaccination. Two independent experiments are shown. Raw O.D. values were obtained using serum diluted by a factor of 1:100. (C) Levels of CD86 expression on macrophage subsets in the dLN of mice following flagellin injection. The three major macrophage subsets in the LN were examined based on expression profiles of the following surface markers: CD169+F/80− (SSM), CD169+F4/80+ (MSM), CD169-F4/80+ (MCM) within CD11c-Ly6C- gated population of cells. Shown are representative histograms of surface CD86 levels (top) and the kinetics of CD86 MFI values shown as the means ± SEM (bottom). (D–F) Flow-sorted macrophages were stimulated in vitro with flagellin for 24 hours. (D) Representative dot plot depicts purity of macrophage isolation expressed in percent of gated cells. (E) Relative frequencies of CD86+ cells or MFI values of CD86 expression (F) Levels of IL-6 in culture supernatants expressed as means ± SEM. Data shown are representative of three independent experiments. See also Figure S6.
Figure 7. Level of Impact Microbiota Invokes on Antibody Responses Is Vaccine-specific
(A) Magnitude of vaccine-specific IgG responses in antibiotics treated or untreated mice. Raw O.D. values shown were obtained using serum diluted by a factor of 1:100. Data are expressed as the means ± SEM. Data shown are representative of two independent experiments. (B) Levels of vaccine-specific serum IgG in_Tlr5−/−_ or littermate WT mice. Serum samples diluted by 1:50 were assayed on day 7 (TIV, IPOL) and day 14 (Recombivax HB, YF-17D) post vaccination. Data shown are representative of two independent experiments.
Comment in
- Microbiota: A 'natural' vaccine adjuvant.
Minton K. Minton K. Nat Rev Immunol. 2014 Oct;14(10):650-1. doi: 10.1038/nri3745. Epub 2014 Sep 19. Nat Rev Immunol. 2014. PMID: 25234145 No abstract available. - Gut microbiota: a natural adjuvant for vaccination.
Pabst O, Hornef M. Pabst O, et al. Immunity. 2014 Sep 18;41(3):349-351. doi: 10.1016/j.immuni.2014.09.002. Immunity. 2014. PMID: 25238091
Similar articles
- Gut microbiota: a natural adjuvant for vaccination.
Pabst O, Hornef M. Pabst O, et al. Immunity. 2014 Sep 18;41(3):349-351. doi: 10.1016/j.immuni.2014.09.002. Immunity. 2014. PMID: 25238091 - Gut microbiota influence immunity to vaccination.
[No authors listed] [No authors listed] Hum Vaccin Immunother. 2014;10(11):3104. Hum Vaccin Immunother. 2014. PMID: 25789366 No abstract available. - Programming the magnitude and persistence of antibody responses with innate immunity.
Kasturi SP, Skountzou I, Albrecht RA, Koutsonanos D, Hua T, Nakaya HI, Ravindran R, Stewart S, Alam M, Kwissa M, Villinger F, Murthy N, Steel J, Jacob J, Hogan RJ, García-Sastre A, Compans R, Pulendran B. Kasturi SP, et al. Nature. 2011 Feb 24;470(7335):543-7. doi: 10.1038/nature09737. Nature. 2011. PMID: 21350488 Free PMC article. - Differences in antibody responses between trivalent inactivated influenza vaccine and live attenuated influenza vaccine correlate with the kinetics and magnitude of interferon signaling in children.
Cao RG, Suarez NM, Obermoser G, Lopez SM, Flano E, Mertz SE, Albrecht RA, García-Sastre A, Mejias A, Xu H, Qin H, Blankenship D, Palucka K, Pascual V, Ramilo O. Cao RG, et al. J Infect Dis. 2014 Jul 15;210(2):224-33. doi: 10.1093/infdis/jiu079. Epub 2014 Feb 4. J Infect Dis. 2014. PMID: 24495909 Free PMC article. - Linking genetic variation in human Toll-like receptor 5 genes to the gut microbiome's potential to cause inflammation.
Leifer CA, McConkey C, Li S, Chassaing B, Gewirtz AT, Ley RE. Leifer CA, et al. Immunol Lett. 2014 Dec;162(2 Pt A):3-9. doi: 10.1016/j.imlet.2014.07.017. Epub 2014 Oct 2. Immunol Lett. 2014. PMID: 25284610 Free PMC article. Review.
Cited by
- Crosstalk Between Lung and Extrapulmonary Organs in Infection and Inflammation.
Wang Z, Pu Q, Huang C, Wu M. Wang Z, et al. Adv Exp Med Biol. 2021;1303:333-350. doi: 10.1007/978-3-030-63046-1_18. Adv Exp Med Biol. 2021. PMID: 33788201 Review. - Strategies for Immunomonitoring after Vaccination and during Infection.
Adam L, Rosenbaum P, Bonduelle O, Combadière B. Adam L, et al. Vaccines (Basel). 2021 Apr 9;9(4):365. doi: 10.3390/vaccines9040365. Vaccines (Basel). 2021. PMID: 33918841 Free PMC article. Review. - Attenuated Streptococcus agalactiae WC1535 ∆Sia perturbs the gut microbiota of Oreochromis niloticus, massively colonizes the intestine, and induces intestinal mucosal immunity after intraperitoneal inoculation.
Hao J, Wang S, Yang J, Zhang Q, Wu Z, Zhang D, Li A. Hao J, et al. Front Microbiol. 2022 Nov 11;13:1036432. doi: 10.3389/fmicb.2022.1036432. eCollection 2022. Front Microbiol. 2022. PMID: 36439833 Free PMC article. - Dynamic modulation of spleen germinal center reactions by gut bacteria during Plasmodium infection.
Mandal RK, Denny JE, Namazzi R, Opoka RO, Datta D, John CC, Schmidt NW. Mandal RK, et al. Cell Rep. 2021 May 11;35(6):109094. doi: 10.1016/j.celrep.2021.109094. Cell Rep. 2021. PMID: 33979614 Free PMC article. - The Impact of the Microbiome on Immunity to Vaccination in Humans.
de Jong SE, Olin A, Pulendran B. de Jong SE, et al. Cell Host Microbe. 2020 Aug 12;28(2):169-179. doi: 10.1016/j.chom.2020.06.014. Cell Host Microbe. 2020. PMID: 32791110 Free PMC article. Review.
References
- Abreu MT. Toll-like receptor signalling in the intestinal epithelium: how bacterial recognition shapes intestinal function. Nature reviews. Immunology. 2010;10:131–144. - PubMed
- Atarashi K, Tanoue T, Oshima K, Suda W, Nagano Y, Nishikawa H, Fukuda S, Saito T, Narushima S, Hase K, et al. Treg induction by a rationally selected mixture of Clostridia strains from the human microbiota. Nature. 2013;500:232–236. - PubMed
Publication types
MeSH terms
Substances
Grants and funding
- R37 AI048638/AI/NIAID NIH HHS/United States
- R38 AI140299/AI/NIAID NIH HHS/United States
- U19 AI090023/AI/NIAID NIH HHS/United States
- P51 OD011132/OD/NIH HHS/United States
- R01 AI085263/AI/NIAID NIH HHS/United States
- R56 AI048638/AI/NIAID NIH HHS/United States
- U54AI057157/AI/NIAID NIH HHS/United States
- R37 DK057665/DK/NIDDK NIH HHS/United States
- AI100663-02/AI/NIAID NIH HHS/United States
- R37AI48638/AI/NIAID NIH HHS/United States
- R56 AI085263/AI/NIAID NIH HHS/United States
- P30 DK34987/DK/NIDDK NIH HHS/United States
- R37DK057665/DK/NIDDK NIH HHS/United States
- R01 DK099071/DK/NIDDK NIH HHS/United States
- P40 OD010995/OD/NIH HHS/United States
- U19AI090023/AI/NIAID NIH HHS/United States
- U19 AI057266/AI/NIAID NIH HHS/United States
- P30 DK034987/DK/NIDDK NIH HHS/United States
- U19AI057266/AI/NIAID NIH HHS/United States
- DK083890/DK/NIDDK NIH HHS/United States
- R01 DK083890/DK/NIDDK NIH HHS/United States
- AI085263/AI/NIAID NIH HHS/United States
- R01 AI048638/AI/NIAID NIH HHS/United States
- DK099071/DK/NIDDK NIH HHS/United States
LinkOut - more resources
Full Text Sources
Other Literature Sources
Medical
Molecular Biology Databases
