Body composition and mortality after adult lung transplantation in the United States - PubMed (original) (raw)
. 2014 Nov 1;190(9):1012-21.
doi: 10.1164/rccm.201405-0973OC.
Eric R Peterson, Mark E Snyder, Patricia P Katz, Jeffrey A Golden, Frank D'Ovidio, Matthew Bacchetta, Joshua R Sonett, Jasleen Kukreja, Lori Shah, Hilary Robbins, Kristin Van Horn, Rupal J Shah, Joshua M Diamond, Nancy Wickersham, Li Sun, Steven Hays, Selim M Arcasoy, Scott M Palmer, Lorraine B Ware, Jason D Christie, David J Lederer
Affiliations
- PMID: 25233138
- PMCID: PMC4299586
- DOI: 10.1164/rccm.201405-0973OC
Body composition and mortality after adult lung transplantation in the United States
Jonathan P Singer et al. Am J Respir Crit Care Med. 2014.
Abstract
Rationale: Obesity and underweight are contraindications to lung transplantation based on their associations with mortality in studies performed before implementation of the lung allocation score (LAS)-based organ allocation system in the United States Objectives: To determine the associations of body mass index (BMI) and plasma leptin levels with survival after lung transplantation.
Methods: We used multivariable-adjusted regression models to examine associations between BMI and 1-year mortality in 9,073 adults who underwent lung transplantation in the United States between May 2005 and June 2011, and plasma leptin and mortality in 599 Lung Transplant Outcomes Group study participants. We measured body fat and skeletal muscle mass using whole-body dual X-ray absorptiometry in 142 adult lung transplant candidates.
Measurements and main results: Adjusted mortality rates were similar among normal weight (BMI 18.5-24.9 kg/m(2)), overweight (BMI 25.0-29.9), and class I obese (BMI 30-34.9) transplant recipients. Underweight (BMI < 18.5) was associated with a 35% increased rate of death (95% confidence interval, 10-66%). Class II-III obesity (BMI ≥ 35 kg/m(2)) was associated with a nearly twofold increase in mortality (hazard ratio, 1.9; 95% confidence interval, 1.3-2.8). Higher leptin levels were associated with increased mortality after transplant surgery performed without cardiopulmonary bypass (P for interaction = 0.03). A BMI greater than or equal to 30 kg/m(2) was 26% sensitive and 97% specific for total body fat-defined obesity.
Conclusions: A BMI of 30.0-34.9 kg/m(2) is not associated with 1-year mortality after lung transplantation in the LAS era, perhaps because of its low sensitivity for obesity. The association between leptin and mortality suggests the need to validate alternative methods to measure obesity in candidates for lung transplantation. A BMI greater than or equal to 30 kg/m(2) may no longer contraindicate lung transplantation.
Keywords: adiposity; biomarker; leptin; obesity; sarcopenia.
Figures
Figure 1.
Study flow for (A) Organ Procurement and Transplantation Network, (B) Lung Transplant Body Composition, and (C) Lung Transplant Outcomes Group cohorts. DXA = dual X-ray absorptiometry.
Figure 2.
(A) Continuous association between pretransplant body mass index (BMI) and the risk of death 1 year after lung transplantation, and predicted 1-year mortality curves by BMI category (B) overall and for subgroups with (C) chronic obstructive pulmonary disease and (D) interstitial lung disease. In_A_, the thick dotted line = smoothed regression line adjusted for age, diagnosis, lung allocation score, transplant type (single or bilateral lung), ischemic time, mechanical ventilation at the time of transplant, and transplant center. Thin dashed lines_= 95% confidence intervals. The vertical hash marks in the rug plot at the bottom represent unique study participants. The_P value for linearity is 0.02, supporting a nonlinear association between body mass index and risk of mortality at 1 year. The_P_ value for the linear association is 0.80. The wide confidence intervals at the extremes of BMI are caused by fewer transplant recipients with these values. In B–D, predicted survival estimates with covariates listed in the footnote to Table 1 set to their mean values (Model 3). Body mass index categories: underweight (BMI < 18.5), normal (BMI 18.5–24.9), overweight (BMI 25.0–29.9), obese class I (BMI 30.0–34.9), obese class II–III (BMI ≥ 35.0).
Figure 3.
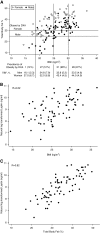
Scatterplots of (A) pretransplant body mass index (BMI) and percent body fat, (B) leptin and pretransplant BMI, and (C) leptin and pretransplant percent body fat in Lung Transplant Body Composition study participants. In A,vertical lines denote World Health Organization BMI categories: underweight (BMI < 18.5), normal (BMI 18.50–24.99), overweight (BMI 25.00–29.99), and obese (BMI ≥ 30.00).Horizontal lines are sex-specific thresholds for obesity defined by whole-body dual X-ray absorptiometry (DXA) (24). Table below: prevalence of obesity and mean (standard deviation) percent body fat within each BMI category. In_B_ and C, correlation coefficients are (B) r = 0.62 for leptin and BMI, and (C) r = 0.82 for leptin and percent body fat measured by whole-body DXA. TBF = total body fat.
Figure 4.
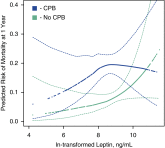
Continuous associations between pretransplant plasma leptin level and the predicted risk of death at 1 year after transplantation in the Lung Transplant Outcomes Group Cohort. Green = lung transplant recipients not exposed to cardiopulmonary bypass (CPB) during transplant surgery.Blue = lung transplant recipients exposed to CPB during transplant surgery. Thick dotted lines = smoothed regression lines in 599 adult lung transplant recipients adjusted for body mass index category, age, recipient sex, lung allocation score, diagnosis (chronic obstructive pulmonary disease includes α1-antitrypsin disease), donor sex, donor smoking history, ischemic time, transplant type (single vs. bilateral), mechanical ventilation, transplant year, and transplant center. Thin dashed lines = 95% confidence bands. Leptin levels were natural log transformed. CPB-stratified models are presented (P for interaction = 0.03). The _P_values for linearity are 0.15 for CPB users and 0.33 for nonusers, suggesting a lack of evidence that the associations are nonlinear. The _P_values for the association between leptin and mortality are 0.39 for CPB users and 0.03 for nonusers. These results suggest higher leptin levels are associated with an increased risk of death after lung transplantation among those who did not undergo CPB during transplant surgery.
Comment in
- Body composition, lung transplant candidacy, and patient outcomes.
Yusen RD. Yusen RD. Am J Respir Crit Care Med. 2014 Nov 1;190(9):971-3. doi: 10.1164/rccm.201410-1767ED. Am J Respir Crit Care Med. 2014. PMID: 25360725 No abstract available.
Similar articles
- Obesity and primary graft dysfunction after lung transplantation: the Lung Transplant Outcomes Group Obesity Study.
Lederer DJ, Kawut SM, Wickersham N, Winterbottom C, Bhorade S, Palmer SM, Lee J, Diamond JM, Wille KM, Weinacker A, Lama VN, Crespo M, Orens JB, Sonett JR, Arcasoy SM, Ware LB, Christie JD; Lung Transplant Outcomes Group. Lederer DJ, et al. Am J Respir Crit Care Med. 2011 Nov 1;184(9):1055-61. doi: 10.1164/rccm.201104-0728OC. Am J Respir Crit Care Med. 2011. PMID: 21799077 Free PMC article. - Obesity and underweight are associated with an increased risk of death after lung transplantation.
Lederer DJ, Wilt JS, D'Ovidio F, Bacchetta MD, Shah L, Ravichandran S, Lenoir J, Klein B, Sonett JR, Arcasoy SM. Lederer DJ, et al. Am J Respir Crit Care Med. 2009 Nov 1;180(9):887-95. doi: 10.1164/rccm.200903-0425OC. Epub 2009 Jul 16. Am J Respir Crit Care Med. 2009. PMID: 19608717 Free PMC article. - Association of body mass index with lung transplantation survival in the United States following implementation of the lung allocation score.
Fernandez R, Safaeinili N, Kurihara C, Odell DD, Jain M, DeCamp MM, Budinger GRS, Bharat A. Fernandez R, et al. J Thorac Cardiovasc Surg. 2018 Apr;155(4):1871-1879.e3. doi: 10.1016/j.jtcvs.2017.11.031. Epub 2017 Nov 20. J Thorac Cardiovasc Surg. 2018. PMID: 29249487 Free PMC article. - Underweight and obesity increase the risk of mortality after lung transplantation: a systematic review and meta-analysis.
Upala S, Panichsillapakit T, Wijarnpreecha K, Jaruvongvanich V, Sanguankeo A. Upala S, et al. Transpl Int. 2016 Mar;29(3):285-96. doi: 10.1111/tri.12721. Epub 2015 Dec 29. Transpl Int. 2016. PMID: 26613209 Review. - Optimizing Nutrition Assessment to Create Better Outcomes in Lung Transplant Recipients: A Review of Current Practices.
Weber Gulling M, Schaefer M, Bishop-Simo L, Keller BC. Weber Gulling M, et al. Nutrients. 2019 Nov 27;11(12):2884. doi: 10.3390/nu11122884. Nutrients. 2019. PMID: 31783495 Free PMC article. Review.
Cited by
- Body mass Index does not impact long-term survival of patients with idiopathic pulmonary fibrosis undergoing lung transplantation.
Lushaj EB, DeCamp MM, Maloney J, Leverson G, De Oliveira N, McCarthy D. Lushaj EB, et al. Front Transplant. 2023 Aug 23;2:1146779. doi: 10.3389/frtra.2023.1146779. eCollection 2023. Front Transplant. 2023. PMID: 38993923 Free PMC article. - Evaluating the effect of sodium alginate and sodium carboxymethylcellulose on pulmonary delivery of levofloxacin spray-dried microparticles.
Alizadeh H, Khoshhal P, Mirmoeini MS, Gilani K. Alizadeh H, et al. Daru. 2024 Jul 2. doi: 10.1007/s40199-024-00526-x. Online ahead of print. Daru. 2024. PMID: 38955893 - Baseline Lung Allograft Dysfunction After Bilateral Lung Transplantation Is Associated With an Increased Risk of Death: Results From a Multicenter Cohort Study.
Keller MB, Sun J, Alnababteh M, Ponor L, D Shah P, Mathew J, Kong H, Charya A, Luikart H, Aryal S, Nathan SD, Orens JB, Khush KK, Kyoo Jang M, Agbor-Enoh S. Keller MB, et al. Transplant Direct. 2024 Jun 26;10(7):e1669. doi: 10.1097/TXD.0000000000001669. eCollection 2024 Jul. Transplant Direct. 2024. PMID: 38953039 Free PMC article. - Nocturnal Hypoxemia Is Associated with Sarcopenia in Patients with Chronic Obstructive Pulmonary Disease.
Attaway AH, Mehra R, Zein JG, Hatipoğlu U, Grund M, Orsini E, Scheraga RG, Dasarathy S, Olman MA. Attaway AH, et al. Ann Am Thorac Soc. 2024 Sep;21(9):1316-1325. doi: 10.1513/AnnalsATS.202312-1062OC. Ann Am Thorac Soc. 2024. PMID: 38843487 - Impact of recipient and donor pretransplantation body mass index on early postosperative complications after lung transplantation.
Atchade E, De Tymowski C, Lepitre E, Zappella N, Snauwaert A, Jean-Baptiste S, Tran-Dinh A, Lortat-Jacob B, Messika J, Mal H, Mordant P, Castier Y, Tanaka S, Montravers P. Atchade E, et al. BMC Pulm Med. 2024 Apr 3;24(1):161. doi: 10.1186/s12890-024-02977-z. BMC Pulm Med. 2024. PMID: 38570744 Free PMC article.
References
- Yusen RD, Christie JD, Edwards LB, Kucheryavaya AY, Benden C, Dipchand AI, Dobbels F, Kirk R, Lund LH, Rahmel AO, et al. International Society for Heart and Lung Transplantation. The Registry of the International Society for Heart and Lung Transplantation: thirtieth adult lung and heart-lung transplant report–2013; focus theme: age. J Heart Lung Transplant. 2013;32:965–978. - PubMed
- Orens JB, Estenne M, Arcasoy S, Conte JV, Corris P, Egan JJ, Egan T, Keshavjee S, Knoop C, Kotloff R, et al. Pulmonary Scientific Council of the International Society for Heart and Lung Transplantation. International guidelines for the selection of lung transplant candidates: 2006 update—a consensus report from the Pulmonary Scientific Council of the International Society for Heart and Lung Transplantation. J Heart Lung Transplant. 2006;25:745–755. - PubMed
- World Health OrganizationObesity: preventing and managing the global epidemic. Geneva: World Health Organization; 2000 - PubMed
- Kanasky WF, Jr, Anton SD, Rodrigue JR, Perri MG, Szwed T, Baz MA. Impact of body weight on long-term survival after lung transplantation. Chest. 2002;121:401–406. - PubMed
Publication types
MeSH terms
Substances
Grants and funding
- P60 AR053308/AR/NIAMS NIH HHS/United States
- R01 HL087115/HL/NHLBI NIH HHS/United States
- R01 HL081619/HL/NHLBI NIH HHS/United States
- K23 HL111115/HL/NHLBI NIH HHS/United States
- T32 HL007586/HL/NHLBI NIH HHS/United States
- UL1 RR024131/RR/NCRR NIH HHS/United States
- R01 HL114626/HL/NHLBI NIH HHS/United States
- T32 HL007891/HL/NHLBI NIH HHS/United States
- UL1RR024131/RR/NCRR NIH HHS/United States
- T32 HL072739/HL/NHLBI NIH HHS/United States
- UL1 TR000040/TR/NCATS NIH HHS/United States
- HL088263/HL/NHLBI NIH HHS/United States
- R01 HL088263/HL/NHLBI NIH HHS/United States
- UL1 TR000004/TR/NCATS NIH HHS/United States
- U01 HL081332/HL/NHLBI NIH HHS/United States
- HL081332/HL/NHLBI NIH HHS/United States
- K23 HL121406/HL/NHLBI NIH HHS/United States
LinkOut - more resources
Full Text Sources
Other Literature Sources
Medical


