PGC-1α mediates mitochondrial biogenesis and oxidative phosphorylation in cancer cells to promote metastasis - PubMed (original) (raw)
. 2014 Oct;16(10):992-1003, 1-15.
doi: 10.1038/ncb3039. Epub 2014 Sep 21.
Joyce T O'Connell 2, Karina N Gonzalez Herrera 3, Harriet Wikman 4, Klaus Pantel 4, Marcia C Haigis 3, Fernanda Machado de Carvalho 5, Aline Damascena 5, Ludmilla Thome Domingos Chinen 5, Rafael M Rocha 5, John M Asara 6, Raghu Kalluri 1
Affiliations
- PMID: 25241037
- PMCID: PMC4369153
- DOI: 10.1038/ncb3039
PGC-1α mediates mitochondrial biogenesis and oxidative phosphorylation in cancer cells to promote metastasis
Valerie S LeBleu et al. Nat Cell Biol. 2014 Oct.
Erratum in
- Nat Cell Biol. 2014 Nov;16(11):1125
Abstract
Cancer cells can divert metabolites into anabolic pathways to support their rapid proliferation and to accumulate the cellular building blocks required for tumour growth. However, the specific bioenergetic profile of invasive and metastatic cancer cells is unknown. Here we report that migratory/invasive cancer cells specifically favour mitochondrial respiration and increased ATP production. Invasive cancer cells use the transcription coactivator peroxisome proliferator-activated receptor gamma, coactivator 1 alpha (PPARGC1A, also known as PGC-1α) to enhance oxidative phosphorylation, mitochondrial biogenesis and the oxygen consumption rate. Clinical analysis of human invasive breast cancers revealed a strong correlation between PGC-1α expression in invasive cancer cells and the formation of distant metastases. Silencing of PGC-1α in cancer cells suspended their invasive potential and attenuated metastasis without affecting proliferation, primary tumour growth or the epithelial-to-mesenchymal program. Inherent genetics of cancer cells can determine the transcriptome framework associated with invasion and metastasis, and mitochondrial biogenesis and respiration induced by PGC-1α are also essential for functional motility of cancer cells and metastasis.
Figures
Figure 1. Circulating cancer cells (CCC) exhibit enhanced oxidative phosphorylation
A. 4T1-GFP+ cells were injected orthotopically in the mammary fat pad of mice and primary tumor cancer cells (PCC), circulating cancer cells (CCC) and cancer cells from lung metastases (MCC) were purified by FACS sorting for gene expression profiling assay. B. Representative image of CCC isolated from 4T1 orthotopic tumor model based on their GFP expression. Scale bar: 10 μm. C. Heat map of differentially regulated genes in the oxidative phosphorylation gene set in PCC, CCC and MCC. D. Pathway analyses of transcriptomes of CCC compared to PCC identify oxidative phosphorylation as the most differentially regulated gene set. Actin cytoskeleton signaling, pyrimidine and purine metabolism pathways were also significantly differentially regulated in CCC compared to PCC, while all other metabolic pathways were only minimally changed.
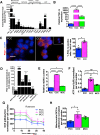
Figure 2. CCC display increased oxygen consumption rate associated with PGC-1α expression and mitochondria biogenesis
A. Quantitative PCR analyses of relative expression of indicated genes in CCC normalized to PCC. Genes were grouped based on known association with mitochondria biogenesis, oxidative phosphorylation, thermogenesis, lipid biosynthesis, and epithelial to mesenchymal transition (EMT). #: no transcript was detected (n=5 RNA samples from 5 mice, unpaired two-tailed Student's t-test). B. Relative PGC-1α expression by quantitative PCR analysis in CCC compared to PCC in mice with 4T1 orthotopic tumors (n=5 RNA samples from 5 mice, one-way ANOVA). C. Immunostaining for PGC-1α of cytospin of PCC and CCC and quantification of relative percent of PGC-1α positive cells. Scale bars: 10 μm. Nuclear staining (DAPI, blue) (n=3 average percent positive cells from 3 mice, unpaired two-tailed Student's t-test). D. Relative PGC-1α expression by quantitative PCR analysis in CCC compared to PCC in indicated orthotopic tumor models. # (normal blood): no PGC-1α expression detected (n=5 RNA samples from 5 mice, unpaired two-tailed Student's t-test). E. mitochondrial DNA (mtDNA) content (n=5 DNA samples from 5 mice, one-way ANOVA), F. intracellular ATP levels (n=3 lysates from 3 mice, one-way ANOVA), G. oxygen consumption rate (OCR), and H. mitochondrial OCR (delta OCR pre and post rotenone treatment) in PCC, CCC and MCC from 4T1 orthotopic tumor model (n=3 wells of cells from 3 mice, one-way ANOVA). Data is represented as mean +/− SEM. ns: not significant. * p<0.05, ** p<0.01, ** p< 0.001, ****p < 0.0001.
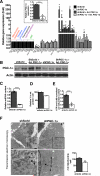
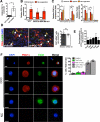
Figure. 3. PGC-1α expression is associated with mitochondria respiration and biogenesis in cancer cells
A. Real-time PCR analyses of relative expression of indicated genes in 4T1shPGC-1α normalized to 4T1shScrbl cells, and 4T1shPGC-1α and 4T1shScrbl cells with adenoviral over-expression of PGC-1α(Ad. PGC1α), also normalized to 4T1shScrbl cells (arbitrarily set to 1). Insert shows PGC-1α expression specifically in 4T1shScrbl and 4T1shPGC-1α cells (n=3 RNA samples from cells, unpaired two-tailed Student's t-test, * p<0.05). B. Western blot for PGC-1α in indicated cells/treatment. See also Supplementary Figure 9. C. Mitochondrial DNA (mtDNA) content (n=3 DNA samples from cells, unpaired two-tailed Student's t-test, see also Supplementary Figure 9) and D. mitochondrial protein content relative to total cell protein content in 4T1shPGC1α normalized to 4T1shScrbl cells (n=2 extracted cell lysates). E. Intracellular ATP levels in 4T1shPGC1α normalized to 4T1shScrbl cells (n=3, unpaired two-tailed Student's t-test). F. Transmission electron microscopy of 4T1 shScrbl and shPG1α, white arrowheads and ‘M’ identify mitochondria. Scale bar upper panel: 2 μm, insert and lower panel: 500 nm. Quantitation of the number of mitochondria per cell (shScrbl, n=9 cells; shPGC-1α, n=6 cells, unpaired two-tailed Student's t-test). Data is represented as mean +/− SEM. * p<0.05, *** p< 0.001.
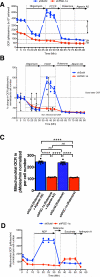
Figure 4. PGC-1α expression modulates complex I-driven oxidative phosphorylation in 4T1 cancer cells
A. Relative oxygen consumption rate (OCR) normalized to cell number over time in 4T1shPGC-1α (n=4 wells) and 4T1shScrbl (n=6 wells) cells. 1: differential basal state OCR; 2: differential non-mitochondrial OCR. B. Percent change in OCR normalized per cell number in in 4T1shPGC-1α (n=4 wells) and 4T1shScrbl (n=6 wells) cells. a: initial OCR; b and b’: percent OCR used for ATP synthesis in 4T1shScrbl and 4T1shPGC-1α cells respectively; c and c’: percent OCR associated with proton leakage in 4T1shScrbl and 4T1shPGC-1α cells respectively; d and d’: maximum mitochondria respiratory capacity 4T1shScrbl and 4T1shPGC-1α cells respectively. C. Mitochondrial OCR (delta OCR pre and post rotenone with or without atpenin A5 treatment) in 4T1shPGC-1α (n=4) and 4T1shScrbl (n=6 wells) cells, one-way ANOVA. D. OCR measurements in permeabilized 4T1 shScrbl and shPGC1-α cells (n=3 wells per cell line). Data is represented as mean +/− SEM. ns: not significant. * p<0.05, **** p< 0.0001.
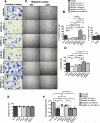
Figure 5. PGC-1α expression modulates cancer cell invasion and migration
A. Hematoxylin stained 4T1 cells (scale bar: 50 μm) following invasion and B. quantitation of invasion assay. Ad. PGC-1α: adenoviral induction of PGC-1α expression (n=6 wells/group, one-way ANOVA). Ad. Contrl.: adeonovirus with empty pcDNA vector control (n=6 wells/group, unpaired two-tailed Student's t-test) C. Light microscopy imaging (scale bar: 50 μm) of migrated cells in scratch assay and D. quantitation of migration assay (n=5 wells/group, one-way ANOVA). E. Proliferation rate (n=4 cell numbers measured over time/group, one-way ANOVA) and. F. type I collagen gel area reflecting gel contraction by indicated cells (n=4 wells/group, unpaired two-tailed Student's t-test). Data is represented as mean +/− SEM. ns: not significant. * p<0.05, ** p<0.01, *** p< 0.001, ****p < 0.0001.
Figure 6. Loss of PGC-1α expression suppresses cancer cell dissemination and metastasis
A. 4T1shScrbl and 4T1shPGC-1α cells were implanted in the mammary fat pad of mice and tumor volume was measured over time (4T1shScrbl, n=6 mice; 4T1shPGC-1α, n=7 mice). B. Tumor weight at experimental endpoint (4T1shScrbl, n=6 mice; 4T1shPGC-1α, n=7 mice, unpaired two-tailed Student's t-test). C. Percent of GFP+ cancer cells per 200μl blood collected at experimental endpoint 4T1shScrbl, n=6 mice; 4T1shPGC-1α, n=6 mice, unpaired two-tailed Student's t-test). D. Number of CCC colonies formed (4T1shScrbl, n=6 mice; 4T1shPGC-1α, n=7 mice, unpaired two-tailed Student's t-test). E. Number of lung surface nodules in of mice with orthotopic 4T1shScrbl and 4T1shPGC-1α tumors (4T1shScrbl, n=6 mice; 4T1shPGC-1α, n=7 mice, unpaired two-tailed Student's t-test). F. Representative images of H&E stained lung sections of mice harboring orthotopic 4T1shScrbl and 4T1shPGC-1α tumors and percent metastatic lung surface area relative to total lung surface area. Scale bar: 50μm. Metastatic lung nodules are encircled. (4T1shScrbl, n=6 mice; 4T1shPGC-1α, n=7 mice, unpaired two-tailed Student's t-test). G. Percent alive cells in anoikis assay (n=3 percent live cell measurements, unpaired two-tailed Student's t-test). H. Representative images of H&E stained lung sections of mice with intravenous injection of 4T1shScrbl and 4T1shPGC-1α cells and percent metastatic lung surface area relative to total lung surface area (4T1shScrbl, n=5 mice; 4T1shPGC-1α, n=6 mice, unpaired two-tailed Student's t-test). Scale bar: 50μm. Lung nodules are encircled. I. Number of lung surface nodules (4T1shScrbl, n=5 mice; 4T1shPGC-1α, n=6 mice, unpaired two-tailed Student's t-test). Data is represented as mean +/− SEM. ns: not significant. * p<0.05, *** p< 0.001.
Figure 7. PGC-1α expression is co-induced with an EMT program
A. PGC-1α expression in FACS purified GFP+/αSMA− and GFP+/αSMA+ cells from 4T1 primary tumor (n=3 RNA samples from FACS purified cells of 3 mice, unpaired two-tailed Student's t-test). * p<0.05. B PGC-1α expression in indicated cells cultured in normoxia and in re-oxygenation (24 hrs) following 48 hrs of hypoxia (n=3 RNA samples/cell line, unpaired two-tailed Student's t-test). * p<0.05. C. PGC-1α and Twist expression in 4T1shScrbl, 4T1shPGC-1α and 4T1shTwist cells cultured in normoxia, hypoxia (48 hrs), and re-oxygened (24 hrs) following 48 hrs of hypoxia (n=3 RNA samples/cell line, unpaired two-tailed Student's t-test). * p<0.05. #: p <0.05 for PGC-1α expression in 4T1shPGC-1α compared to 4T1shScrbl in normoxic condition, and for Twist expression in 4T1shTwist compared to 4T1shScrbl in normoxic condition. D. Representative CK8 (red) and αSMA (green) immunolabeling of the primary tumor. Nuclear staining (DAPI, blue). Arrowheads point to double positive (CK8+/αSMA+) cells. Scale bar: 100 μm. Bar graph: quantitation of number of CK8+/αSMA+ cells per field of view (n=4 stained slides of tumors from 4 mice, unpaired two-tailed Student's t-test). E. Relative expression of indicated genes in 4T1shPGC-1α tumors normalized to 4T1shScrbl tumors (n=5 RNA samples from tumors of 5 mice, unpaired two-tailed Student's t-test). F. Immunolabeling of cytopsin of 4T1 CCC for Twist and PGC-1α (n=4 mice). Scale bar: 10μm. NC: negative control, secondary antibody used only. Bar graph: Relative percentage of CCC negative for both Twist and PGC-1α, positive for Twist only (PGC-1α−), positive for PGC-1α only (Twist−), positive for both Twist and PGC-1α, and all PGC1a positive CCC (regardless of Twist status). Scale bars: 25μm (upper panel), 10μm (lower panel). Data is represented as mean +/− SEM. ns: not significant.
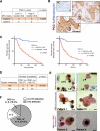
Figure 8. PGC-1α expression in circulating cancer cells correlates with invasion and distant metastasis in patients with IDC
A. Correlation of relative PGC-1α expression (median dCt value used as cut-off) in laser dissected neoplastic cells from resected tumors of patients with IDC and status of disseminated tumor cells (DTC) in the bone marrow (BM+: bone marrow is positive for DTC; BM−: bone marrow is negative for DTC). BM+ status, n=16 RNA samples from 16 patients; BM−status, n=14 RNA samples from 14 patients. (Supplementary Table 1, one-sided χ2 analysis). B. Immunohistochemistry staining for PGC-1α (haematoxylin counter stain) in breast tumors from patients with IDC. NC: negative control, secondary antibody and haematoxylin counter stain only. Arrowheads in zoomed-in insert point to the strongly positive PGC-1α cells found on the invasive edge. Scale bar: 50μm. C. Cancer specific survival and disease free survival of IDC patients grouped based on PGC-1α expression (Supplementary Table 2, log-rank test). D. Correlative analysis of the number of IDC patients with and without distant metastases categorized based on the indicated PGC-1α expression threshold (Supplementary Table 2, Fisher's exact test). Kaplan-Meier curves were drawn and differences between the curves were calculated by the log-rank test. E. Circulating cancer cell (“CTC”, right arrowhead) stains for the epithelial marker CK8, while leukocytes (“L”, left arrowhead) are negative for CK8 (upper left panel). Leukocytes are negative for PGC-1α (upper right panel). Insert shows (NC) negative control staining of a CTC (secondary antibody only). PGC-1α (patient 1 and 2) or CD45 and PGC-1α (patient 3 and 4) immunostaining of CTC (lower panels, Supplementary Table 3). Scale bar: 8μm. F. Representation of the PGC-1α+ CTC status evaluated by immunohistochemistry staining in IDC patients with lung metastasis (Supplementary Table 4).
Comment in
- Metastasis: metabolic reprogramming in disseminated cells.
Alderton GK. Alderton GK. Nat Rev Cancer. 2014 Nov;14(11):703. doi: 10.1038/nrc3842. Epub 2014 Oct 16. Nat Rev Cancer. 2014. PMID: 25319868 No abstract available.
Similar articles
- Shikonin blocks CAF-induced TNBC metastasis by suppressing mitochondrial biogenesis through GSK-3β/NEDD4-1 mediated phosphorylation-dependent degradation of PGC-1α.
Fan S, Yan X, Hu X, Liu X, Zhao S, Zhang Y, Zhou X, Shen X, Qi Q, Chen Y. Fan S, et al. J Exp Clin Cancer Res. 2024 Jun 27;43(1):180. doi: 10.1186/s13046-024-03101-z. J Exp Clin Cancer Res. 2024. PMID: 38937832 Free PMC article. - Androgens regulate prostate cancer cell growth via an AMPK-PGC-1α-mediated metabolic switch.
Tennakoon JB, Shi Y, Han JJ, Tsouko E, White MA, Burns AR, Zhang A, Xia X, Ilkayeva OR, Xin L, Ittmann MM, Rick FG, Schally AV, Frigo DE. Tennakoon JB, et al. Oncogene. 2014 Nov 6;33(45):5251-61. doi: 10.1038/onc.2013.463. Epub 2013 Nov 4. Oncogene. 2014. PMID: 24186207 Free PMC article. - MiR-485-3p and miR-485-5p suppress breast cancer cell metastasis by inhibiting PGC-1α expression.
Lou C, Xiao M, Cheng S, Lu X, Jia S, Ren Y, Li Z. Lou C, et al. Cell Death Dis. 2016 Mar 24;7(3):e2159. doi: 10.1038/cddis.2016.27. Cell Death Dis. 2016. PMID: 27010860 Free PMC article. - Peroxisome Proliferator-activated Receptor Gamma Coactivator-1 Alpha: A Double-edged Sword in Prostate Cancer.
Zheng K, Chen S, Hu X. Zheng K, et al. Curr Cancer Drug Targets. 2022;22(7):541-559. doi: 10.2174/1568009622666220330194149. Curr Cancer Drug Targets. 2022. PMID: 35362394 Review. - Role of PGC-1α in the proliferation and metastasis of malignant tumors.
Zhang T, Zhao S, Gu C. Zhang T, et al. J Mol Histol. 2025 Jan 30;56(2):77. doi: 10.1007/s10735-025-10360-3. J Mol Histol. 2025. PMID: 39881043 Review.
Cited by
- p53 increase mitochondrial copy number via up-regulation of mitochondrial transcription factor A in colorectal cancer.
Wen S, Gao J, Zhang L, Zhou H, Fang D, Feng S. Wen S, et al. Oncotarget. 2016 Nov 15;7(46):75981-75995. doi: 10.18632/oncotarget.12514. Oncotarget. 2016. PMID: 27732955 Free PMC article. - Targeting Metabolic Symbiosis to Overcome Resistance to Anti-angiogenic Therapy.
Pisarsky L, Bill R, Fagiani E, Dimeloe S, Goosen RW, Hagmann J, Hess C, Christofori G. Pisarsky L, et al. Cell Rep. 2016 May 10;15(6):1161-74. doi: 10.1016/j.celrep.2016.04.028. Epub 2016 Apr 28. Cell Rep. 2016. PMID: 27134168 Free PMC article. - Hypoxia-Induced CD36 Expression in Gastric Cancer Cells Promotes Peritoneal Metastasis via Fatty Acid Uptake.
Aoki T, Kinoshita J, Munesue S, Hamabe-Horiike T, Yamaguchi T, Nakamura Y, Okamoto K, Moriyama H, Nakamura K, Harada S, Yamamoto Y, Inaki N, Fushida S. Aoki T, et al. Ann Surg Oncol. 2023 May;30(5):3125-3136. doi: 10.1245/s10434-022-12465-5. Epub 2022 Aug 30. Ann Surg Oncol. 2023. PMID: 36042102 Free PMC article. - The metabolic role of the CD73/adenosine signaling pathway in HTR-8/SVneo cells: A Double-Edged Sword?
Song G, Zhang D, Zhu J, Wang A, Zhou X, Han TL, Zhang H. Song G, et al. Heliyon. 2024 Jan 29;10(3):e25252. doi: 10.1016/j.heliyon.2024.e25252. eCollection 2024 Feb 15. Heliyon. 2024. PMID: 38322906 Free PMC article. - The mechanisms of action of mitochondrial targeting agents in cancer: inhibiting oxidative phosphorylation and inducing apoptosis.
Yang Y, An Y, Ren M, Wang H, Bai J, Du W, Kong D. Yang Y, et al. Front Pharmacol. 2023 Oct 25;14:1243613. doi: 10.3389/fphar.2023.1243613. eCollection 2023. Front Pharmacol. 2023. PMID: 37954849 Free PMC article. Review.
References
- Warburg O. On the origin of cancer cells. Science. 1956 Feb 24;123:309. - PubMed
- DeBerardinis RJ, Lum JJ, Hatzivassiliou G, Thompson CB. The biology of cancer: metabolic reprogramming fuels cell growth and proliferation. Cell Metab. 2008 Jan;7:11. - PubMed
Publication types
MeSH terms
Substances
Grants and funding
- P30 CA016672/CA/NCI NIH HHS/United States
- U01 CA151925/CA/NCI NIH HHS/United States
- CA00651646/CA/NCI NIH HHS/United States
- CA16672/CA/NCI NIH HHS/United States
- CA151925/CA/NCI NIH HHS/United States
- CA12096405/CA/NCI NIH HHS/United States
- R01 CA125550/CA/NCI NIH HHS/United States
- R01 CA155370/CA/NCI NIH HHS/United States
- DK081576/DK/NIDDK NIH HHS/United States
- P30 CA006516/CA/NCI NIH HHS/United States
- P01 CA120964/CA/NCI NIH HHS/United States
- R01 DK081576/DK/NIDDK NIH HHS/United States
- CA155370/CA/NCI NIH HHS/United States
- DK055001/DK/NIDDK NIH HHS/United States
- CA125550/CA/NCI NIH HHS/United States
- R01 DK055001/DK/NIDDK NIH HHS/United States
LinkOut - more resources
Full Text Sources
Other Literature Sources
Molecular Biology Databases

