Regulation of cilium length and intraflagellar transport by the RCK-kinases ICK and MOK in renal epithelial cells - PubMed (original) (raw)
Regulation of cilium length and intraflagellar transport by the RCK-kinases ICK and MOK in renal epithelial cells
Joost R Broekhuis et al. PLoS One. 2014.
Abstract
Primary cilia are important sensory organelles. They exist in a wide variety of lengths, which could reflect different cell-specific functions. How cilium length is regulated is unclear, but it probably involves intraflagellar transport (IFT), which transports protein complexes along the ciliary axoneme. Studies in various organisms have identified the small, conserved family of ros-cross hybridizing kinases (RCK) as regulators of cilium length. Here we show that Intestinal Cell Kinase (ICK) and MAPK/MAK/MRK overlapping kinase (MOK), two members of this family, localize to cilia of mouse renal epithelial (IMCD-3) cells and negatively regulate cilium length. To analyze the effects of ICK and MOK on the IFT machinery, we set up live imaging of five fluorescently tagged IFT proteins: KIF3B, a subunit of kinesin-II, the main anterograde IFT motor, complex A protein IFT43, complex B protein IFT20, BBSome protein BBS8 and homodimeric kinesin KIF17, whose function in mammalian cilia is unclear. Interestingly, all five proteins moved at ∼0.45 µm/s in anterograde and retrograde direction, suggesting they are all transported by the same machinery. Moreover, GFP tagged ICK and MOK moved at similar velocities as the IFT proteins, suggesting they are part of, or transported by the IFT machinery. Indeed, loss- or gain-of-function of ICK affected IFT speeds: knockdown increased anterograde velocities, whereas overexpression reduced retrograde speed. In contrast, MOK knockdown or overexpression did not affect IFT speeds. Finally, we found that the effects of ICK or MOK knockdown on cilium length and IFT are suppressed by rapamycin treatment, suggesting that these effects require the mTORC1 pathway. Our results confirm the importance of RCK kinases as regulators of cilium length and IFT. However, whereas some of our results suggest a direct correlation between cilium length and IFT speed, other results indicate that cilium length can be modulated independent of IFT speed.
Conflict of interest statement
Competing Interests: The authors have declared that no competing interests exist.
Figures
Figure 1. ICK and MOK localize to the primary cilium.
IMCD-3 cells expressing (A) GFP-ICK and CFP-centrin-2, or (B) GFP-MOK and CFP-centrin-2, serum-starved for 48 hours and immunostained for acetylated tubulin (acTub). Insets show enlargements of the region containing the cilium. Scale bars 10 µm.
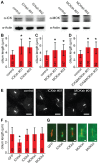
Figure 2. ICK and MOK control cilium length.
(A) Immunoblot of cell lysates of IMCD-3 cells transduced with shRNA constructs targeting ICK and MOK. Actin was used as loading control. (B) Average length of primary cilia of IMCD-3 cells depleted of ICK. (C) Average length of primary cilia of IMCD-3 cells depleted of MOK. (D) Average length of primary cilia of IMCD-3 cells depleted of ICK and MOK, combining ICKsh #01 and MOKsh #01 or ICKsh #02 and MOKsh #02. (E) Immunofluorescence images of IMCD-3 cells expressing control shRNA, ICKsh #01, or MOKsh #01 stained with anti-acetylated tubulin. Scale bar 10 µm. (F) Average length of primary cilia of IMCD-3 cells overexpressing GFP-C1, wild type (wt) or kinase-dead (kd) GFP-ICK, or GFP-MOK. (G) Immunofluorescence images of IMCD-3 cells expressing GFP-C1, wt or kd GFP-ICK, or GFP-MOK stained with anti-acetylated tubulin. Scale bar 1 µm. Numbers in the red bars indicate number of cilia measured. Data were obtained in at least 2 independent experiments. Statistically significant differences (p<0.001) compared to control cells are indicated with a black asterisk. Error bars indicate SD.
Figure 3. Live imaging of fluorescently tagged components of the IFT machinery.
(A) Fluorescence images of the cilia of IMCD-3 cells expressing mCit-KIF3B, IFT43-YFP, GFP-BBS8, IFT20-GFP, and KIF17-mCit. The basal body is indicated with an arrowhead. Scale bar 1 µm. (B) Representative kymograph of IFT43-YFP in cilia of control cells. The basal body (b.b.) and the distal tip (d.t.) of the cilium are indicated. In the corresponding drawing, anterograde trajectories are shown in red and retrograde trajectories are shown in blue. (C) Average anterograde and retrograde velocities of IFT components in control cells. Error bars indicate SD. Numbers in the bars indicate number of particles analyzed.
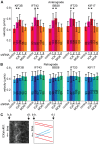
Figure 4. Depletion of ICK results in increased anterograde IFT velocity.
(A) Average anterograde velocities of IFT components in control cells, and cells depleted of ICK or MOK using two independent shRNA constructs for each. Statistically significant differences (p<0.001) compared to the velocity of the same IFT component in control cells are indicated with a black asterisk. (B) Average retrograde velocities of IFT components in control cells, and cells depleted of ICK and MOK. (C) Representative kymograph of IFT43-YFP in cells depleted of ICK. The basal body (b.b.) and the distal tip (d.t.) of the cilium are indicated. In the corresponding, drawing anterograde trajectories are shown in red and retrograde trajectories are shown in blue. Error bars indicate SD. Numbers in the bars indicate number of particles analyzed.
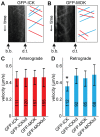
Figure 5. Overexpression of ICK results in decreased retrograde IFT velocity.
(A) Representative example of kymograph of GFP-ICK in IMCD-3 cells. The basal body (b.b.) and the distal tip (d.t.) of the cilium are indicated. In the corresponding drawing anterograde trajectories are shown in red, and retrograde trajectories are shown in blue. (B) Representative example of kymograph of GFP-MOK in IMCD-3 cells. The basal body (b.b.) and the distal tip (d.t.) of the cilium are indicated. In the corresponding drawing anterograde trajectories are shown in red, and retrograde trajectories are shown in blue. (C) Average anterograde velocities of wt or kd GFP-ICK or GFP-MOK. (D) Average retrograde velocities of wt or kd GFP-ICK or GFP-MOK. The velocity of GFP-ICK is statistically significantly different (p<0.001) from those of GFP-ICKkd and wt or kd GFP-MOK (indicated with a black asterisk). Error bars indicate SD. Numbers in the bars indicate number of particles analyzed.
Figure 6. Cilium length regulation by ICK and MOK interacts with cAMP and mTORC1 signaling.
(A) Average lengths of primary cilia of IMCD-3 cells expressing a control shRNA, ICKsh #01, or MOKsh #01, untreated or treated with 100 µM forskolin (Fsk) for 24 hours. (B) Immunofluorescence images of IMCD-3 cells expressing a control shRNA, ICKsh #01, or MOKsh #01, untreated or forskolin-treated, stained with anti-acetylated tubulin. (C) Average anterograde velocity of IFT20-GFP in IMCD-3 control cells, and cells depleted of ICK, untreated and forskolin-treated. (D) Average lengths of primary cilia of IMCD-3 cells expressing a control shRNA, ICKsh #01, or MOKsh #01, untreated or treated with 0.5 µM rapamycin (rapa) for 24 hours. (E) Immunofluorescence images of IMCD-3 cells expressing a control shRNA, ICKsh #01, or MOKsh #01, untreated or rapamycin-treated, stained with anti-acetylated tubulin. (F) Average anterograde velocity of IFT20-GFP in IMCD-3 control cells, and cells depleted of ICK, untreated and rapamycin-treated. Statistically significant differences (p<0.001) compared to untreated cells are indicated with a black asterisk, and compared to the control shRNA are indicated with a red asterisk. Error bars indicate SD. Numbers in the bars indicate number of cilia (A and D) or particles (C and F) analyzed. Scale bar, 10 µm.
Similar articles
- LF4/MOK and a CDK-related kinase regulate the number and length of cilia in Tetrahymena.
Jiang YY, Maier W, Baumeister R, Minevich G, Joachimiak E, Wloga D, Ruan Z, Kannan N, Bocarro S, Bahraini A, Vasudevan KK, Lechtreck K, Orias E, Gaertig J. Jiang YY, et al. PLoS Genet. 2019 Jul 24;15(7):e1008099. doi: 10.1371/journal.pgen.1008099. eCollection 2019 Jul. PLoS Genet. 2019. PMID: 31339880 Free PMC article. - ICK is essential for cell type-specific ciliogenesis and the regulation of ciliary transport.
Chaya T, Omori Y, Kuwahara R, Furukawa T. Chaya T, et al. EMBO J. 2014 Jun 2;33(11):1227-42. doi: 10.1002/embj.201488175. Epub 2014 May 5. EMBO J. 2014. PMID: 24797473 Free PMC article. - Acute Inhibition of Heterotrimeric Kinesin-2 Function Reveals Mechanisms of Intraflagellar Transport in Mammalian Cilia.
Engelke MF, Waas B, Kearns SE, Suber A, Boss A, Allen BL, Verhey KJ. Engelke MF, et al. Curr Biol. 2019 Apr 1;29(7):1137-1148.e4. doi: 10.1016/j.cub.2019.02.043. Epub 2019 Mar 21. Curr Biol. 2019. PMID: 30905605 Free PMC article. - Regulation of cilium length and intraflagellar transport.
Broekhuis JR, Leong WY, Jansen G. Broekhuis JR, et al. Int Rev Cell Mol Biol. 2013;303:101-38. doi: 10.1016/B978-0-12-407697-6.00003-9. Int Rev Cell Mol Biol. 2013. PMID: 23445809 Review. - Architecture of the IFT ciliary trafficking machinery and interplay between its components.
Nakayama K, Katoh Y. Nakayama K, et al. Crit Rev Biochem Mol Biol. 2020 Apr;55(2):179-196. doi: 10.1080/10409238.2020.1768206. Epub 2020 May 26. Crit Rev Biochem Mol Biol. 2020. PMID: 32456460 Review.
Cited by
- The novel ciliogenesis regulator DYRK2 governs Hedgehog signaling during mouse embryogenesis.
Yoshida S, Aoki K, Fujiwara K, Nakakura T, Kawamura A, Yamada K, Ono M, Yogosawa S, Yoshida K. Yoshida S, et al. Elife. 2020 Aug 6;9:e57381. doi: 10.7554/eLife.57381. Elife. 2020. PMID: 32758357 Free PMC article. - An inactivating mutation in intestinal cell kinase, ICK, impairs hedgehog signalling and causes short rib-polydactyly syndrome.
Paige Taylor S, Kunova Bosakova M, Varecha M, Balek L, Barta T, Trantirek L, Jelinkova I, Duran I, Vesela I, Forlenza KN, Martin JH, Hampl A; University of Washington Center for Mendelian Genomics; Bamshad M, Nickerson D, Jaworski ML, Song J, Ko HW, Cohn DH, Krakow D, Krejci P. Paige Taylor S, et al. Hum Mol Genet. 2016 Sep 15;25(18):3998-4011. doi: 10.1093/hmg/ddw240. Epub 2016 Jul 27. Hum Mol Genet. 2016. PMID: 27466187 Free PMC article. - Genome-wide association study and meta-analysis of phytosterols identifies a novel locus for serum levels of campesterol.
Alenbawi J, Al-Sarraj YA, Umlai UI, Kadhi A, Hendi NN, Nemer G, Albagha OME. Alenbawi J, et al. Hum Genomics. 2024 Aug 1;18(1):85. doi: 10.1186/s40246-024-00649-x. Hum Genomics. 2024. PMID: 39090729 Free PMC article. - Activation of sonic hedgehog signaling by a Smoothened agonist restores congenital defects in mouse models of endocrine-cerebro-osteodysplasia syndrome.
Shin JO, Song J, Choi HS, Lee J, Lee K, Ko HW, Bok J. Shin JO, et al. EBioMedicine. 2019 Nov;49:305-317. doi: 10.1016/j.ebiom.2019.10.016. Epub 2019 Oct 26. EBioMedicine. 2019. PMID: 31662288 Free PMC article. - Fibroblast growth factor receptor influences primary cilium length through an interaction with intestinal cell kinase.
Kunova Bosakova M, Nita A, Gregor T, Varecha M, Gudernova I, Fafilek B, Barta T, Basheer N, Abraham SP, Balek L, Tomanova M, Fialova Kucerova J, Bosak J, Potesil D, Zieba J, Song J, Konik P, Park S, Duran I, Zdrahal Z, Smajs D, Jansen G, Fu Z, Ko HW, Hampl A, Trantirek L, Krakow D, Krejci P. Kunova Bosakova M, et al. Proc Natl Acad Sci U S A. 2019 Mar 5;116(10):4316-4325. doi: 10.1073/pnas.1800338116. Epub 2019 Feb 19. Proc Natl Acad Sci U S A. 2019. PMID: 30782830 Free PMC article.
References
- Silverman MA, Leroux MR (2009) Intraflagellar transport and the generation of dynamic, structurally and functionally diverse cilia. Trends Cell Biol 19: 306–316. - PubMed
Publication types
MeSH terms
Substances
LinkOut - more resources
Full Text Sources
Other Literature Sources
Molecular Biology Databases


