Genomic and bioinformatic profiling of mutational neoepitopes reveals new rules to predict anticancer immunogenicity - PubMed (original) (raw)
. 2014 Oct 20;211(11):2231-48.
doi: 10.1084/jem.20141308. Epub 2014 Sep 22.
Jorge Duitama 2, Sahar Al Seesi 2, Cory M Ayres 3, Steven A Corcelli 3, Arpita P Pawashe 1, Tatiana Blanchard 1, David McMahon 1, John Sidney 4, Alessandro Sette 4, Brian M Baker 3, Ion I Mandoiu 5, Pramod K Srivastava 6
Affiliations
- PMID: 25245761
- PMCID: PMC4203949
- DOI: 10.1084/jem.20141308
Genomic and bioinformatic profiling of mutational neoepitopes reveals new rules to predict anticancer immunogenicity
Fei Duan et al. J Exp Med. 2014.
Abstract
The mutational repertoire of cancers creates the neoepitopes that make cancers immunogenic. Here, we introduce two novel tools that identify, with relatively high accuracy, the small proportion of neoepitopes (among the hundreds of potential neoepitopes) that protect the host through an antitumor T cell response. The two tools consist of (a) the numerical difference in NetMHC scores between the mutated sequences and their unmutated counterparts, termed the differential agretopic index, and (b) the conformational stability of the MHC I-peptide interaction. Mechanistically, these tools identify neoepitopes that are mutated to create new anchor residues for MHC binding, and render the overall peptide more rigid. Surprisingly, the protective neoepitopes identified here elicit CD8-dependent immunity, even though their affinity for K(d) is orders of magnitude lower than the 500-nM threshold considered reasonable for such interactions. These results greatly expand the universe of target cancer antigens and identify new tools for human cancer immunotherapy.
© 2014 Duan et al.
Figures
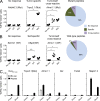
Figure 1.
Immunogenicity of epitopes generated by point mutations. Mice were immunized in the footpad with indicated mutant peptides. 1 wk later, draining LNs were harvested and their cells were stimulated overnight in vitro without peptides (No pep) or with mutated (Mut) peptides or their unmutated (WT) counterparts. Surface CD44 and intracellular IFN-γ+ cells were counted on 20,000-gated CD8+ cells. (A) Representative examples of mutant peptides that elicited no response, tumor-specific (i.e., mutant peptide specific) response, or tumor/self–cross-reactive response. The right pie chart shows the total percentage of each type of T cell response elicited by mutated peptides from Meth A (n = 39) and CMS5 (n = 27). (B) Representative examples of unmutated counterparts of selected mutant peptides that elicited no response, unmutated peptide-specific response, or cross-reactive functional CD8 response (as in A). The right pie chart shows the percentage of type of T cell response elicited by unmutated peptides from both tumors. (C) Mice were immunized 100 µg of the indicated peptide once (Prime), or twice (Boost) with a 29-d interval. 7 d after the last immunization, draining popliteal LNs were harvested for intracellular cytokine assay. Lymphocytes were stimulated, or without stimulation, with 10 µg/ml cognate peptides for 16 h and stained for CD4, CD8 and CD44, followed by permeabilization and staining for IFN-γ. Shown are the percent CD44+ IFN-γ+ cells of total CD8+ cells stimulated with peptides and without peptide stimulation (No pep). Error bars represent SEM. *, P < 0.05; ***, P < 0.001. Immunogenicity of each peptide was tested in two to four mice each and the experiments were performed between four and six times. See
Fig. S2
for FACS gating strategy and representative primary data.
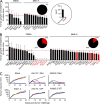
Figure 2.
Landscape of protective tumor immunity elicited by tumor-specific peptides. (A) Tumor-protective activity of the mutated epitopes with top NetMHC or DAI scores for CMS5 and Meth A. (A and B), Mice were immunized with peptides that had the highest NetMHC scores (A) or top DAI scores (B) and challenged with live tumor cells, and tumor growth monitored. Area under the curve (AUC; Duan et al., 2012) for each individual tumor growth curve was calculated and normalized by setting the naive group to a value of 100, shown by a horizontal red line. Bars corresponding to peptides that show statistically significant tumor-protective immunogenicity are filled in red, and indicated by an asterisk (P = 0.015–0.03). The peptides are arranged in order of increasing antitumor activity. The pie charts show the percentage of neoepitopes tested that did not (black) and did (red) elicit protection from tumor challenge. (C) Examples of tumor growth curves in untreated mice (naive) and mice immunized with indicated mutant peptides from CMS5 or their WT counterparts. Stau1.2 is a representative neoepitope that does not elicit protective immunity, whereas Atxn10.1 and Alkbh6.2 are representative neoepitopes that do. Each line shows the kinetics of tumor growth in a single mouse. The experiments were performed three times.
Figure 3.
Protective tumor immunity elicited by tumor-specific peptides is CD8-dependent. (A) Mice were immunized with mutant peptides Alkbh6.2, Slit3, and Atxn10.1, Atxn10.2, and Ccdc136. Draining LNs harvested 7 d after immunization were not stimulated or stimulated in vitro with the cognate peptides for 20 h, and were analyzed by ELISpot. Data for mice immunized with Alkbh6.2, Slit3, and Atxn10.1 peptides are shown. *, P < 0.05; **, P < 0.01. (B) Naive mice or mice immunized twice with indicated peptides (Alkbh6.2, Slit3, Atxn10.1, Atxn10.2, and Ccdc136) were challenged intradermally with 300,000 live CMS5 tumor cells, and tumor growth was monitored. The numbers in the top left corner of each set of tumor growth curves denote the number of mice with growing tumors/total number of mice. Immunized mice were not depleted (NT), depleted of CD8 or CD4 cells, as indicated. Each line shows the kinetics of tumor growth in a single mouse. The experiments were performed three times.
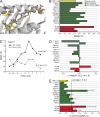
Figure 4.
Structural stability as a correlate with immunogenicity. (A) Mutations within neoepitopes lead to structural alterations across the peptide backbone, as illustrated with structural snapshots from the simulations of the mutant and WT Tnpo3.1 epitope bound to H-2Kd. (B) Summary of structural differences for highly DAI ranked nonamers. Differences were quantified by superimposing average peptide conformations from the molecular dynamics simulations and computing RMSDs for all common atoms. Green and red bars indicate epitopes that led to either positive or negative immunological responses, respectively. The yellow bar shows the results for control calculations for an immunogenic HBV core epitope. (alue for the HBV epitope is the average Cα RMSD relative to the starting coordinates. (C) The numbers in the legend give the mean RMSF for the all amino acids of each peptide; those at the right give the value for only the C-terminal α carbon. Mutated amino acids are indicated by lower case in the x-axis. Results for all nonamers are in
Fig. S1
. (D) Effects of mutations on the conformational stability of all nonamers, calculated as the difference between the mean RMSF of the mutant and the WT peptide. (E) Fluctuations at the peptide C-terminal ends and immunogenicity. The dashed vertical line shows the mean value for all mutant nonamers. The yellow bar shows the C-terminal stability of the HBV core epitope control. Error bars represent SEM.
Figure 5.
Antigen presentation of neoepitope Tnpo3 and immune response and tumor protection elicited by it. (A) Mice were immunized with mutant Tnpo3 peptide. Draining LNs, harvested 1 wk after immunization, were briefly stimulated ex vivo without (No pep) or with WT or mutant Tnpo3 peptides (left), or with a weekly in vitro stimulation with 1 µM mutant Tnpo3 peptide (right). After 5 d, cells were tested for the responsiveness to mutant Tnpo3-pulsed cells (Tnpo3) or Meth A cells (Meth A) by ELISpot. IFN-γ+ CD44+ CD8+ T cells were counted. (B) Mice were immunized twice with ovalbumin peptide (SIINFEKL) or Tnpo3 mutant peptide. 6 d after the second immunization, splenocytes from both groups were stained with Kd/SYMLQALCI tetramer. Tetramer positive cells were counted in CD8+ gate. (C) Mice were immunized with irradiated Meth A cells. (left) 6 d later, inguinal LN cells were stimulated overnight without peptide, irrelevant Prpf31 peptide or Tnpo3 peptide. % activated effector CD8+ cells is shown, as assessed by flow cytometry. (right) Splenocytes were stimulated in vitro in multiple rounds with 1 µM of indicated peptides for a total of 19 d. Irrelevant peptide from Prpf31 was used as a control. 5 d after stimulation, cells were tested for the responsiveness to indicated peptides by flow cytometry. Typically, for each sample, 150,000 lymphocytes, or at least 19,000 CD8+CD4− cells, were acquired. See in
Fig. S3
for FACS gating strategy and representative primary data. (D) Mice were injected with 200,000 Meth A cells on the right flank. 21 d later, tumor-draining LNs and contralateral LNs were harvested and stained with anti-CD8 antibody and Tnpo3 and Nfkb1 tetramers Kd/SYMLQALCI and Kd/GYSVLHLAI, respectively (left and middle). Splenocytes were used to purify CD8+ cells to assess the responsiveness to mutant Tnpo3-pulsed cells (Tnpo3) or Meth A cells (Meth A) by ELISpot assay with no peptide (No pep) stimulation as negative control (right). (E) Naive mice or Tnpo3 mutant peptide-immunized mice were challenged with Meth A cells and treated with anti-CD25 antibody or anti-CTLA-4 antibody as indicated. AUC for each group is plotted (Duan et al., 2012), and complete tumor growth curves for all the mice in all groups are shown. Between four and six mice per group were used in each experiment, and each experiment was repeated between three and five times. *, P < 0.05; **, P < 0.01; ***, P < 0.001.
Similar articles
- Population-level distribution and putative immunogenicity of cancer neoepitopes.
Wood MA, Paralkar M, Paralkar MP, Nguyen A, Struck AJ, Ellrott K, Margolin A, Nellore A, Thompson RF. Wood MA, et al. BMC Cancer. 2018 Apr 13;18(1):414. doi: 10.1186/s12885-018-4325-6. BMC Cancer. 2018. PMID: 29653567 Free PMC article. - Mass spectrometry driven exploration reveals nuances of neoepitope-driven tumor rejection.
Ebrahimi-Nik H, Michaux J, Corwin WL, Keller GL, Shcheglova T, Pak H, Coukos G, Baker BM, Mandoiu II, Bassani-Sternberg M, Srivastava PK. Ebrahimi-Nik H, et al. JCI Insight. 2019 Jun 20;5(14):e129152. doi: 10.1172/jci.insight.129152. JCI Insight. 2019. PMID: 31219806 Free PMC article. - A Recurrent Mutation in Anaplastic Lymphoma Kinase with Distinct Neoepitope Conformations.
Toor JS, Rao AA, McShan AC, Yarmarkovich M, Nerli S, Yamaguchi K, Madejska AA, Nguyen S, Tripathi S, Maris JM, Salama SR, Haussler D, Sgourakis NG. Toor JS, et al. Front Immunol. 2018 Jan 30;9:99. doi: 10.3389/fimmu.2018.00099. eCollection 2018. Front Immunol. 2018. PMID: 29441070 Free PMC article. - Prediction of cancer neoepitopes needs new rules.
Brennick CA, George MM, Srivastava PK, Karandikar SH. Brennick CA, et al. Semin Immunol. 2020 Feb;47:101387. doi: 10.1016/j.smim.2020.101387. Epub 2020 Jan 14. Semin Immunol. 2020. PMID: 31952902 Review. - Targeting Neoepitopes to Treat Solid Malignancies: Immunosurgery.
de Sousa E, Lérias JR, Beltran A, Paraschoudi G, Condeço C, Kamiki J, António PA, Figueiredo N, Carvalho C, Castillo-Martin M, Wang Z, Ligeiro D, Rao M, Maeurer M. de Sousa E, et al. Front Immunol. 2021 Jul 15;12:592031. doi: 10.3389/fimmu.2021.592031. eCollection 2021. Front Immunol. 2021. PMID: 34335558 Free PMC article. Review.
Cited by
- Citizens unite for computational immunology!
Belden OS, Baker SC, Baker BM. Belden OS, et al. Trends Immunol. 2015 Jul;36(7):385-7. doi: 10.1016/j.it.2015.05.004. Trends Immunol. 2015. PMID: 26139599 Free PMC article. - Aggressive, early resistant and relapsed mantle cell lymphoma distinct extrinsic microenvironment highlighted by transcriptome analysis.
Le Bris Y, Normand A, Bouard L, Ménard A, Bossard C, Moreau A, Béné MC. Le Bris Y, et al. EJHaem. 2022 Oct 13;3(4):1165-1171. doi: 10.1002/jha2.549. eCollection 2022 Nov. EJHaem. 2022. PMID: 36467789 Free PMC article. - Enrich and Expand Rare Antigen-specific T Cells with Magnetic Nanoparticles.
Hickey JW, Schneck JP. Hickey JW, et al. J Vis Exp. 2018 Nov 17;(141):10.3791/58640. doi: 10.3791/58640. J Vis Exp. 2018. PMID: 30507913 Free PMC article. - Decoupled neoantigen cross-presentation by dendritic cells limits anti-tumor immunity against tumors with heterogeneous neoantigen expression.
Nguyen KB, Roerden M, Copeland CJ, Backlund CM, Klop-Packel NG, Remba T, Kim B, Singh NK, Birnbaum ME, Irvine DJ, Spranger S. Nguyen KB, et al. Elife. 2023 Aug 7;12:e85263. doi: 10.7554/eLife.85263. Elife. 2023. PMID: 37548358 Free PMC article. - Cancer: Antitumour immunity gets a boost.
Wolchok JD, Chan TA. Wolchok JD, et al. Nature. 2014 Nov 27;515(7528):496-8. doi: 10.1038/515496a. Nature. 2014. PMID: 25428495 Free PMC article. No abstract available.
References
- Assarsson, E., Sidney J., Oseroff C., Pasquetto V., Bui H.H., Frahm N., Brander C., Peters B., Grey H., and Sette A.. 2007. A quantitative analysis of the variables affecting the repertoire of T cell specificities recognized after vaccinia virus infection. J. Immunol. 178:7890–7901. 10.4049/jimmunol.178.12.7890 - DOI - PubMed
- Bailey, D.W.1978. Sources of subline divergences and their relative importance for sublines of six major inbred strains of mice. Origins of inbred mice. Morse H.C. III, editor. Elsevier; 10.1016/B978-0-12-507850-4.50020-2 - DOI
- Borbulevych, O.Y., Baxter T.K., Yu Z., Restifo N.P., and Baker B.M.. 2005. Increased immunogenicity of an anchor-modified tumor-associated antigen is due to the enhanced stability of the peptide/MHC complex: implications for vaccine design. J. Immunol. 174:4812–4820. 10.4049/jimmunol.174.8.4812 - DOI - PMC - PubMed
- Borbulevych, O.Y., Insaidoo F.K., Baxter T.K., Powell D.J. Jr, Johnson L.A., Restifo N.P., and Baker B.M.. 2007. Structures of MART-126/27-35 Peptide/HLA-A2 complexes reveal a remarkable disconnect between antigen structural homology and T cell recognition. J. Mol. Biol. 372:1123–1136. 10.1016/j.jmb.2007.07.025 - DOI - PMC - PubMed
Publication types
MeSH terms
Substances
Grants and funding
- AG110891/AG/NIA NIH HHS/United States
- GM103773/GM/NIGMS NIH HHS/United States
- R01 GM067079/GM/NIGMS NIH HHS/United States
- GM067079/GM/NIGMS NIH HHS/United States
- R01 GM103773/GM/NIGMS NIH HHS/United States
LinkOut - more resources
Full Text Sources
Other Literature Sources
Molecular Biology Databases
Research Materials


