Reactive neurogenesis in response to naturally occurring apoptosis in an adult brain - PubMed (original) (raw)
Reactive neurogenesis in response to naturally occurring apoptosis in an adult brain
Tracy A Larson et al. J Neurosci. 2014.
Abstract
Neuronal birth and death are tightly coordinated to establish and maintain properly functioning neural circuits. Disruption of the equilibrium between neuronal birth and death following brain injury or pharmacological insult often induces reactive, and in some cases regenerative, neurogenesis. Many neurodegenerative disorders are not injury-induced, however, so it is critical to determine if and how reactive neurogenesis occurs under noninjury-induced neurodegenerative conditions. Here, we used a model of naturally occurring neural degradation in a neural circuit that controls song behavior in Gambel's white-crowned sparrows (Zonotrichia leucophrys gambelii) and examined the temporal dynamics between neuronal birth and death. We found that during seasonal-like regression of the song, control nucleus HVC (proper name), caspase-mediated apoptosis increased within 2 d following transition from breeding to nonbreeding conditions and neural stem-cell proliferation in the nearby ventricular zone (VZ) increased shortly thereafter. We show that inhibiting caspase-mediated apoptosis in HVC decreased neural stem-cell proliferation in the VZ. In baseline conditions the extent of neural stem-cell proliferation correlated positively with the number of dying cells in HVC. We demonstrate that as apoptosis increased and the number of both recently born and pre-existing neurons in HVC decreased, the structure of song, a learned sensorimotor behavior, degraded. Our data illustrate that reactive neurogenesis is not limited to injury-induced neuronal death, but also can result from normally occurring degradation of a telencephalic neural circuit.
Keywords: aging; apoptosis; neurogenesis; neuronal turnover; sex steroid; song bird.
Copyright © 2014 the authors 0270-6474/14/3413066-11$15.00/0.
Figures
Figure 1.
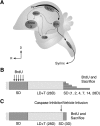
A, Schematic illustrating the major projections within the song control circuits. Black arrows indicate the song production pathway; gray arrows show the anterior forebrain pathway. Note the VZ directly dorsal to HVC. nXII, tracheosyringeal portion of hypoglossal nucleus; DLM, dorsolateral division of the medial thalamus; lMAN, lateral subdivision of the magnocellular nucleus of the anterior nidopallium; D, dorsal; R, rostral. B, Experimental design for natural rapid regression study. C, Experimental design for caspase inhibitor cocktail infusion study.
Figure 2.
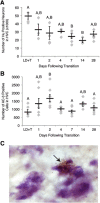
Apoptosis in HVC occurs rapidly after transition from breeding to nonbreeding conditions. A, Number of Hu positive neurons in one hemisphere of HVC across the time course of regression. HVC neuron number drops by 7 d following transition to nonbreeding conditions. B, Number of apoptotic cells in HVC on one side of the brain over the time course of regression. Number of AC-3-positive cells peaks at 2 d following transition from breeding to nonbreeding conditions. Letters above bars indicate significant differences among groups (one-way ANOVA, Tukey post hoc pairwise comparisons). All data plotted as mean ± SEM. C, Representative image of AC-3 immunohistochemistry in fresh frozen tissue counter-stained for Nissl (cytoplasm stains light purple, nuclei stain dark purple) illustrating apoptotic cells in HVC. The arrow indicates an AC-3-positive cell (brown). Note the condensed chromatin (a distinctive feature of apoptotic cells; shown in dark purple) contained within the AC-3-positive cell.
Figure 3.
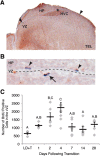
Proliferation in the vVZ changes rapidly during regression of the song control circuits. A, An image of Hu staining in the brain illustrating the method for counting BrdU-positive cells in the VZ. Arrowheads demonstrate the medial and lateral-most extents within which BrdU-positive cells were counted on the ventral side of the VZ. The star indicates the location of the image shown in B. HP, Hippocampus; TEL, telencephalon. B, A representative image of BrdU immunohistochemistry showing proliferative cells and their progeny in the VZ. BrdU labeling in the nucleus is stained dark purple whereas Hu labeling in the cytoplasm is stained brown. The arrow indicates BrdU-positive cells (i.e., neural progenitor cells or daughter cells) labeled at the time of BrdU injections. The arrowheads point to BrdU-positive cells on the dorsal side of the VZ (ventral to HP) that were not included in counts of BrdU-positive cells in the vVZ due to their inability to migrate across the ventricle to HVC. C, Number of BrdU-positive cells in the vVZ of one hemisphere over the experimental time course. Proliferation in the vVZ peaked at 4 d following transition from breeding to nonbreeding conditions. Letters above bars indicate significant differences among groups. All data plotted as mean ± SEM.
Figure 4.
The relationship between proliferation in the vVZ and the number of apoptotic cells in HVC during rapid regression of the song control system. A, The lag in time of peak vVZ proliferation compared with HVC cell death. The levels of cell death in HVC and proliferation in the vVZ are plotted relative to the maximum value of each measure to facilitate comparison of the time course of both measures. Proliferation in the vVZ peaks at 4 d following transition from breeding to nonbreeding conditions and 2–3 d following the peak of HVC cell death. B, The correlation between proliferation in the vVZ and the number of apoptotic cells in HVC during rapid regression of the song control system. All data pooled is indicated by the dashed line (_R_2 = 0.0464, p = 0.2140, n = 30 birds), pooled baseline condition data (i.e., 28 d of LD+T and SD; n = 9 birds) by the dark gray diamonds (individual data points) and dark gray solid line, and pooled active regression data (i.e., 1, 2, 4, 7, and 14 d of SD; n = 21 birds) by the light gray diamonds and solid line. See Table 3 for correlations between vVZ proliferation and AC-3 cell number within individual time points.
Figure 5.
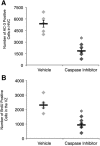
Cell death in HVC is functionally linked to stem-cell proliferation in the vVZ. A, Number of apoptotic cells in HVC of birds infused with vehicle or caspase inhibitor cocktail infusion near HVC for 3 d into the seasonally induced regression of HVC. The number of AC-3-positive cells was significantly lower in birds infused with the caspase inhibitor cocktail, confirming that the infusion prevented HVC cell death. B, Number of BrdU-positive cells in the vVZ of birds infused with vehicle (n = 5) or caspase inhibitor cocktail (n = 6) near HVC after 3 d of SD. Proliferation in the vVZ was significantly reduced in birds receiving the caspase inhibitor cocktail compared with those receiving vehicle following transition from breeding to nonbreeding conditions. Asterisk above bars indicate significant differences among groups. All data plotted as mean ± SEM.
Figure 6.
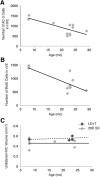
The effect of age on neuronal turnover in male white-crowned sparrows following HVC regression. A, HVC cell death negatively correlates with sparrow age at stable baseline breeding and nonbreeding conditions (i.e., LD+T and SD 28 d). Solid line is the regression line from pooled LD+T and SD 28 d birds, whereas gray dots represent the value for each bird (n = 11). B, Proliferation in the vVZ negatively correlates with sparrow age in stable baseline conditions (n = 11). C, HVC volume does not change with age. Maximal HVC growth (i.e., LD+T volume; n = 4) correlation with age is represented by the dotted line and complete HVC regression (i.e., 28 d of SD volume; n = 7) correlation with age is indicated by the solid line. For all scatter plots individual birds' values and age are represented by one dot: light gray for LD+T and dark gray for 28 d of SD.
Figure 7.
Song degrades as Gambel's white-crowned sparrows are transferred from breeding to nonbreeding conditions. A, Spectrograms of songs produced by three different individuals before and after the birds were transferred to nonbreeding conditions. The manner in which song degraded varied between birds. Bird 1 song illustrates degradation of the spectral properties within individual syllables. Birds 2 and 3 continued to sing individual syllables similar in spectral properties to those sung under breeding condition, but sang fewer syllables over time. Bird 3 stopped singing before 14 d of SD, as did 40% of the birds remaining in the experiment through at least 14 d of SD. B, Song completeness across the time course of regression plotted as percentage of songs that contained each of the syllable types produced under breeding conditions. Song completeness decreased significantly by 4 d into nonbreeding conditions. C, Cross-correlation, a measure of similarity, of song from 21 and 23 d of LD+T and days 1–14 of SD compared with 21 d of LD+T song. Song similarity decreased significantly by 7 d of SD relative to 23 d of LD+T. Letters above bars indicate significant differences among groups. All data plotted as mean ± SEM.
Figure 8.
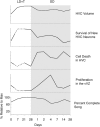
Summary of the morphological and behavioral changes in Gambel's white-crowned sparrows occurring throughout breeding and nonbreeding conditions and transitions between the two. Data from previous publications (Smith et al., 1995; Tramontin et al., 2000; Thompson et al., 2007; Meitzen et al., 2009) were pooled with our data to construct the time course of growth and regression of HVC and the associated song behavior. Each property is presented as a percentage relative to the maximum value regardless of seasonal condition for that property. Solid lines represent existing data; dashed lines represent interpolated values. Gray background indicates nonbreeding condition, and white background indicates breeding condition.
Similar articles
- Adult Neurogenesis Leads to the Functional Reconstruction of a Telencephalic Neural Circuit.
Cohen RE, Macedo-Lima M, Miller KE, Brenowitz EA. Cohen RE, et al. J Neurosci. 2016 Aug 24;36(34):8947-56. doi: 10.1523/JNEUROSCI.0553-16.2016. J Neurosci. 2016. PMID: 27559175 Free PMC article. - Seasonal changes in neuronal turnover in a forebrain nucleus in adult songbirds.
Larson TA, Thatra NM, Hou D, Hu RA, Brenowitz EA. Larson TA, et al. J Comp Neurol. 2019 Mar 1;527(4):767-779. doi: 10.1002/cne.24552. Epub 2018 Nov 14. J Comp Neurol. 2019. PMID: 30291632 Free PMC article. - Inflammation Induced by Natural Neuronal Death and LPS Regulates Neural Progenitor Cell Proliferation in the Healthy Adult Brain.
Larson TA, Tokareva Y, Cole MM, Brenowitz EA. Larson TA, et al. eNeuro. 2020 Jul 2;7(4):ENEURO.0023-20.2020. doi: 10.1523/ENEURO.0023-20.2020. Print 2020 Jul/Aug. eNeuro. 2020. PMID: 32424053 Free PMC article. - Seasonal-like growth and regression of the avian song control system: neural and behavioral plasticity in adult male Gambel's white-crowned sparrows.
Meitzen J, Thompson CK. Meitzen J, et al. Gen Comp Endocrinol. 2008 Jul;157(3):259-65. doi: 10.1016/j.ygcen.2008.03.014. Epub 2008 Mar 25. Gen Comp Endocrinol. 2008. PMID: 18457836 Free PMC article. Review. - Birth, migration, incorporation, and death of vocal control neurons in adult songbirds.
Alvarez-Buylla A, Kirn JR. Alvarez-Buylla A, et al. J Neurobiol. 1997 Nov;33(5):585-601. J Neurobiol. 1997. PMID: 9369461 Review.
Cited by
- Forniceal deep brain stimulation in a mouse model of Rett syndrome increases neurogenesis and hippocampal memory beyond the treatment period.
Wang Q, Tang B, Hao S, Wu Z, Yang T, Tang J. Wang Q, et al. Brain Stimul. 2023 Sep-Oct;16(5):1401-1411. doi: 10.1016/j.brs.2023.09.002. Epub 2023 Sep 11. Brain Stimul. 2023. PMID: 37704033 Free PMC article. - Connectomes: from a sparsity of networks to large-scale databases.
Kaiser M. Kaiser M. Front Neuroinform. 2023 Jun 12;17:1170337. doi: 10.3389/fninf.2023.1170337. eCollection 2023. Front Neuroinform. 2023. PMID: 37377946 Free PMC article. Review. - Protective Effects of a Polyphenol-Rich Blueberry Extract on Adult Human Neural Progenitor Cells.
Zheng T, Bielinski DF, Fisher DR, Zhang J, Shukitt-Hale B. Zheng T, et al. Molecules. 2022 Sep 20;27(19):6152. doi: 10.3390/molecules27196152. Molecules. 2022. PMID: 36234687 Free PMC article. - Consequences of adolescent alcohol use on adult hippocampal neurogenesis and hippocampal integrity.
Wooden JI, Thompson KR, Guerin SP, Nawarawong NN, Nixon K. Wooden JI, et al. Int Rev Neurobiol. 2021;160:281-304. doi: 10.1016/bs.irn.2021.08.005. Epub 2021 Oct 6. Int Rev Neurobiol. 2021. PMID: 34696876 Free PMC article. Review. - Abnormal neurometabolites in fibromyalgia patients: Magnetic resonance spectroscopy study.
Jung YH, Kim H, Lee D, Lee JY, Lee WJ, Moon JY, Choi SH, Kang DH. Jung YH, et al. Mol Pain. 2021 Jan-Dec;17:1744806921990946. doi: 10.1177/1744806921990946. Mol Pain. 2021. PMID: 33573464 Free PMC article.
References
- Brenowitz EA. Plasticity of the song control system in adult birds. In: Zeigler HP, Marler P, editors. Neuroscience of birdsong. Cambridge: Cambridge UP; 2008. pp. 332–349.
Publication types
MeSH terms
Grants and funding
- R01 NS075331/NS/NINDS NIH HHS/United States
- R01 MH053032/MH/NIMH NIH HHS/United States
- R01 MH53032/MH/NIMH NIH HHS/United States
- T32 GM007270/GM/NIGMS NIH HHS/United States
- P30 DK017047/DK/NIDDK NIH HHS/United States
LinkOut - more resources
Full Text Sources
Other Literature Sources
