Coenzyme Q10 protects human endothelial cells from β-amyloid uptake and oxidative stress-induced injury - PubMed (original) (raw)
Coenzyme Q10 protects human endothelial cells from β-amyloid uptake and oxidative stress-induced injury
Mario Durán-Prado et al. PLoS One. 2014.
Abstract
Neuropathological symptoms of Alzheimer's disease appear in advances stages, once neuronal damage arises. Nevertheless, recent studies demonstrate that in early asymptomatic stages, ß-amyloid peptide damages the cerebral microvasculature through mechanisms that involve an increase in reactive oxygen species and calcium, which induces necrosis and apoptosis of endothelial cells, leading to cerebrovascular dysfunction. The goal of our work is to study the potential preventive effect of the lipophilic antioxidant coenzyme Q (CoQ) against ß-amyloid-induced damage on human endothelial cells. We analyzed the protective effect of CoQ against Aβ-induced injury in human umbilical vein endothelial cells (HUVECs) using fluorescence and confocal microscopy, biochemical techniques and RMN-based metabolomics. Our results show that CoQ pretreatment of HUVECs delayed Aβ incorporation into the plasma membrane and mitochondria. Moreover, CoQ reduced the influx of extracellular Ca(2+), and Ca(2+) release from mitochondria due to opening the mitochondrial transition pore after β-amyloid administration, in addition to decreasing O2(.-) and H2O2 levels. Pretreatment with CoQ also prevented ß-amyloid-induced HUVECs necrosis and apoptosis, restored their ability to proliferate, migrate and form tube-like structures in vitro, which is mirrored by a restoration of the cell metabolic profile to control levels. CoQ protected endothelial cells from Aβ-induced injury at physiological concentrations in human plasma after oral CoQ supplementation and thus could be a promising molecule to protect endothelial cells against amyloid angiopathy.
Conflict of interest statement
Competing Interests: The authors have declared that no competing interests exist.
Figures
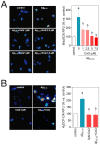
Figure 1. CoQ protects endothelial cells from β-amyloid-induced apoptosis and necrosis.
HUVECs were incubated for 12 h with vehicle alone or with increasing CoQ concentrations (1 to 7.5 µM) and then treated for additional 24 h with 5 µM Aβ25–35. A) Apoptosis was determined by DAPI staining and morphological analysis of nuclei. White arrows indicate typical apoptotic nuclei. Results are expressed as the percentage of apoptotic vs. total nuclei (300 cells/treatment, n = 3). B) Apoptosis was also evaluated by flow cytometry. Results are expressed as percentage of cells positive for Annexin V vs. total (n = 3). Viability and necrosis (C, left and right, respectively) were determined by cell co-staining with calcein-AM (green) and ethidium bromide (orange) and evaluated by qualitative fluorescence microscopy. Results are expressed as percentage of viable/necrotic cells vs. total (n = 3). a, p<0.05 vs. control; b, p<0.05 vs. Aβ25–35.
Figure 2. CoQ hinders β-amyloid inhibition of endothelial cells migration and tubes formation.
HUVECs were incubated for 12 h with vehicle or increasing CoQ concentrations (1 to 7.5 µM) and treated for additional 24 h with 5 µM Aβ25–35. A) Cell migration was evaluated with the wound healing assay. Results show the percentage of wound recovered after 12 h for the indicated treatments (n = 3). B) Migrating cells were identified with fluorescence microscopy by immunostaining of lamellipodia structures with an anti-actin antibody. Results are expressed as percentage of lamellipodia+ cells (white arrows) cells vs. total (n = 3). C) Angiogenesis in vitro was determined by “cell tube” formation assays in Matrigel-coated wells. Results show the percentage of cell tubes vs. control after 6 h incubation with the indicated treatments (n = 3). a, p<0.05 vs. control; b, p<0.05 vs. Aβ25–35.
Figure 3. CoQ prevents β-amyloid-mediated increase in O2 .− and H2O2 levels in endothelial cells.
HUVECs were incubated for 12 h with vehicle or increasing CoQ concentrations (1 to 7.5 µM) and treated for additional 24 h with 5 µM Aβ25–35. A) O2 .− levels were determined by fluorescence microscopy using the probe MitoSOX-AM. B) H2O2 level was determined by fluorescence microscopy with the probe H2DCF-DA. Results show the percentage of variation of fluorescence vs. control cells (n = 4). a, p<0.05 vs. control; b, p<0.05 vs. Aβ25–35.
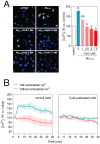
Figure 4. CoQ blocks β-amyloid-induced raise in the free cytosolic Ca2+ level in endothelial cells.
HUVECs were incubated for 12 h with vehicle or CoQ (1 to 7.5 µM) and treated with 5 µM Aβ25–35. Ca2+ levels were determined by fluorescence microscopy with the probe Fluo-4-AM. A) Ca2+ was quantified after 3 h treatment with 5 µM Aβ25–35 in cells preincubated with CoQ. Results show the percentage of variation of fluorescence vs. control cells (n = 4). a, p<0.05 vs. control; b, p<0.05 vs. Aβ25–35. B) Changes in Ca2+ were monitored by time-lapse microscopy every 30 sec in cells pretreated with PBS (left graph) or 5 µM CoQ (right graph) in the presence (black line) or absence (grey line) of extracellular Ca2+. Aβ25–35 was added in min 1. Results show the averaged percentage of fluorescence variation vs. baseline before Aβ25–35 addition (n = 3).
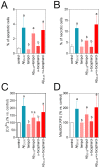
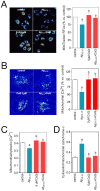
Figure 5. Effects of tempol and α-tocopherol on β-amyloid-induced apoptosis, necrosis, free cytosolic Ca2+ and O2 .−.
HUVECs were incubated for 12 h with vehicle, 1 mM tempol or 100 µM α-tocopherol, and then treated for additional 3–24 h with 5 µM Aβ25–35. A) Apoptosis was determined by DAPI staining and morphological analysis of nuclei. Results are expressed as the percentage of apoptotic vs. total nuclei (300 cells/treatment, n = 3). B) Necrosis was determined by staining with ethidium bromide and evaluated by qualitative fluorescence microscopy. Results are expressed as percentage of necrotic vs. total cells (n = 3). a, p<0.05 vs. control; b, p<0.05 vs. Aβ25–35. HUVECs were incubated for 12 h with vehicle, 1 mM tempol or 100 µM α-tocopherol and treated for additional 3 h with 5 µM Aβ25–35. C) Ca2+ levels were determined by fluorescence microscopy with the probe Fluo-4-AM. D) O2 .− levels were determined by fluorescence microscopy using the probe MitoSOX-AM. Results show the percentage of variation of fluorescence vs. control cells (n = 3). a, p<0.05 vs. control; b, p<0.05 vs. Aβ25–35.
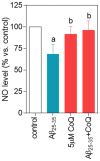
Figure 6. Nitric oxide decrease is prevented by CoQ treatment.
HUVECs were incubated for 12 h with vehicle or 5 µM CoQ and treated for additional 24 h with 5 µM Aβ25–35. NO was determined in the supernatant by the Griess method. Results are expressed as percentage of NO vs. control (n = 4). a, p<0.05 vs. control; b, p<0.05 vs. Aβ25–35.
Figure 7. CoQ impedes β-amyloid-induced mPTP opening.
HUVECs were incubated for 12 h with vehicle or 5 µM CoQ and treated for additional 3–24 h with 5 µM Aβ25–35. The effect of the treatments on mPTP opening was quantified indirectly by measuring MitoTracker Deep Red fluorescence, mitochondrial Ca2+ and cytochrome c release. After treatment with 5 µM Aβ25–35, mitochondria were loaded with MitoTracker Deep Red A), Calcein-AM and CoCl2 B) and MitoTracker Deep Red plus Fluo-4 C). Fluorescence intensity for each probe was determined by fluorescence microscope in living cells (n = 3/4). Mitochondrial Ca2+ levels were calculated by quenching the cytosolic Calcein-AM signal with CoCl2 B) and by colocalization of Fluo-4 and MitoTracker and furfher image processing with ImageJ C). Cells were loaded with Mitotracker Deep Red and immunostained with an anti-cytochrome c D). The amount of cytochrome c in cytosol was calculated by colocalization and image processing with ImageJ (n = 3). Results show the percentage of relative fluorescence units (RFUs) vs. control cells or the ratio between cytosolic/mitochondrial Fluo-4-AM or cytochrome c RFUs level. a, p<0.05 vs. control; b, p<0.05 vs. Aβ25–35.
Figure 8. CoQ delays and decreases β-amyloid incorporation into endothelial cells.
HUVECs were incubated for 12 h with vehicle or 5 µM CoQ. Changes in HiLyte Fluor-labeled Aβ25–35 were monitored by time-lapse microscopy every 30 sec in cells pretreated with PBS or 5 µM CoQ. Fluorescent peptide (5 µM) was added in min 1. Pictures show the variation of fluorescence at different time points, from 0 to 45 min. Graph shows fluorescence dynamics, expressed as normalized relative fluorescence units (RFUs), (n = 3).
Figure 9. CoQ lessens β-amyloid incorporation into endothelial cells mitochondria.
HUVECs were incubated for 12 h with vehicle or 5 µM CoQ, loaded with Mitotracker Deep Red, and then treated with 5 µM HiLyte Fluor-labeled Aβ25–35 for 0, 10, 20 and 40 min. Pictures were immediately acquired by confocal microscopy in living cells and show the staining with Mitotracker Deep Red, HiLyte Fluor-labeled Aβ25–35 (green) and merges, in control (left) and CoQ incubated cells (right) at 40 min from Aβ25–35 addition. Colocalization and image processing were performed with ImageJ. Graphs show HiLyte Fluor-labeled Aβ25–35 relative fluorescence units (RFUs) vs. time in the whole cell (total; upper graph), cyotosol (middle graph) and mitochondria (bottom graph) in control (black line) and CoQ incubated cells (grey line). n = 3; a, p<0.005 vs. Aβ25–35.
Figure 10. CoQ prevents metabolic changes induced by β-amyloid in endothelial cells.
HUVECs were incubated for 12 h with vehicle or 5 µM CoQ and treated with 5 µM Aβ25–35. Samples were sonicated, lyophilized and dissolved in 40 µl D2O. 1H NMR spectra were registered with a Nanoprobe at 400 MHz resonance frequency. Metabolites were identified with Chenomx Profiler and by means of 2D homo- and heteronuclear NMR experiments. Differential analysis and classification was performed with MEV4 and pathways enrichment with MetaboAnalist. A) Heatmap and clustering of metabolites identified in HUVECs (n = 3). p<0.05 where indicated. B) Pathways enrichment based on the identified metabolites. Results show the averaged fold change vs. vehicle-treated cells (n = 3). a, p<0.05 vs. control; b, p<0.05 vs. Aβ25–35.
Similar articles
- Coenzyme Q10 protects coronary endothelial function from ischemia reperfusion injury via an antioxidant effect.
Yokoyama H, Lingle DM, Crestanello JA, Kamelgard J, Kott BR, Momeni R, Millili J, Mortensen SA, Whitman GJ. Yokoyama H, et al. Surgery. 1996 Aug;120(2):189-96. doi: 10.1016/s0039-6060(96)80287-x. Surgery. 1996. PMID: 8751582 - Coenzyme Q10 prevents high glucose-induced oxidative stress in human umbilical vein endothelial cells.
Tsuneki H, Sekizaki N, Suzuki T, Kobayashi S, Wada T, Okamoto T, Kimura I, Sasaoka T. Tsuneki H, et al. Eur J Pharmacol. 2007 Jul 2;566(1-3):1-10. doi: 10.1016/j.ejphar.2007.03.006. Epub 2007 Mar 19. Eur J Pharmacol. 2007. PMID: 17434478 - Nucleoside reverse transcriptase inhibitors induce a mitophagy-associated endothelial cytotoxicity that is reversed by coenzyme Q10 cotreatment.
Xue SY, Hebert VY, Hayes DM, Robinson CN, Glover M, Dugas TR. Xue SY, et al. Toxicol Sci. 2013 Aug;134(2):323-34. doi: 10.1093/toxsci/kft105. Epub 2013 May 2. Toxicol Sci. 2013. PMID: 23640862 Free PMC article. - Can coenzyme Q10 improve vascular function and blood pressure? Potential for effective therapeutic reduction in vascular oxidative stress.
Hodgson JM, Watts GF. Hodgson JM, et al. Biofactors. 2003;18(1-4):129-36. doi: 10.1002/biof.5520180215. Biofactors. 2003. PMID: 14695928 Review. - An updating of the biochemical function of coenzyme Q in mitochondria.
Lenaz G, Fato R, Castelluccio C, Cavazzoni M, Estornell E, Huertas JF, Pallotti F, Parenti Castelli G, Rauchova H. Lenaz G, et al. Mol Aspects Med. 1994;15 Suppl:s29-36. doi: 10.1016/0098-2997(94)90010-8. Mol Aspects Med. 1994. PMID: 7752842 Review.
Cited by
- The Use of Coenzyme Q10 in Cardiovascular Diseases.
Rabanal-Ruiz Y, Llanos-González E, Alcain FJ. Rabanal-Ruiz Y, et al. Antioxidants (Basel). 2021 May 10;10(5):755. doi: 10.3390/antiox10050755. Antioxidants (Basel). 2021. PMID: 34068578 Free PMC article. Review. - Interplay Between Mitochondrial Oxidative Disorders and Proteostasis in Alzheimer's Disease.
Llanos-González E, Henares-Chavarino ÁA, Pedrero-Prieto CM, García-Carpintero S, Frontiñán-Rubio J, Sancho-Bielsa FJ, Alcain FJ, Peinado JR, Rabanal-Ruíz Y, Durán-Prado M. Llanos-González E, et al. Front Neurosci. 2020 Jan 29;13:1444. doi: 10.3389/fnins.2019.01444. eCollection 2019. Front Neurosci. 2020. PMID: 32063825 Free PMC article. Review. - The Protective Effect of Ubiquinone against the Amyloid Peptide in Endothelial Cells Is Isoprenoid Chain Length-Dependent.
Frontiñán-Rubio J, Rabanal-Ruiz Y, Durán-Prado M, Alcain FJ. Frontiñán-Rubio J, et al. Antioxidants (Basel). 2021 Nov 13;10(11):1806. doi: 10.3390/antiox10111806. Antioxidants (Basel). 2021. PMID: 34829677 Free PMC article. - Over the Counter Supplements for Memory: A Review of Available Evidence.
Hersant H, He S, Maliha P, Grossberg G. Hersant H, et al. CNS Drugs. 2023 Sep;37(9):797-817. doi: 10.1007/s40263-023-01031-6. Epub 2023 Aug 21. CNS Drugs. 2023. PMID: 37603263 Review. - Coenzyme Q10 Prevents Senescence and Dysfunction Caused by Oxidative Stress in Vascular Endothelial Cells.
Huo J, Xu Z, Hosoe K, Kubo H, Miyahara H, Dai J, Mori M, Sawashita J, Higuchi K. Huo J, et al. Oxid Med Cell Longev. 2018 Jul 8;2018:3181759. doi: 10.1155/2018/3181759. eCollection 2018. Oxid Med Cell Longev. 2018. PMID: 30116476 Free PMC article.
References
- Park L, Anrather J, Forster C, Kazama K, Carlson GA, et al. (2004) Abeta-induced vascular oxidative stress and attenuation of functional hyperemia in mouse somatosensory cortex. J Cereb Blood Flow Metab 24: 334–342. - PubMed
- Marchesi VT (2011) Alzheimer's dementia begins as a disease of small blood vessels, damaged by oxidative-induced inflammation and dysregulated amyloid metabolism: implications for early detection and therapy. The FASEB Journal 25: 5–13. - PubMed
- Suo Z, Fang C, Crawford F, Mullan M (1997) Superoxide free radical and intracellular calcium mediate A beta(1–42) induced endothelial toxicity. Brain Res 762: 144–152. - PubMed
Publication types
MeSH terms
Substances
LinkOut - more resources
Full Text Sources
Other Literature Sources
Miscellaneous


