A PH domain in ACAP1 possesses key features of the BAR domain in promoting membrane curvature - PubMed (original) (raw)
. 2014 Oct 13;31(1):73-86.
doi: 10.1016/j.devcel.2014.08.020. Epub 2014 Oct 2.
Jun Fan 2, Yan Zhang 3, Kai Zhang 3, Bingquan Gao 1, Jun Ma 1, Jian Li 4, Yuchen Deng 1, Qiangjun Zhou 3, Edward H Egelman 5, Victor W Hsu 6, Fei Sun 7
Affiliations
- PMID: 25284369
- PMCID: PMC4198613
- DOI: 10.1016/j.devcel.2014.08.020
A PH domain in ACAP1 possesses key features of the BAR domain in promoting membrane curvature
Xiaoyun Pang et al. Dev Cell. 2014.
Abstract
The BAR (Bin-Amphiphysin-Rvs) domain undergoes dimerization to produce a curved protein structure, which superimposes onto membrane through electrostatic interactions to sense and impart membrane curvature. In some cases, a BAR domain also possesses an amphipathic helix that inserts into the membrane to induce curvature. ACAP1 (Arfgap with Coil coil, Ankyrin repeat, and PH domain protein 1) contains a BAR domain. Here, we show that this BAR domain can neither bind membrane nor impart curvature, but instead requires a neighboring PH (Pleckstrin Homology) domain to achieve these functions. Specific residues within the PH domain are responsible for both membrane binding and curvature generation. The BAR domain adjacent to the PH domain instead interacts with the BAR domains of neighboring ACAP1 proteins to enable clustering at the membrane. Thus, we have uncovered the molecular basis for an unexpected and unconventional collaboration between PH and BAR domains in membrane bending.
Copyright © 2014 Elsevier Inc. All rights reserved.
Figures
Figure 1. BAR-PH domain of ACAP1 is sufficient for membrane binding and tubulation
(A) Binding of different forms of ACAP1 (BAR or BAR-PH) to liposomes of varying sizes (as indicated) is assessed by centrifugation; S, supernatant; P, pellet. (B) Negative-stain electron microscopy visualizing liposomes incubated either with (first row) or without (second row) ACAP1BAR-PH; bar, 200 nm. The diameters of the liposomes are also indicated. (C) Statistical histogram of the diameters of tubules generated by ACAP1BAR-PH, plotted as percentage of all tubules, n = 90 for 50 nm-liposomes, n = 51 for 100 nm-liposomes and n = 95 for 200 nm-liposomes. [See also Figure S1.]
Figure 2. Crystal structure ofACAP1BAR-PH
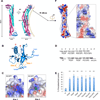
(A) Overall structure of dimeric ACAP1BAR-PH. The two BAR domains are shown in cyan and pink, while the corresponding PH domains are colored in magenta and blue, respectively. Secondary structural elements of BAR domain are labeled as indicated. A hypothetic membrane is depicted according to the curvature (40 nm−1) of the BAR domains. (B) Structure of PH domain in cartoon representation. Secondary structural elements are labeled as indicated. Relevant residues (F280 and Y301) in Loop1 and Loop2 are shown as stick structures. The potential phosphoinositides binding sites (Site 1 and Site 2) are indicated via the orange dashed circles. (C) Site1 and Site2 in the PH domain of ACAP1. The electrostatic potential is mapped onto the surface of the structures, with blue coloring positive charge and red coloring negative charge. The docked inositol ligands for the binding pockets are shown as stick models. For Site 1, the docked PI(3,4,5)P3 is based on the crystal structure of DAPP1 (PDB code, 1FAO). For Site 2, the docked PI(4,5)P2 is based on the crystal structure of ArhGAP9 (PDB code, 2P0D). (D) Binding of ACAP1BAR-PH to liposome that contains various phospholipids (as indicated) is assessed by centrifugation; S, supernatant; P, pellet. (E) Quantitation of results in (D). The level of pelleted protein is expressed as the percentage of the total protein input. All error bars represent standard deviation (s.d.) from three independent experiments. The significances of the differences in comparison to PI containing liposome are expressed as ** for p < 0.001 and * for p < 0.01. (F) Electrostatic surface representation on the concave surface of ACAP1BAR-PH, and a close-up view of the positively charged patches, with blue coloring positive charges and red coloring negative charges. [See also Figure S2.]
Figure 3. Mutagenesis studies to assess membrane binding and tubulation
(A) Binding of mutant forms of ACAP1BAR-PH (as indicated) to liposomes is assessed by centrifugation; S, supernatant; P, pellet. The top panel shows a representative result, while the bottom panel shows quantitation from three independent experiments. All error bars represent the s.d. from three independent experiments. The degree of significance involves comparison between wild-type and different mutants, with ** for p < 0.001 and * for p < 0.01. (B) Binding of mutant forms of ACAP1BAR-PH (as indicated) to liposomes is assessed by centrifugation; S, supernatant; P, pellet. The left panel shows a representative result, while the right panel shows quantitation from three independent experiments. All error bars represent the s.d. from three independent experiments. The degree of significance involves comparison between wild-type and different mutants, with ** for p < 0.001 and * for p < 0.01. (C) Negative-stain electron microscopy visualizing liposome tubulation induced by two mutant forms of ACAP1BAR-PH (as indicated); scale bar, 200nm. (D) The reconstitution of recycling vesicles from endosomal membrane was performed by incubating membrane and cytosol fractions derived from HeLa cells, and then tracking the redistribution of a recycling cargo, TfR, from the compartmental membrane fraction to the vesicular membrane fraction. Cytosol was derived from cells with different treatment as indicated. The level of vesicle formation after the incubation was then quantified. [See also Figure S3.]
Figure 4. CryoEM of ACAP1BAR-PH coating liposomal membrane
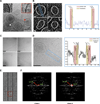
(A) Raw cryoEM micrograph of ACAP1BAR-PH coating liposomes. The coated outer lamellar and the uncoated inner lamellar are indicated by red and white stars, respectively; bar, 100 nm. Insets show magnified views (B) Cryo-electron tomograms of liposomes coated with ACAP1BAR-PH; bar, 20 nm (left panel). A region was selected for line-scanning analysis, as highlighted by the blue rectangle. The integrated density across the liposome is plotted, with the regions for protein coat and membrane indicated and thickness labeled (right panel). (C) Raw cryoEM micrographs of tubules coated with ACAP1BAR-PH; bar, 100 nm. (D) CryoEM micrograph of liposome with tubule coated with ACAP1BAR-PH; bar, 100 nm (left panel). A region was selected for line-scanning analysis, as highlighted by the blue rectangle. The integrated density across the tubule is plotted, with the regions for protein coat and membrane indicated and thickness labeled (right panel). (E) Two-dimensional classification of images showing dynamics of ACAP1BAR-PH coating liposomal tubules. (F) Helical diffraction patterns of tubules exemplifying Class I and II. The Bessel functions for basis vectors are shown and labeled accordingly. [See also Movie S1.]
Figure 5. 3D reconstructions of ACAP1BAR-PH coating tubules
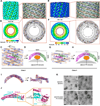
(A) and (B) CryoEM map of a liposomal tubule coated with ACAP1BAR-PH in Class I that is shown in iso-surface representation with the side view in (A) and top view in (B). The map is colored according to the cylinder radius from red to blue. The structural models of ACAP1BAR-PH in cartoon representation are fitted into the map and shown on the right. In (B), the two chains of ACAP1BAR-PH dimer are colored in gold and blue, respectively, and the thickness of the double-layer membrane is labeled. (C) and (D) Structural model of ACAP1BAR-PH helical assembly on the Class I liposomal tubule. The ACAP1BAR-PH tetramer in one asymmetric unit, colored in magenta for one dimer and green for another, is shown with the top view in (C) and side view in (D). The interaction interfaces (I1, I2 and I3) for ACAP1BAR-PH helical assembly are indicated by black circles and labeled in (C). The titling angle of ACAP1BAR-PH tetramer with respect to the cross section of the tubule is depicted on the top. In (D), the membrane region is shown in grey. (E) and (F) CryoEM map of a liposomal tubule coated with ACAP1BAR-PH in Class II that is shown in the side view (E) and the top view (F). The structural models of ACAP1BAR-PH in cartoon representation are fitted into the map and shown on the right. The color and labeling schemes are the same as that described in (A) and (B). (ACAP1 (BAR or BAR-PH) to liposomes of) and (H) Structural model of ACAP1BAR-PH helical assembly on the Class II liposomal tubule. The color and labeling schemes are the same as that described in (C) and (D). (I) Superposition between the ACAP1BAR-PH tetramers of Class I (red) and Class II (blue). (J) Structural basis for designing the fusion version of the ACAP1BAR-PH dimer (BAR/PH-BAR/PH). The overall crystal structure of ACAP1BAR-PH dimer is shown left and labeled with Chain A and Chain B for the two monomers. One distal region is zoomed in and shown (on right). The N-terminus of Chain B and the C-terminus of Chain A are labeled, respectively. The distance between the N-terminus of Chain B and the C-terminus of Chain A is ~37.8 Å. Thus, a linker (green) with the length of 14 amino acids (GGGSGGRLGSSNSG) is predicted to be sufficiently long to covalently link Chain A and Chain B via their termini. (K) Negative-stain electron microscopy visualizing liposome tubulation; bar, 200nm. [See also Figures S4; Movies S2–5.]
Figure 6. Molecular simulation of ACAP1BAR-PH binding to membrane
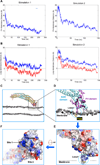
(A) The time evolution of the distance between the center of mass of one PH domain and the surface membrane phosphate plane. (B) The time evolution of the distance between Loop 1 in the PH domain and the surface membrane phosphate plane. The blue tracing tracks the distance between the center of mass of Loop1 and the membrane phosphate plane, while the red tracing tracks the distance between the F280 residue in Loop1 and the surface membrane phosphate plane. Negative values indicate an insertion of a particular protein structure into the membrane. (C) Comparison of the crystal structure (shown in orange) and the final simulated model (shown in cyan and purple) of dimeric ACAP1BAR-PH interacting with the membrane bilayer. Only the phosphate atoms of phospholipids in the membrane are shown for simplification. (D) A zoomed-in view of (C), focusing on the PH domain engaging the membrane. The BAR and PH domains are shown as cartoon representation, and colored in cyan and purple respectively. The critical residue (F280) in Loop1 is shown embedded in membrane and represented in yellow. The phosphate atoms of the membrane phospholipids are shown as grey spheres. (E) Electrostatic surface representation of the PH domain shown in the configuration illustrated in (D). Blue coloring highlights positive charges, while red coloring highlights negative charges. (F) 90° rotation of image shown in (E) to better visualize the membrane-binding surface of the PH domain. The positively charged patches (Site 1 and 2) and the hydrophobic insertion site (Loop1) are indicated. [See also Figure S5 and Movies S6–9.]
Comment in
- A novel twist in membrane dePHormation.
Krauss M, Haucke V. Krauss M, et al. Dev Cell. 2014 Oct 13;31(1):3-4. doi: 10.1016/j.devcel.2014.09.016. Dev Cell. 2014. PMID: 25313957
Similar articles
- ACAP1 assembles into an unusual protein lattice for membrane deformation through multiple stages.
Chan C, Pang X, Zhang Y, Niu T, Yang S, Zhao D, Li J, Lu L, Hsu VW, Zhou J, Sun F, Fan J. Chan C, et al. PLoS Comput Biol. 2019 Jul 10;15(7):e1007081. doi: 10.1371/journal.pcbi.1007081. eCollection 2019 Jul. PLoS Comput Biol. 2019. PMID: 31291238 Free PMC article. - BAR domains as sensors of membrane curvature: the amphiphysin BAR structure.
Peter BJ, Kent HM, Mills IG, Vallis Y, Butler PJ, Evans PR, McMahon HT. Peter BJ, et al. Science. 2004 Jan 23;303(5657):495-9. doi: 10.1126/science.1092586. Epub 2003 Nov 26. Science. 2004. PMID: 14645856 - Cooperation of phosphoinositides and BAR domain proteins in endosomal tubulation.
Shinozaki-Narikawa N, Kodama T, Shibasaki Y. Shinozaki-Narikawa N, et al. Traffic. 2006 Nov;7(11):1539-50. doi: 10.1111/j.1600-0854.2006.00480.x. Epub 2006 Sep 30. Traffic. 2006. PMID: 17010122 - BAR domains and membrane curvature: bringing your curves to the BAR.
Gallop JL, McMahon HT. Gallop JL, et al. Biochem Soc Symp. 2005;(72):223-31. doi: 10.1042/bss0720223. Biochem Soc Symp. 2005. PMID: 15649145 Review. - The BAR-domain family of proteins: a case of bending and binding?
Habermann B. Habermann B. EMBO Rep. 2004 Mar;5(3):250-5. doi: 10.1038/sj.embor.7400105. EMBO Rep. 2004. PMID: 14993925 Free PMC article. Review.
Cited by
- Structural insights into the cooperative remodeling of membranes by amphiphysin/BIN1.
Adam J, Basnet N, Mizuno N. Adam J, et al. Sci Rep. 2015 Oct 21;5:15452. doi: 10.1038/srep15452. Sci Rep. 2015. PMID: 26487375 Free PMC article. - Structural insights into membrane remodeling by SNX1.
Zhang Y, Pang X, Li J, Xu J, Hsu VW, Sun F. Zhang Y, et al. Proc Natl Acad Sci U S A. 2021 Mar 9;118(10):e2022614118. doi: 10.1073/pnas.2022614118. Proc Natl Acad Sci U S A. 2021. PMID: 33658379 Free PMC article. - Structural elucidation of how ARF small GTPases induce membrane tubulation for vesicle fission.
Pang X, Zhang Y, Park K, Liao Z, Li J, Xu J, Hong MT, Yin G, Zhang T, Wang Y, Egelman EH, Fan J, Hsu VW, Park SY, Sun F. Pang X, et al. Proc Natl Acad Sci U S A. 2025 Mar 25;122(12):e2417820122. doi: 10.1073/pnas.2417820122. Epub 2025 Mar 21. Proc Natl Acad Sci U S A. 2025. PMID: 40117306 - Structural Basis of Phosphatidic Acid Sensing by APH in Apicomplexan Parasites.
Darvill N, Dubois DJ, Rouse SL, Hammoudi PM, Blake T, Benjamin S, Liu B, Soldati-Favre D, Matthews S. Darvill N, et al. Structure. 2018 Aug 7;26(8):1059-1071.e6. doi: 10.1016/j.str.2018.05.001. Epub 2018 Jun 14. Structure. 2018. PMID: 29910186 Free PMC article. - Structural elucidation of how ARF small GTPases induce membrane tubulation for vesicle fission.
Pang X, Zhang Y, Park K, Liao Z, Li J, Xu J, Hong MT, Yin G, Zhang T, Wang Y, Egelman EH, Fan J, Park SY, Hsu VW, Sun F. Pang X, et al. bioRxiv [Preprint]. 2023 Dec 20:2023.12.19.572083. doi: 10.1101/2023.12.19.572083. bioRxiv. 2023. PMID: 38187566 Free PMC article. Updated. Preprint.
References
- Bailey S. The Ccp4 Suite - Programs for Protein Crystallography. Acta Crystallogr D. 1994;50:760–763. - PubMed
- Brunger AT, Adams PD, Clore GM, DeLano WL, Gros P, Grosse-Kunstleve RW, Jiang JS, Kuszewski J, Nilges M, Pannu NS, et al. Crystallography & NMR system: A new software suite for macromolecular structure determination. Acta Crystallogr D Biol Crystallogr. 1998;54:905–921. - PubMed
Publication types
MeSH terms
Substances
Grants and funding
- GM058615/GM/NIGMS NIH HHS/United States
- R01 GM073016/GM/NIGMS NIH HHS/United States
- R01 GM058615/GM/NIGMS NIH HHS/United States
- GM073016/GM/NIGMS NIH HHS/United States
- R01 EB001567/EB/NIBIB NIH HHS/United States
- R37 GM058615/GM/NIGMS NIH HHS/United States
LinkOut - more resources
Full Text Sources
Other Literature Sources
Molecular Biology Databases
Research Materials


