Astaxanthin inhibits JAK/STAT-3 signaling to abrogate cell proliferation, invasion and angiogenesis in a hamster model of oral cancer - PubMed (original) (raw)
Astaxanthin inhibits JAK/STAT-3 signaling to abrogate cell proliferation, invasion and angiogenesis in a hamster model of oral cancer
J Kowshik et al. PLoS One. 2014.
Abstract
Identifying agents that inhibit STAT-3, a cytosolic transcription factor involved in the activation of various genes implicated in tumour progression is a promising strategy for cancer chemoprevention. In the present study, we investigated the effect of dietary astaxanthin on JAK-2/STAT-3 signaling in the 7,12-dimethylbenz[a]anthracene (DMBA)-induced hamster buccal pouch (HBP) carcinogenesis model by examining the mRNA and protein expression of JAK/STAT-3 and its target genes. Quantitative RT-PCR, immunoblotting and immunohistochemical analyses revealed that astaxanthin supplementation inhibits key events in JAK/STAT signaling especially STAT-3 phosphorylation and subsequent nuclear translocation of STAT-3. Furthermore, astaxanthin downregulated the expression of STAT-3 target genes involved in cell proliferation, invasion and angiogenesis, and reduced microvascular density, thereby preventing tumour progression. Molecular docking analysis confirmed inhibitory effects of astaxanthin on STAT signaling and angiogenesis. Cell culture experiments with the endothelial cell line ECV304 substantiated the role of astaxanthin in suppressing angiogenesis. Taken together, our data provide substantial evidence that dietary astaxanthin prevents the development and progression of HBP carcinomas through the inhibition of JAK-2/STAT-3 signaling and its downstream events. Thus, astaxanthin that functions as a potent inhibitor of tumour development and progression by targeting JAK/STAT signaling may be an ideal candidate for cancer chemoprevention.
Conflict of interest statement
Competing Interests: The authors have declared that no competing interests exist.
Figures
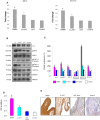
Figure 1. mRNA and protein expression of JAK-2 and STAT-3 in the buccal pouch tissues of experimental and control animals.
(mean ± SD; n = 3). A. Transcript expression level of JAK-2 and STAT-3 in various experimental groups as determined by kinetic PCR. Data are the mean ± SD of three independent experiments. ♣p<0.05 versus control. *p<0.05 versus DMBA. B. Representative immunoblot analysis. Protein samples (100 μg/lane) resolved on SDS-PAGE were probed with corresponding antibodies. GAPDH was used as loading control for cytosol and whole tissue homogenates. Histone H2B was used as loading control for nuclear proteins. Phosphorylated proteins are normalized by their unphosphorylated form. C. Densitometric analysis. The protein expression from control lysates for three determinations was designated as 100% in the graph. Each bar represents the protein expression of three determinations. ♣p<0.05 versus control. *p<0.05 versus DMBA. D. Levels of pSTATtyr705 (ELISA). E. Representative photomicrographs of immunohistochemical staining of pSTAT-3 in control and experimental animals (20X).
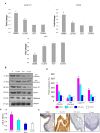
Figure 2. mRNA and protein expression of p21, Cyclin D1 and PCNA in the buccal pouch tissues of experimental and control animals.
(mean ± SD; n = 3). A. Transcript expression level of p21, cyclin D1 and PCNA in various experimental groups as determined by kinetic PCR. Data are the mean ± SD of three independent experiments. ♣p<0.05 versus control. *p<0.05 versus DMBA. B. Representative immunoblot analysis. Protein samples (100 μg/lane) resolved on SDS-PAGE were probed with corresponding antibodies. GAPDH was used as loading control for cytosol and whole tissue homogenates. Histone H2B was used as loading control for nuclear proteins. C. Densitometric analysis. The protein expression from control lysates for three determinations was designated as 100% in the graph. Each bar represents the protein expression of three determinations. ♣p<0.05 versus control. p<0.05 versus DMBA. D. Levels of total cyclin D1 (ELISA). E. Representative photomicrographs of immunohistochemical staining of PCNA in control and experimental animals (20X).
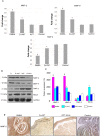
Figure 3. mRNA and protein expression of MMP-2, MMP-9, TIMP-2 and RECK in the buccal pouch tissues of experimental and control animals.
(mean ± SD; n = 3). A. Transcript expression level of MMP-2, MMP-9 and TIMP-2 in various experimental groups as determined by kinetic PCR. Data are the mean ± SD of three independent experiments. ♣p<0.05 versus control. *p<0.05 versus DMBA. B & C. Representative immunoblots and bar graph representing the protein expression of MMP-2, MMP-9, TIMP-2 and RECK for minimum of three independent experiments. ♣p<0.05 versus control. *p<0.05 versus DMBA. D. Representative photomicrographs of immunohistochemical staining of MMP-2 in control and experimental animals (20X).
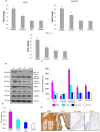
Figure 4. mRNA and protein expression of HIF-1α, VEGF and VEGFR2 in the buccal pouch tissues of experimental and control animals.
(mean ± SD; n = 3). A. Transcript expression level of HIF-1α, VEGF and VEGFR2 in various experimental groups as determined by kinetic PCR. Data are the mean ± SD of three independent experiments. ♣p<0.05 versus control. *p<0.05 versus DMBA. B. Representative immunoblot analysis. Protein samples (100 μg/lane) resolved on SDS-PAGE were probed with corresponding antibodies. GAPDH was used as loading control for cytosol and whole tissue homogenates. Histone H2B was used as loading control for nuclear proteins. C. Densitometric analysis. The protein expression from control lysates for three determinations was designated as 100% in the graph. Each bar represents the protein expression of three determinations. ♣p<0.05 versus control. *p<0.05 versus DMBA. D. Levels of pVEGFR2tyr1175 (ELISA). E. Representative photomicrographs of immunohistochemical staining of VEGF in control and experimental animals (20X).
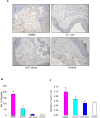
Figure 5. Effect of astaxanthin on microvascular density.
A. Representative photomicrographs of microvascular density in control and experimental animals (40X). B. Bar graph representing number of vessels for minimum of three independent experiments. ♣p<0.05 versus control. *p<0.05 versus DMBA. C. Bar graph representing vessel length for minimum of three independent experiments. ♣p<0.05 versus control. p<0.05 versus DMBA.
Figure 6. Molecular Docking.
A. Represents AXT form hydrogen bond with Met 1428, Glu 1523, Arg 1593 and Asn 538 of STAT-3. B. Represents AXT form hydrogen bond with ASP 41 of VEGF.
Figure 7. Effect of astaxanthin on cell viability and cell proliferation in ECV304 cells.
A. IC50 value for astaxanthin on ECV304 cells (Alamar Blue assay). B. Effect of astaxanthin (50 µM) on hypoxia induced cell proliferation (Alamar blue assay). *p<0.05 versus normoxia. C. Effect of astaxanthin (50 µM) on hypoxia induced cell proliferation (BrdU assay). *p<0.05 versus normoxia.
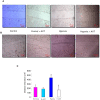
Figure 8. Effect of astaxanthin on the migration of ECV304 cells.
A & B. Representative photomicrographs of migration assay in control and hypoxic ECV cells at 0 h and 24 h (4X). C. Bar graph representing distance migrated for minimum of three independent experiments. ♣p<0.05 versus normoxia. p<0.05 versus hypoxia.
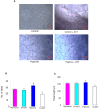
Figure 9. Effect of astaxanthin on tube formation in ECV304 cells.
A. Representative photomicrographs of matrigel tube formation assay in control and hypoxic ECV cells (4X). B. Bar graph representing no. of tubes for minimum of three independent experiments. ♣p<0.05 versus normoxia. *p<0.05 versus hypoxia. C. Bar graph representing tube length for minimum of three independent experiments. ♣p<0.05 versus normoxia. *p<0.05 versus hypoxia.
Figure 10. Effect of astaxanthin on the expression of HIF-1α, VEGF, and MMP-2 in normoxic and hypoxic ECV304 cells.
A & B. Representative immunoblots and bar graph representing protein expression of HIF-1α, VEGF and MMP-2 for minimum of three independent experiments. *p<0.05 versus hypoxia.
Figure 11. Schematic representation of the mechanism of action of astaxanthin in DMBA induced oral cancer.
Dietary supplementation of astaxanthin abrogates DMBA induced oral cancer by targeting JAK/STAT-3 signaling. Astaxanthin prevents the phosphorylation and nuclear translocation of STAT-3 thereby prevents the transactivation of STAT-3 target genes which are involved in cell proliferation, invasion and angiogenesis. Furthermore astaxanthin also prevents nuclear translocation of HIF-1α, the master regulator of angiogenesis.
Similar articles
- Diosmin induce apoptosis through modulation of STAT-3 signaling in 7,12 dimethylbenz(a)anthracene induced harmster buccal pouch carcinogenesis.
Rajasekar M, Suresh K, Sivakumar K. Rajasekar M, et al. Biomed Pharmacother. 2016 Oct;83:1064-1070. doi: 10.1016/j.biopha.2016.08.019. Epub 2016 Aug 19. Biomed Pharmacother. 2016. PMID: 27544550 - Blueberry inhibits invasion and angiogenesis in 7,12-dimethylbenz[a]anthracene (DMBA)-induced oral squamous cell carcinogenesis in hamsters via suppression of TGF-β and NF-κB signaling pathways.
Baba AB, Kowshik J, Krishnaraj J, Sophia J, Dixit M, Nagini S. Baba AB, et al. J Nutr Biochem. 2016 Sep;35:37-47. doi: 10.1016/j.jnutbio.2016.06.002. Epub 2016 Jun 19. J Nutr Biochem. 2016. PMID: 27371785 - Astaxanthin inhibits hallmarks of cancer by targeting the PI3K/NF-κΒ/STAT3 signalling axis in oral squamous cell carcinoma models.
Kowshik J, Nivetha R, Ranjani S, Venkatesan P, Selvamuthukumar S, Veeravarmal V, Nagini S. Kowshik J, et al. IUBMB Life. 2019 Oct;71(10):1595-1610. doi: 10.1002/iub.2104. Epub 2019 Jun 28. IUBMB Life. 2019. PMID: 31251469 - Targeting Janus Kinases and Signal Transducer and Activator of Transcription 3 to Treat Inflammation, Fibrosis, and Cancer: Rationale, Progress, and Caution.
Bharadwaj U, Kasembeli MM, Robinson P, Tweardy DJ. Bharadwaj U, et al. Pharmacol Rev. 2020 Apr;72(2):486-526. doi: 10.1124/pr.119.018440. Pharmacol Rev. 2020. PMID: 32198236 Free PMC article. Review. - Role of STAT3 in the initiation, progression, proliferation and metastasis of breast cancer and strategies to deliver JAK and STAT3 inhibitors.
Dinakar YH, Kumar H, Mudavath SL, Jain R, Ajmeer R, Jain V. Dinakar YH, et al. Life Sci. 2022 Nov 15;309:120996. doi: 10.1016/j.lfs.2022.120996. Epub 2022 Sep 25. Life Sci. 2022. PMID: 36170890 Review.
Cited by
- Signaling pathways and targeted therapy for myocardial infarction.
Zhang Q, Wang L, Wang S, Cheng H, Xu L, Pei G, Wang Y, Fu C, Jiang Y, He C, Wei Q. Zhang Q, et al. Signal Transduct Target Ther. 2022 Mar 10;7(1):78. doi: 10.1038/s41392-022-00925-z. Signal Transduct Target Ther. 2022. PMID: 35273164 Free PMC article. Review. - RAR-Related Orphan Receptor: An Accelerated Preeclampsia Progression by Activating the JAK/STAT3 Pathway.
Yu Y, Zhu T. Yu Y, et al. Yonsei Med J. 2022 Jun;63(6):554-563. doi: 10.3349/ymj.2022.63.6.554. Yonsei Med J. 2022. PMID: 35619579 Free PMC article. - Antioxidants and Therapeutic Targets in Ovarian Clear Cell Carcinoma.
Amano T, Murakami A, Murakami T, Chano T. Amano T, et al. Antioxidants (Basel). 2021 Jan 28;10(2):187. doi: 10.3390/antiox10020187. Antioxidants (Basel). 2021. PMID: 33525614 Free PMC article. Review. - Astaxanthin and its Effects in Inflammatory Responses and Inflammation-Associated Diseases: Recent Advances and Future Directions.
Chang MX, Xiong F. Chang MX, et al. Molecules. 2020 Nov 16;25(22):5342. doi: 10.3390/molecules25225342. Molecules. 2020. PMID: 33207669 Free PMC article. Review. - Procyanidins mediates antineoplastic effects against non-small cell lung cancer via the JAK2/STAT3 pathway.
Wu Y, Liu C, Niu Y, Xia J, Fan L, Wu Y, Gao W. Wu Y, et al. Transl Cancer Res. 2021 May;10(5):2023-2035. doi: 10.21037/tcr-20-3018. Transl Cancer Res. 2021. PMID: 35116524 Free PMC article.
References
- Rajendran P, Li F, Shanmugam MK, Kannaiyan R, Goh JN, et al. (2012) Celastrol suppresses growth and induces apoptosis of human hepatocellular cancer through the modulation of STAT3/JAK2 signaling cascade in vitro and in vivo. Cancer Prev Res (Phila) 5: 631–643. - PubMed
Publication types
MeSH terms
Substances
Grants and funding
This work was supported by a grant from the Department of Biotechnology, New Delhi, India under the 7th FP of the Indo-EU Joint Collaborative Project on ‘FUNCFOOD’. The funders had no role in study design, data collection and analysis, decision to publish, or preparation of the manuscript.
LinkOut - more resources
Full Text Sources
Other Literature Sources
Medical
Miscellaneous
