Clathrin regenerates synaptic vesicles from endosomes - PubMed (original) (raw)
. 2014 Nov 13;515(7526):228-33.
doi: 10.1038/nature13846. Epub 2014 Oct 8.
Affiliations
- PMID: 25296249
- PMCID: PMC4291189
- DOI: 10.1038/nature13846
Clathrin regenerates synaptic vesicles from endosomes
Shigeki Watanabe et al. Nature. 2014.
Abstract
Ultrafast endocytosis can retrieve a single, large endocytic vesicle as fast as 50-100 ms after synaptic vesicle fusion. However, the fate of the large endocytic vesicles is not known. Here we demonstrate that these vesicles transition to a synaptic endosome about one second after stimulation. The endosome is resolved into coated vesicles after 3 s, which in turn become small-diameter synaptic vesicles 5-6 s after stimulation. We disrupted clathrin function using RNA interference (RNAi) and found that clathrin is not required for ultrafast endocytosis but is required to generate synaptic vesicles from the endosome. Ultrafast endocytosis fails when actin polymerization is disrupted, or when neurons are stimulated at room temperature instead of physiological temperature. In the absence of ultrafast endocytosis, synaptic vesicles are retrieved directly from the plasma membrane by clathrin-mediated endocytosis. These results may explain discrepancies among published experiments concerning the role of clathrin in synaptic vesicle endocytosis.
Figures
Extended Data Fig. 1
Ultrafast endocytosis regenerates synaptic vesicles in a two-step process. Ultrafast endocytosis removes membrane added by vesicle fusion at the lateral edge of the active zone. Large endocytic vesicles then fuse to endosomes. Endosomes are resolved into synaptic vesicles via a clathrin-dependent process. Newly formed synaptic vesicles can be recruited back to the active zone.
Extended Data Fig. 2
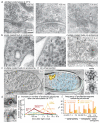
Synaptic vesicles are regenerated from endosomes at 37°C. Hippocampal synapses were stimulated once and frozen at the indicated times. The experiments were performed at 37°C in the presence of 4 mM external Ca2+. (a) Electron micrographs showing invaginations and large endocytic vesicles (arrowheads) recovered via ultrafast endocytosis. (b) Micrographs showing single coated buds (left, middle) or multiple buds (right) forming on an endosome. (c) Virtual section from an electron tomogram (left) and reconstruction (middle) showing a synaptic endosome with buds following a single stimulus. The average intensity of coated buds from the top 20 nm (right, top) and the bottom 40 nm (right, bottom) is shown. Clathrin-cages can be preserved in our fixation and are visible in the tomogram. We found a total of 32 endosomes in these reconstructions (14 endosomes in the unstimulated control and 28 endosomes 3 seconds after stimulation). Of the total 32 endosomes, none were connected to the plasma membrane or showed evidence of a truncated tubule extending from the endosomal membrane. Of the 14 unstimulated endosomes, 8 were contained within single tomograms, and are therefore unambiguously closed on both ends. Of the 28 endosomes in stimulated synapses, 16 endosomes were contained within single tomograms so that it was clear that no attachment to the plasma membrane was possible. (d) Examples of a coated pit on the plasma membrane (top) and a coated bud on an endosome (bottom). Note that the morphology of the coats is similar. (e) Increase in the number of each endocytic structure per synaptic profile after a single stimulus at 37°C. The prevalence of large endocytic vesicles and endosomes is followed by an increase in the number of clathrin-coated vesicles. Coated pits were not observed on the plasma membrane (PM). (f) Frequency of profiles or tomograms that contain endosomal structures at 37°C. Roughly, 60% of unstimulated synapses contained one endosome. One second after stimulation, 60% of the synapses contained at least one endosome, and half of those synapses contained two endosomes. Three seconds after stimulation, ~30% of the synapses contained budded endosomes and clathrin-coated vesicles, suggesting that those synapses were active. The standard error of the mean is shown in each graph. For N values, detailed numbers and statistical analysis, _see_Supplementary Table 1.
Extended Data Fig. 3
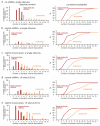
Large endocytic vesicles likely fuse to become synaptic endosomes. (a-e) Histograms (left) and cumulative plots (right), showing the size of large endocytic vesicles (red) and endosomes (orange) after one stimulus from control cells without ferritin (a), scrambled shRNA infected cells (b), and clathrin knock-down cells (c) both with ferritin. 10 stimuli were applied to scrambled shRNA (d) or clathrin knock-down cells (e). The large endocytic vesicles are defined as those that are within 50 nm of active zone and larger than a synaptic vesicle by visual inspection. Endosomes are defined as large vesicles greater than 50 nm from the active zone (often in the center of the bouton) and are larger than ~100 nm. Any vesicular compartment that has coated buds in the center of the bouton is also categorized as an endosome. The numbers of endocytic structures in (a) represent all the structures scored from 100 ms and 300 ms time points. The number of large vesicles and endosomes in (b-e) represent all the ferritin-positive structures from later time points (3, 10, and 20 s). In the control shRNA (b), the number of large endocytic vesicles and endosomes has declined by these late time points, whereas the ferritin is trapped in large endocytic vesicles and synaptic endosomes in the clathrin knock-down experiments. Because ferritin passes from large endocytic vesicles to even larger budded endosomes, it is likely that the endocytic vesicles fuse with either each other or an existing compartment.
Extended Data Fig. 4
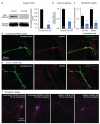
Clathrin shRNA reduces clathrin expression. (a) Left, western blot showing clathrin levels after one-week expression of a scrambled shRNA control or clathrin heavy chain shRNA in cultured hippocampal neurons. Right, an 80% reduction was observed (n=3, p <0.001, paired T-test). (b) Normalized ratio of clathrin heavy chain and synaptophysin fluorescence in control and clathrin knock-down (chc KD) cultures. The clathrin/synaptophysin ratio is reduced to 64% in the knock-down cells. (c) The mean fluorescence intensity (normalized to 30 min) representing the amount of transferrin uptake in control and knock-down cells. Transferrin uptake was reduced by 66% in the knock-down cells. (d, e) Fluorescence images of immuno-cytochemical staining of hippocampal autaptic cultures using anti-synaptophysin (left), anti-clathrin heavy chain (middle), and merge in control (d) and clathrin knock-down cultures (e). (f) Example micrographs of hippocampal mass cultures showing transferrin uptake. The standard error of the mean is shown. *** indicates p-value of <0.001. For detailed numbers and statistical analysis,_see_Supplementary Table 1.
Extended Data Fig. 5
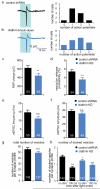
Exocytic machinery is intact in the clathrin knock-down cells. Sample traces from cell-attached voltage clamp during light stimulation in control (a) and clathrin knock-down (b). Number of action potentials triggered during the 10 ms light pulse is shown to the right. (c) Readily-releasable pool (RRP) in control and clathrin knock-down cells, defined by brief application of 500 mM sucrose to autaptic neurons (control: 622±56 pC, knockdown: 443±52 pC, p<0.01). (d) Vesicular release probability (Pvr) in these cells (control 5.4±0.4%, n=54; knock-down 3.5±0.4%, n=48; p<0.001). (e, f) Average miniature EPSC (mEPSC) frequency (e) and amplitude (f). No change was observed in knockdown cells. (g) Average number of synaptic vesicles per synaptic profile (n = 142 synapses for control and 137 for knockdown). (h) Average number of docked vesicles in active zones per synaptic profile (control: no stimulation, 1.5 ± 0.1, n = 142 synapses; 100 ms, 0.8 ± 0.1, n = 142 synapses; knockdown: no stimulation, 1.2 ± 0.1, n = 137 synapses; 100 ms after stimulation, 1.0 ± 0.1, n = 149 synapses). The fraction of docked vesicles that fuse is greatly reduced by clathrin knockdown. P-values are calculated against the unstimulated control shRNA cells. The standard error of the mean is shown in each graph. ***, **, and * indicate p-value of <0.001, <0.01, <0.05, respectively. n.s., ‘not significant’.
Extended Data Fig. 6
Following a single stimulus, clathrin is required at endosomes to regenerate synaptic vesicles. (a) Virtual section from an electron tomogram (left) and a reconstruction (right) showing a budded synaptic endosome containing ferritin particles in the scrambled shRNA control cell. We found a total of 33 endosomes in these reconstructions. Of these 33 endosomes, none were connected to the plasma membrane or showed evidence of a tubule extending from the endosomal membrane. 17 of these 33 total endosomes were fully contained within the 200 nm tomogram. Of these 33 endosomes, 16 were ferritin-positive, and 8 of these16 endosomes were fully contained in the tomogram. (b) Micrographs showing ferritin-positive synaptic vesicles docked to active zone 10-20 s after stimulation. (c) Average number of ferritin particles in large endocytic vesicles, clathrin-coated vesicles, and synaptic vesicles per synaptic profile examined. At least 134 synapses were analyzed per time point. Ferritin progresses to synaptic vesicles in the control, but is trapped in large endocytic vesicles or endosomes in the clathrin knock-down. The fraction of synaptic profiles with ferritin was 27% for the control and 31% in the knockdown, suggesting that 70% of the synapses were silent. The mean number of ferritin particles found in an individual endosome, clathrin-coated vesicle, and synaptic vesicle, are 9.3 ± 1.0, 2.0 ± 0.2, and 1.9 ± 0.2, respectively. The total number of ferritin particles (indicated above), declined by 40% in the control relative to the 1 s time point but not in the knockdown, either due to the fusion of the newly formed synaptic vesicles or by return of excess membrane to the surface of the synapse. The standard error of the mean is shown. (d) Distribution of ferritin-positive clathrin-coated vesicles (yellow) and synaptic vesicles (blue) relative to the active zone at defined time points after stimulation in the control cells. Numbers are binned by 50 nm. The first bin ‘0 nm’ means vesicles are docked in active zone. Endosomes are found at 285 ± 38 nm from the active zone. Note that the data in this figure represent further analysis of the data shown in Fig. 3.
Extended Data Fig. 7
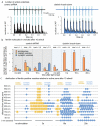
Following high-frequency stimulation, clathrin is required at endosomes to regenerate synaptic vesicles. (a) Average number of action potentials in 10 ms bins relative to light pulses during high-frequency stimulation (10 stimuli at 20Hz, 0.5 s). Sample traces are shown above. Each light pulse triggered at least one action potential in both control and clathrin shRNA-treated cultures. (b) Average number of ferritin molecules in large endocytic vesicles, clathrin-coated vesicles, and synaptic vesicles per profile examined. Ferritin is transferred from large endocytic vesicles to synaptic vesicles in the control but is trapped in large endocytic vesicles or endosomes in the clathrin knock-down. The number of profiles with ferritin particles after stimulation was 34% in the control and 36% in the clathrin knock-down, suggesting that 65% of the synapses were silent. On average, the number of ferritin molecules found in an individual endosome, clathrin-coated vesicle, and synaptic vesicle, are 9.2 ± 1.0,1.9 ± 0.3, and 2.0 ± 0.2. At least 142 synapses were analyzed per time point. The total number of ferritin particles (indicated above each time point), declined by 36% in the control, and by 23% in the knockdown relative to the 1 s time point. (c) Distribution of ferritin-positive clathrin-coated vesicles (yellow) and synaptic vesicles (blue) relative to the active zone at defined time points after stimulation in the control shRNA cells. Numbers are binned by 50 nm. The first bin ‘0 nm’ means vesicles are docked at the active zone. Endosomes are found at 286 ± 43 nm from the active zone. The standard error of the mean is shown in each graph. Note that this figure is a supplemental data figure for Fig. 4 and represents the further analysis of the data from Fig. 4.
Extended Data Fig. 8
Pitstop 2 blocks regeneration of synaptic vesicles from endosomes after high-frequency stimulation. Pitstop 2 is an inhibitor of clathrin terminal domain and blocks clathrin-mediated endocyotosis. (a, c) Electron micrographs showing ferritin containing vesicles in DMSO-treated (a) and Pitstop 2-treated cells (c) at different time points after stimulation. Ferritin is found in large vesicles after stimulation (middle) and in synaptic vesicles (right) in control, but it is trapped in endosomes in the Pitstop 2-treated cells. (b,d) Average increase in ferritin-positive structures per synaptic profile in DMSO-treated (b) or Pitstop 2-treated cells (d). Ferritin progressed to synaptic vesicle-like structures in the control but remained in endosomes or large endocytic vesicles in Pitstop 2-treated cells. Clathrin-coated pits on the plasma membrane were not present at any time point and were not plotted. At least 140 synapses were analyzed per time point. (e) Virtual section from an electron tomogram (left) and a reconstruction (right) showing a synaptic endosome with buds following 10 stimuli at 20 Hz. Of 32 tomograms reconstructed from 3 s time point, 25 of them showed at least one endosome in the terminal, and 7 showed budded endosomes. None of these endosomes were connected to the plasma membrane. The standard error of the mean is shown in each graph. For detailed numbers and statistical analysis, _see_Supplementary Table 1.
Extended Data Fig. 9
Synaptic vesicles are regenerated directly from the plasma membrane in the absence of ultrafast endocytosis. Average diameter of clathrin-coated pits, clathrin-coated vesicles, and synaptic vesicles in the latrunculin-A-treated cells (a) or cells incubated at 22°C for 5 min (b). The diameter of these structures is similar suggesting a precursor- product relationship. Diameter of coated pits was determined by the full-width at the half maximum depth of the pit. For detailed numbers and statistical analysis, _see_Supplementary Table 1
Fig. 1
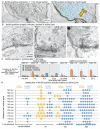
Synaptic vesicles are regenerated from endosomes at 34°C. Hippocampal synapses were stimulated once and frozen at the indicated times. (a) Electron micrographs showing invaginations and large endocytic vesicles (arrowheads) recovered via ultrafast endocytosis. Arrow, an endosome in the center of the bouton. (b, c) Micrographs showing single coated buds (b) and multiple coated buds (c) forming on an endosome. (d) Increase in the number of each endocytic structure per synaptic profile after a single stimulus. ~60% of synapses had endosomes in the unstimulated control; this baseline value was subtracted from endosome numbers. After stimulation two endosomes were observed in 30% of the synapses. The prevalence of large endocytic vesicles and endosomes is followed by an increase in the number of clathrin-coated vesicles. Coated pits were rarely observed on the plasma membrane (PM). The standard error of the mean is shown in each graph. For N values, detailed numbers and statistical analysis,_see_Supplementary Table 1.
Fig. 2
Ultrafast endocytosis is clathrin-independent. (a) Top, average traces for excitatory post-synaptic currents (EPSCs) in a control and a clathrin knock-down neuron from autaptic cultures. Bottom, mean amplitude of EPSCs. The amplitude is reduced by 41% in the knock-down cells. (b) An electron micrograph of a synapse frozen 100 ms after stimulation. Ultrafast endocytic pits (arrows) are observed flanking the active zone. PSD, postsynaptic density. (c) Average number of endocytic pits, and large endocytic vesicles in control and clathrin knock-down neurons with or without stimulation (control 100 ms: 0.17 ± 0.03 endocytic structures/profile; knock-down 100 ms: 0.10 ± 0.03 endocytic structures/profile, p = 0.06). The p-values are calculated against the matched time points in the control shRNA treated cells. *** indicates p-value of <0.001. n.s., ‘not significant’. The standard error of the mean is shown in each graph. For N values, detailed numbers and statistical analysis, _see_Supplementary Table 1.
Fig. 3
Following a single stimulus, clathrin is required at endosomes to regenerate synaptic vesicles. (a,c) Electron micrographs showing ferritin uptake in control (a) and clathrin knock-down (c) synapses at different time points after stimulation. In control neurons, ferritin is observed in large endocytic vesicles after stimulation (middle) and in synaptic vesicles (right), but it is trapped in endosomes in the clathrin knock-down cells. (b, d) Average increase in ferritin-positive endocytic structures in all profiles. (b) In control cells, the total number of synapses containing ferritin remained at 26% at the 3, 10, and 20 s time points; suggesting that 74% of synapses were silent. The number of synaptic vesicles is higher because after an endosome is resolved it leads to ~2 vesicles that contain a clump of ferritin. The number of clathrin-coated vesicles is less than expected given that endosomes contain 5-8 synaptic vesicles worth of membrane. This discrepancy is likely because synaptic vesicles will be distributed among many thin sections. (d) In the clathrin knockdown ferritin stalled in endosomes and did not progress into synaptic vesicles. Clathrin-coated pits were not present on the plasma membrane at any time point and are therefore not plotted. Black arrows indicate ferritin-positive structures. Black arrowhead in (a) represents ferritin-positive synaptic vesicles docked in active zone. The standard error of the mean is shown in each graph. For N values, detailed numbers and statistical analysis, _see_Supplementary Table 1.
Fig. 4
Following high-frequency stimulation, clathrin is required at endosomes to regenerate synaptic vesicles. (a, c) Electron micrographs showing ferritin uptake in control (a) and clathrin knock-down neurons (c) at different time points after stimulation. Black arrows indicate ferritin-positive structures. (b, d) Average number of ferritin-positive endocytic structures increased compared to unstimulated cells (0 ms time point) infected with control shRNA (b) or clathrin knock-down shRNA (d). Clathrin-coated pits were not present on the plasma membrane at any time points and thus not plotted. In the controls, synapses which exhibited ferritin uptake remained at 32% but the number of ferritin structures per profile increased because endosomes were typically resolved into ~2 ferritin-positive vesicles. (e) Virtual section from an electron tomogram (left) and reconstruction (right) showing a string of large endocytic vesicles trapped on the membrane by dynasore treatment following 100 stimuli at 20 Hz. Multiple large endocytic vesicles (black arrows) are attached to one another and remain connected to the plasma membrane. (f) Fraction of tomograms that contain vesicle strings attached to the plasma membrane following 1, 3, 10, 30, and 100 stimuli (20 Hz). Tomograms from 100 nm thick sections were reconstructed for each time point; only 1 vesicle string appeared in a given terminal. The number of tomograms with a vesicle string reached 31% following 100 stimuli, suggesting that ~70% of synapses are silent in these preparations. The number of vesicles on a string increases with repetitive stimulation: 1 stimulus (no vesicle string); 3 stimuli (2 vesicles / string); 10 stimuli (2.3 vesicles /string), 30 stimuli (5.6 vesicles/ string); and 100 stimuli (4.8 vesicles/ string). However, these are likely underestimates because strings that extend into neighboring sections are not captured in these tomograms. The standard error of the mean is shown in each graph. For N values, detailed numbers and statistical analysis, _see_Supplementary Table 1.
Fig. 5
Clathrin regenerates synaptic vesicles from plasma membrane in the absence of ultrafast endocytosis. Electron micrographs showing a synaptic terminal 3 s after a single stimulus from cells incubated with 0.1% DMSO (a), with 10 μM latrunculin-A (c), at 34°C (e), and at 22°C (g). (b,d,f,h) Average number of endocytic structures in profiles infected with control shRNA (b), clathrin knock-down cells (d), cells incubated at 34°C (f), and cells incubated at 22°C (h). The total number of structures per profile is plotted. Large vesicles accumulated in the center of the bouton, likely reflecting the fusion of small endocytic vesicles to endosomes. The standard error of the mean is shown in each graph. For N values, detailed numbers and statistical analysis, _see_Supplementary Table 1.
Comment in
- Neuroscience: towards unified vesicle endocytosis.
Lučić V. Lučić V. Nature. 2014 Nov 13;515(7526):207-8. doi: 10.1038/nature13925. Epub 2014 Oct 8. Nature. 2014. PMID: 25296252 No abstract available.
Similar articles
- Synaptic Vesicle Endocytosis Occurs on Multiple Timescales and Is Mediated by Formin-Dependent Actin Assembly.
Soykan T, Kaempf N, Sakaba T, Vollweiter D, Goerdeler F, Puchkov D, Kononenko NL, Haucke V. Soykan T, et al. Neuron. 2017 Feb 22;93(4):854-866.e4. doi: 10.1016/j.neuron.2017.02.011. Neuron. 2017. PMID: 28231467 - Synaptojanin and Endophilin Mediate Neck Formation during Ultrafast Endocytosis.
Watanabe S, Mamer LE, Raychaudhuri S, Luvsanjav D, Eisen J, Trimbuch T, Söhl-Kielczynski B, Fenske P, Milosevic I, Rosenmund C, Jorgensen EM. Watanabe S, et al. Neuron. 2018 Jun 27;98(6):1184-1197.e6. doi: 10.1016/j.neuron.2018.06.005. Neuron. 2018. PMID: 29953872 Free PMC article. - Fast and ultrafast endocytosis.
Watanabe S, Boucrot E. Watanabe S, et al. Curr Opin Cell Biol. 2017 Aug;47:64-71. doi: 10.1016/j.ceb.2017.02.013. Epub 2017 Apr 6. Curr Opin Cell Biol. 2017. PMID: 28391090 Review. - The synaptic vesicle cycle: a single vesicle budding step involving clathrin and dynamin.
Takei K, Mundigl O, Daniell L, De Camilli P. Takei K, et al. J Cell Biol. 1996 Jun;133(6):1237-50. doi: 10.1083/jcb.133.6.1237. J Cell Biol. 1996. PMID: 8682861 Free PMC article. - The Synaptic Vesicle Cycle Revisited: New Insights into the Modes and Mechanisms.
Chanaday NL, Cousin MA, Milosevic I, Watanabe S, Morgan JR. Chanaday NL, et al. J Neurosci. 2019 Oct 16;39(42):8209-8216. doi: 10.1523/JNEUROSCI.1158-19.2019. J Neurosci. 2019. PMID: 31619489 Free PMC article. Review.
Cited by
- Endosome-mediated endocytic mechanism replenishes the majority of synaptic vesicles at mature CNS synapses in an activity-dependent manner.
Park J, Cho OY, Kim JA, Chang S. Park J, et al. Sci Rep. 2016 Aug 18;6:31807. doi: 10.1038/srep31807. Sci Rep. 2016. PMID: 27534442 Free PMC article. - Clathrin-associated carriers enable recycling through a kiss-and-run mechanism.
Xu J, Liang Y, Li N, Dang S, Jiang A, Liu Y, Guo Y, Yang X, Yuan Y, Zhang X, Yang Y, Du Y, Shi A, Liu X, Li D, He K. Xu J, et al. Nat Cell Biol. 2024 Oct;26(10):1652-1668. doi: 10.1038/s41556-024-01499-4. Epub 2024 Sep 19. Nat Cell Biol. 2024. PMID: 39300312 - Release Mode Dynamically Regulates the RRP Refilling Mechanism at Individual Hippocampal Synapses.
Kim Y, Lee U, Choi C, Chang S. Kim Y, et al. J Neurosci. 2020 Oct 28;40(44):8426-8437. doi: 10.1523/JNEUROSCI.3029-19.2020. Epub 2020 Sep 28. J Neurosci. 2020. PMID: 32989096 Free PMC article. - A dynamic formin-dependent deep F-actin network in axons.
Ganguly A, Tang Y, Wang L, Ladt K, Loi J, Dargent B, Leterrier C, Roy S. Ganguly A, et al. J Cell Biol. 2015 Aug 3;210(3):401-17. doi: 10.1083/jcb.201506110. Epub 2015 Jul 27. J Cell Biol. 2015. PMID: 26216902 Free PMC article. - Temperature-dependent structural plasticity of hippocampal synapses.
Feng Z, Saha L, Dritsa C, Wan Q, Glebov OO. Feng Z, et al. Front Cell Neurosci. 2022 Oct 19;16:1009970. doi: 10.3389/fncel.2022.1009970. eCollection 2022. Front Cell Neurosci. 2022. PMID: 36339823 Free PMC article.
References
- Takei K, et al. Generation of coated intermediates of clathrin-mediated endocytosis on protein-free liposomes. Cell. 1998;94:131–141. - PubMed
- Li C, et al. Ca(2+)-dependent and -independent activities of neural and non-neural synaptotagmins. Nature. 1995;375:594–599. - PubMed
Additional references
- Von Kleist L, et al. Role of the clathrin terminal domain in regulating coated pit dynamics revealed by small molecule inhibition. Cell. 2011;146:471–484. - PubMed
- Lois C, Hong EJ, Pease S, Brown EJ, Baltimore D. Germline transmission and tissue-specific expression of transgenes delivered by lentiviral vectors. Science. 2002;295:868–872. - PubMed
Publication types
MeSH terms
Substances
Grants and funding
- NS034307/NS/NINDS NIH HHS/United States
- R37 NS034307/NS/NINDS NIH HHS/United States
- R01 NS034307/NS/NINDS NIH HHS/United States
- 249939/ERC_/European Research Council/International
- HHMI/Howard Hughes Medical Institute/United States
LinkOut - more resources
Full Text Sources
Other Literature Sources

