Control of cell identity genes occurs in insulated neighborhoods in mammalian chromosomes - PubMed (original) (raw)
Control of cell identity genes occurs in insulated neighborhoods in mammalian chromosomes
Jill M Dowen et al. Cell. 2014.
Abstract
The pluripotent state of embryonic stem cells (ESCs) is produced by active transcription of genes that control cell identity and repression of genes encoding lineage-specifying developmental regulators. Here, we use ESC cohesin ChIA-PET data to identify the local chromosomal structures at both active and repressed genes across the genome. The results produce a map of enhancer-promoter interactions and reveal that super-enhancer-driven genes generally occur within chromosome structures that are formed by the looping of two interacting CTCF sites co-occupied by cohesin. These looped structures form insulated neighborhoods whose integrity is important for proper expression of local genes. We also find that repressed genes encoding lineage-specifying developmental regulators occur within insulated neighborhoods. These results provide insights into the relationship between transcriptional control of cell identity genes and control of local chromosome structure.
Copyright © 2014 Elsevier Inc. All rights reserved.
Figures
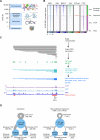
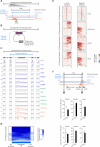
Figure 1. DNA interactions involving cohesin
A) Units of chromosome organization. Chromosomes consist of multiple Topologically Associating Domains (TADs). TADs (image adapted from (Dixon et al., 2012)) contain multiple genes with DNA loops involving interactions between enhancers, promoters and other regulatory elements, which are mediated by cohesin (blue ring) and CTCF (purple balls). Nucleosomes represent the smallest unit of chromosome organization. B) Heatmap representation of ESC ChIP-seq data for SMC1, a merged dataset for the transcription factors OCT4, SOX2 and NANOG (OSN), MED12, RNA polymerase II (Pol2), H3K27me3, and CTCF at SMC1-occupied regions. Read density is displayed within a 10kb window and color scale intensities are shown in rpm/bp. Cohesin occupies three classes of sites: enhancer-promoter sites, Polycomb-occupied sites, and CTCF-occupied sites. C) ESC cohesin (SMC1) ChIA-PET data analysis at the Mycn locus. The algorithm used to identify paired-end tags (PETs) is described in detail in Extended Experimental Procedures. PETs and interactions involving enhancers and promoters within the window are displayed at each step in the analysis pipeline: unique PETs, PET peaks, interactions between PET peaks, and high-confidence interactions supported by at least 3 independent PETs and with a FDR of 0.01. D) Summary of the major classes of interactions and high-confidence interactions identified in the cohesin ChIA-PET data. Enhancers, promoters, and CTCF sites where interactions occur are displayed as blue circles, and the size of the circle is proportional to the number regions. The interactions between two sites are displayed as grey lines, and the thickness of the grey line is proportional to the number of interactions. The diagram on the left was generated using the interactions, and the diagram on the right was generated using the high confidence interactions. See also Figure S1, S2, Table S1, S2.
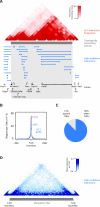
Figure 2. DNA interactions frequently occur within Topologically Associating Domains
A) An example Topologically Associating Domain (TAD) shown with normalized Hi-C interaction frequencies displayed as a two-dimensional heat map (Dixon et al., 2012) and the TAD is indicated as a grey bar. High-confidence SMC1 ChIAPET interactions are depicted as blue lines. B) Enrichment of CTCF, cohesin (SMC1), and PET peaks at TAD boundary regions. The metagene representation shows the number of regions per 10 kb window centered on the TAD boundary and +/− 500kb is displayed. C) Pie chart of high-confidence interactions that either fall within TADs (88%) or cross TAD boundaries (12%). D) High-confidence interactions are displayed as a two-dimensional heat map across a normalized TAD length for the ~2,200 TADs (Dixon et al., 2012). The display is centered on the normalized TAD and extends beyond each boundary to 10% of the size of the domain. See also Table S3A.
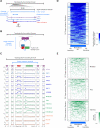
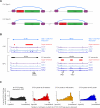
Figure 3. Super-enhancer Domain Structure
A) An example super-enhancer domain (SD) within a TAD. High-confidence SMC1 ChIA-PET interactions are depicted as blue lines. ChIP-Seq binding profiles (reads per million per base pair) for CTCF, cohesin (SMC1), and the master transcription factors OCT4, SOX2, and NANOG (OSN) are shown at the Lefty1 locus in ESCs. The super-enhancer is indicated by a red bar. B) Model of SD structure. The 197 SDs have interactions (blue) between cohesin-occupied CTCF sites that may serve as outer boundaries of the domain structure. SDs also contain interactions between super-enhancers and the promoters of their associated genes. C) Metagene analysis showing the occupancy of various factors at the key elements of TADs and SDs, including CTCF sites, super-enhancers and super-enhancer associated genes. ChIP-seq profiles are shown in reads per million per base pair. Boundary site metagenes are centered on the CTCF peak, and +/−2kb is displayed. Super-enhancer metadata is centered on the 195 super-enhancers in SDs and +/−3 kb is displayed. The data for associated genes are centered on the 219 super-enhancer -associated genes in SDs and +/−3kb is displayed. D) Heat map showing that cohesin ChIA-PET high-confidence interactions occur predominantly within the SDs. The density of high-confidence interactions is shown across a normalized SD length for the 197 SDs. E) Heat map showing that transcriptional proteins are contained within boundary sites of SDs. The occupancy of Mediator (MED12), H3K27ac and RNA polymerase II (Pol2) at super-enhancers and associated genes is shown across a normalized SD length for the 197 SDs. See also Figure S3, Table S4.
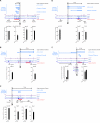
Figure 4. Super-enhancer Domains are functionally linked to gene expression
CRISPR-mediated genome editing of CTCF sites at five loci. The top of each panel shows high-confidence interactions depicted as blue lines, and ChIP-Seq binding profiles (reads per million per base pair) for CTCF, cohesin (SMC1), and OCT4, SOX2, and NANOG (OSN) in ESCs at the respective loci. The super-enhancer is indicated as a red bar. The bottom of each panel shows gene expression level of the indicated genes in wild type and CTCF site-deleted cells measured by qRT-PCR. Transcript levels were normalized to GAPDH. Gene expression was assayed in triplicate in at least two biological replicate samples, and is displayed as mean+SD. All P-values were determined using the Student's t-test. A) CRISPR-mediated genome editing of a CTCF site at the miR-290-295 locus. (P-value < 0.001, Pri-miR-290-295 and Nlrp12 in wild-type vs. CTCF site-deleted). B) CRISPR-mediated genome editing of a CTCF site at the Nanog locus. (P-value < 0.05, Nanog in wild-type vs. CTCF site-deleted). C) CRISPR-mediated genome editing of a CTCF site at the Tdgf1 locus. (P-value < 0.001, Gm590; P-value < 0.01, Lrrc2) in wild-type vs. CTCF site-deleted). D) CRISPR-mediated genome editing of a CTCF site at the Pou5f1 locus. (P-value < 0.012, H2Q-10 in wild-type vs. CTCF site-deleted). E) CRISPR-mediated genome editing of CTCF sites at the Prdm14 locus. (P-value < 0.001, Slco5a1 in wild-type vs. CTCF site-deleted). The CTCF-deletion lines at the Pou5f1 and Prdm14 (C1-2) loci are heterozygous, while the CTCF-deletion lines at the Nanog, Tdgf1 and miR-290-295 loci are homozygous for the mutation. See also Figure S4.
Figure 5. Polycomb Domain Structure
A) An example Polycomb Domain (PD) within a TAD. A high-confidence interaction is depicted as the blue line. ChIP-Seq binding profiles (reads per million per base pair) for CTCF, cohesin (SMC1), and H3K27me3 at the Gata2 locus in ESCs. B) Model of PD structure. The 349 PDs have interactions (blue) between CTCF sites that serve as putative boundaries of the domain structure. C) Metagene analysis reveals the occupancy of various factors at the key elements of TADs and PDs: CTCF sites and target genes. ChIP-seq profiles are shown in reads per million per base pair. Boundary site metagenes are centered on the CTCF peak and +/−2 kb is displayed. The metagenes depicting genes are centered on the 380 Polycomb target genes in PDs and +/−3 kb is displayed. D) Heat map showing that high-confidence interactions are largely constrained within PDs. The density of high-confidence interactions is shown across a normalized PD length for the 349 PDs. E) Heat map showing that Polycomb proteins are contained within boundary sites of PDs. The occupancy of CTCF, H3K27me3, SUZ12 and EZH2 is indicated within a 10 kb window centered on the left and right CTCF-occupied boundary regions is shown for the 120 PDs with this transition pattern. F) CRISPR-mediated genome editing of a CTCF site at the Tcfa2e locus. Top, high-confidence interactions are depicted by blue lines and ChIP-Seq binding profiles (reads per million per base pair) for CTCF, cohesin (SMC1), and H3K27me3 are shown in ESCs. Bottom, Expression level of the indicated genes in wild type and CTCF site-deleted cells measured by qRT-PCR. Transcript levels were normalized to GAPDH. Gene expression was assayed in triplicate in at least two biological replicate samples and is displayed as mean+SD (P-value < 0.05, Tcfap2e in C1 deletion cells; P-value < 0.001, Tcfap2e in C2 deletion cells_)_ in wild-type vs. CTCF site-deleted). P-values were determined using the Student's t-test. See also Figure S5, Table S5.
Figure 6. Insulated Neighborhoods are preserved in multiple cell types
A) Model depicting constitutive domain organization, mediated by interaction of two CTCF sites co-occupied by cohesin, in two cell types. B) An example SD in ESCs and a domain in NPCs. High-confidence interactions from the SMC1 ChIA-PET dataset are depicted by blue lines and 5C interactions from (Phillips-Cremins et al., 2013) are depicted by black lines. Super-enhancers are indicated by red bars. ChIP-Seq binding profiles (reads per million per base pair) for CTCF, cohesin (SMC1), and OCT4, SOX2, and NANOG (OSN), SOX2 and BRN2 are shown at the Nanog locus and the Olig1/Olig2 locus in ESCs and NPCs. C) Occupancy of CTCF peaks across 18 cell types. The CTCF peaks used for the analysis are the CTCF peaks found in ESCs. The percentage of these peaks that are observed in the indicated number of cell types is shown for four groups of CTCF sites: all CTCF peaks identified in ESCs, CTCF peaks at SD boundaries in ESCs, CTCF peaks at PD boundaries in ESCs, and CTCF peaks at PET peaks (identified by SMC1 ChIA-PET in ESCs). See also Figure S6, Table S3B.
Comment in
- Genome organization: 3D genome architecture--of loops and globules.
Koch L. Koch L. Nat Rev Genet. 2014 Dec;15(12):780. doi: 10.1038/nrg3858. Epub 2014 Oct 29. Nat Rev Genet. 2014. PMID: 25352303 No abstract available.
Similar articles
- Genome-wide and parental allele-specific analysis of CTCF and cohesin DNA binding in mouse brain reveals a tissue-specific binding pattern and an association with imprinted differentially methylated regions.
Prickett AR, Barkas N, McCole RB, Hughes S, Amante SM, Schulz R, Oakey RJ. Prickett AR, et al. Genome Res. 2013 Oct;23(10):1624-35. doi: 10.1101/gr.150136.112. Epub 2013 Jun 26. Genome Res. 2013. PMID: 23804403 Free PMC article. - 3D Chromosome Regulatory Landscape of Human Pluripotent Cells.
Ji X, Dadon DB, Powell BE, Fan ZP, Borges-Rivera D, Shachar S, Weintraub AS, Hnisz D, Pegoraro G, Lee TI, Misteli T, Jaenisch R, Young RA. Ji X, et al. Cell Stem Cell. 2016 Feb 4;18(2):262-75. doi: 10.1016/j.stem.2015.11.007. Epub 2015 Dec 10. Cell Stem Cell. 2016. PMID: 26686465 Free PMC article. - A cohesin-OCT4 complex mediates Sox enhancers to prime an early embryonic lineage.
Abboud N, Morris TM, Hiriart E, Yang H, Bezerra H, Gualazzi MG, Stefanovic S, Guénantin AC, Evans SM, Pucéat M. Abboud N, et al. Nat Commun. 2015 Apr 8;6:6749. doi: 10.1038/ncomms7749. Nat Commun. 2015. PMID: 25851587 Free PMC article. - Insulated Neighborhoods: Structural and Functional Units of Mammalian Gene Control.
Hnisz D, Day DS, Young RA. Hnisz D, et al. Cell. 2016 Nov 17;167(5):1188-1200. doi: 10.1016/j.cell.2016.10.024. Cell. 2016. PMID: 27863240 Free PMC article. Review. - Genome-wide studies of CCCTC-binding factor (CTCF) and cohesin provide insight into chromatin structure and regulation.
Lee BK, Iyer VR. Lee BK, et al. J Biol Chem. 2012 Sep 7;287(37):30906-13. doi: 10.1074/jbc.R111.324962. Epub 2012 Sep 5. J Biol Chem. 2012. PMID: 22952237 Free PMC article. Review.
Cited by
- Determinants and role of chromatin organization in acute leukemia.
Fang C, Rao S, Crispino JD, Ntziachristos P. Fang C, et al. Leukemia. 2020 Oct;34(10):2561-2575. doi: 10.1038/s41375-020-0981-z. Epub 2020 Jul 20. Leukemia. 2020. PMID: 32690881 Free PMC article. Review. - Super-Enhancers and CTCF in Early Embryonic Cell Fate Decisions.
Agrawal P, Rao S. Agrawal P, et al. Front Cell Dev Biol. 2021 Mar 25;9:653669. doi: 10.3389/fcell.2021.653669. eCollection 2021. Front Cell Dev Biol. 2021. PMID: 33842482 Free PMC article. Review. - Long-Range Chromosome Interactions Mediated by Cohesin Shape Circadian Gene Expression.
Xu Y, Guo W, Li P, Zhang Y, Zhao M, Fan Z, Zhao Z, Yan J. Xu Y, et al. PLoS Genet. 2016 May 2;12(5):e1005992. doi: 10.1371/journal.pgen.1005992. eCollection 2016 May. PLoS Genet. 2016. PMID: 27135601 Free PMC article. - Multiple parameters shape the 3D chromatin structure of single nuclei at the doc locus in Drosophila.
Götz M, Messina O, Espinola S, Fiche JB, Nollmann M. Götz M, et al. Nat Commun. 2022 Sep 14;13(1):5375. doi: 10.1038/s41467-022-32973-y. Nat Commun. 2022. PMID: 36104317 Free PMC article. - Inducible transcriptional condensates drive 3D genome reorganization in the heat shock response.
Chowdhary S, Kainth AS, Paracha S, Gross DS, Pincus D. Chowdhary S, et al. Mol Cell. 2022 Nov 17;82(22):4386-4399.e7. doi: 10.1016/j.molcel.2022.10.013. Epub 2022 Nov 2. Mol Cell. 2022. PMID: 36327976 Free PMC article.
References
- Bell AC, West AG, Felsenfeld G. The protein CTCF is required for the enhancer blocking activity of vertebrate insulators. Cell. 1999;98:387–396. - PubMed
- Boyer LA, Plath K, Zeitlinger J, Brambrink T, Medeiros LA, Lee TI, Levine SS, Wernig M, Tajonar A, Ray MK, et al. Polycomb complexes repress developmental regulators in murine embryonic stem cells. Nature. 2006;441:349–353. - PubMed
Publication types
MeSH terms
Substances
Grants and funding
- J 3490/FWF_/Austrian Science Fund FWF/Austria
- F32 CA168263/CA/NCI NIH HHS/United States
- ImNIH/Intramural NIH HHS/United States
- R01 HG002668/HG/NHGRI NIH HHS/United States
- HG002668/HG/NHGRI NIH HHS/United States
- T32 GM007287/GM/NIGMS NIH HHS/United States
- CA168263-01A1/CA/NCI NIH HHS/United States
LinkOut - more resources
Full Text Sources
Other Literature Sources
Research Materials
