Genome-Scale CRISPR-Mediated Control of Gene Repression and Activation - PubMed (original) (raw)
. 2014 Oct 23;159(3):647-61.
doi: 10.1016/j.cell.2014.09.029. Epub 2014 Oct 9.
Max A Horlbeck 1, Britt Adamson 1, Jacqueline E Villalta 1, Yuwen Chen 1, Evan H Whitehead 2, Carla Guimaraes 3, Barbara Panning 4, Hidde L Ploegh 3, Michael C Bassik 1, Lei S Qi 2, Martin Kampmann 5, Jonathan S Weissman 6
Affiliations
- PMID: 25307932
- PMCID: PMC4253859
- DOI: 10.1016/j.cell.2014.09.029
Genome-Scale CRISPR-Mediated Control of Gene Repression and Activation
Luke A Gilbert et al. Cell. 2014.
Abstract
While the catalog of mammalian transcripts and their expression levels in different cell types and disease states is rapidly expanding, our understanding of transcript function lags behind. We present a robust technology enabling systematic investigation of the cellular consequences of repressing or inducing individual transcripts. We identify rules for specific targeting of transcriptional repressors (CRISPRi), typically achieving 90%-99% knockdown with minimal off-target effects, and activators (CRISPRa) to endogenous genes via endonuclease-deficient Cas9. Together they enable modulation of gene expression over a ∼1,000-fold range. Using these rules, we construct genome-scale CRISPRi and CRISPRa libraries, each of which we validate with two pooled screens. Growth-based screens identify essential genes, tumor suppressors, and regulators of differentiation. Screens for sensitivity to a cholera-diphtheria toxin provide broad insights into the mechanisms of pathogen entry, retrotranslocation and toxicity. Our results establish CRISPRi and CRISPRa as powerful tools that provide rich and complementary information for mapping complex pathways.
Copyright © 2014 Elsevier Inc. All rights reserved.
Figures
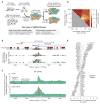
Figure 1. A Tiling sgRNA Screen Defines Rules for CRISPRi Activity at Endogenous Genes in Human Cells
(A) Massively parallel determination of growth or toxin resistance phenotypes caused by sgRNAs in mammalian cells expressing dCas9 or dCas9 fusion constructs. (B) UCSC tracks showing the genomic organization, GC content, and repetitive elements around the TSS of a representative gene, VPS54, across a 10kb window targeted by the tiling sgRNA library. sgRNA ricin resistance phenotypes (as z-scores, see Figure S1 and Experimental Procedures) in dCas9 and dCas9-KRAB expressing K562 cells are depicted in black on the top and bottom, respectively. See also Figure S2A for more examples. (C) Sliding-window analysis of all 49 genes targeted in a tiling sgRNA library. Green line: median sgRNA activity in a defined window for all genes. Orange region: observed average window of maximum CRISPRi activity. Data displayed as a phenotype signed z-score, excluding all guides longer than 22bp. (D) CRISPRi activity for all 49 genes in defined windows relative to the TSS of each gene. (E) Ricin resistance phenotypes, comparing CRISPRi sgRNAs selected by our rules to RNAi, for genes previously established to cause ricin resistance phenotypes when knocked down by RNAi. Mean phenotype-signed z-score for 10 subsampled sgRNAs or shRNAs. See also Figure S2F.
Figure 2. CRISPRi Activity is Highly Sensitive to Mismatches Between the sgRNA and DNA sequence
On- and off-target activity of dCas9, dCas9-KRAB and Cas9 for sgRNAs with a varying number and position of mismatches. Off-target activity of sgRNAs with mismatches is displayed as percent of the on-target activity for the corresponding sgRNA without mismatches. Asterisk indicates sgRNAs with 3, 4, or 5 mismatches randomly distributed across region 3 of the sgRNA sequence. Data is displayed for each mismatch position as the mean of all sgRNAs with that mismatch; see Figure S3 for individual sgRNA activities. sgRNAs were included in the analysis only if the fully matched guide was highly active (phenotype-signed z-score ≥ 4); N=5 for dCas9, N=11 for dCas9-KRAB, and N=10 for Cas9.
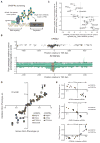
Figure 3. A Tiling sgRNA Screen Defines Rules for CRISPRa Activity at Endogenous Genes in Human Cells
(A) A schematic of the dCas9-SunTag + scFV−VP64 + sgRNA system for CRISPRa. (B) Activity of sgRNAs in K562 cells stably expressing each component of CRISPRa, as a function of the distance of the sgRNA site to the TSS of the targeted gene (Phenotype-signed z-scores; therefore, negative values represent opposite results than from knockdown). Top, sgRNAs targeting VPS54; Bottom, sliding-window analysis of all 49 genes targeted by our tiling library in green. Green line, median activity; orange, window of maximal activity. Guides longer than 22bp were excluded. See also Figure S4. (C) CRISPRa phenotypes and CRISPRi (dCas9-KRAB) phenotypes are anti-correlated for select genes. For each gene, a p-value is calculated using CRISPRi/a sgRNA activity relative to a negative control distribution for 24 sub-sampled sgRNAs. (D) CRISPRi knockdown and CRISPRa activation of the same gene can have opposing effects on ricin resistance in both primary screens and single sgRNA validation experiments (mean ± standard deviation of 3 replicates). (E) Modulation of expression levels for 3 genes by CRISPRi and CRISPRa as quantified by qPCR plotted against the ricin resistance phenotype (mean ± standard deviation of 3 replicates) measured for each sgRNA.
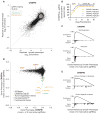
Figure 4. Genome-Scale CRISPRi and CRISPRa Screens Reveal Genes Controlling Cell Growth
(A) sgRNA phenotypes from a genome-scale CRISPRi screen for growth in human K562 cells (black). Three classes of negative control sgRNAs are color-coded: non-targeting sgRNAs (grey), sgRNAs targeting Y-chromosomal genes (green) and sgRNAs targeting olfactory genes (orange). (B) Co-expression of sgRNAs and dCas9-KRAB or dCas9-SunTag + scFV−VP64 is not toxic in K562 cell lines over 16 days. (C) Gene set enrichment analysis (GSEA) for hits from the CRISPRi screen. A histogram of gene distribution is shown under the GSEA curve. (D) CRISPRi versus CRISPRa gene phenotypes for genome-scale growth screens (black). For the 50 genes in the CRISPRa screen with the most negative growth phenotype, each gene was annotated and labeled based on evidence of activity as a tumor suppressor (orange), developmental transcription factor (green), or in regulation of the centrosome (purple). Two additional CRISPRi hit genes that are discussed in the text are labeled in red. See Table S4 for annotations and references. (E) GSEA for hits from the CRISPRa growth screen. A histogram of gene distribution is shown under the GSEA curve.
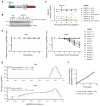
Figure 5. CRISPRi Gene Silencing is Inducible, Reversible, and Non-Toxic
(A) Expression construct encoding an inducible KRAB-dCas9 fusion protein. (B) Western blot analysis of inducible KRAB-dCas9 in the absence, presence, and after washout of doxycycline. (C) Relative RAB1A expression levels (as quantified by qPCR) in inducible CRISPRi K562 cells transduced with _RAB1A_-targeting sgRNAs in the absence, presence, and after washout of doxycycline. Mean ± standard error of technical replicates (N=2) normalized to control cells (assayed in the presence of doxycycline) from the day 2 time point. (D) Competitive growth assays performed with inducible CRISPRi K562 cells transduced with the indicated sgRNAs in the presence and absence of doxycycline. Data is represented as the mean ± standard deviation of replicates (N=3). See also Figure S5G. (E) A CRISPRi sublibrary screen for effects on cell growth was performed with inducible CRISPRi K562 cells in the presence and absence of doxycycline. (F) Cumulative growth curves from the sublibrary screen represented in (E) show no bulk changes to growth caused by induction of KRAB-dCas9. Mean ± standard deviation of replicate infections each screened in duplicate.
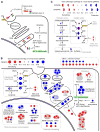
Figure 6. Genome-Scale CRISPRi and CRISPRa Screens Reveal Known and New Pathways and Complexes Governing the Response to a Cholera-Diphtheria Fusion Toxin (CTx-DTA)
(A) Model for CTx-DTA binding, retrograde trafficking, retro-translocation and cellular toxicity. (B) Overview of top hit genes detected by the CTx-DTA screen. Dark red and blue circles: Top 50 sensitizing and protective hits, respectively. Light red and blue circles: further hits that fall into the same protein complexes or pathways as top 50 hits. Circle area is proportional to phenotype strength. White stars denote genes identified in a previous haploid mutagenesis screen (Guimaraes et al., 2011). See also Figure S6 for hit gene names. (C) CRISPRi and CRISPRa hits in sphingolipid metabolism. Display as in (B), except that the left and right sides of each circle represent the phenotypes in the CRISPRi and CRISPRa screens, respectively.
Figure 7. CRISPRi Strongly Represses Gene Expression of Both Protein-Coding and Non-Coding Genes, Resulting in Reproducible Phenotypes
(A–C) Cells expressing a negative control sgRNA or an sgRNA targeting SEL1L or B4GALNT1 were incubated with cholera toxin and fractionated to quantify cholera toxin present in the cytosolic and membrane fractions by Western blot. B4GALNT1 repression blocks toxin uptake whereas SEL1L repression prevents toxin retro-translocation from the membrane fraction to the cytosol. (D) Validation of CTx-DTA screen phenotypes with single sgRNA re-test experiments. Data is represented as the mean ± standard deviation of replicates (N=3). (E) CRISPRi knockdown of 13 hit genes (28 sgRNAs; same sgRNAs as 7D) identified in the CTx-DTA screen was quantified by qPCR. The gray shaded region denotes sgRNAs showing at least 90% knockdown for each gene. (F) CRISPRi knockdown of 6 lncRNA genes was quantified by qPCR. 2–3 sgRNAs computationally predicted to target each gene were cloned and transduced into K562 cells expressing dCas9-KRAB. (G) K562 cells expressing dCas9-KRAB were transduced with either a non-targeting sgRNA or an sgRNA targeting the XIST locus (sgXIST-1). The cells were then stained with DAPI and an RNA FISH probe for the XIST transcript. 200 non-apoptotic interphase cells in each condition were scored for XIST RNA coating. XIST is undetectable in cells transduced with sgXIST-1. Scale bar represents 5μm.
Comment in
- Genetic screens: CRISPR screening from both ways.
Lau E. Lau E. Nat Rev Genet. 2014 Dec;15(12):778-9. doi: 10.1038/nrg3850. Epub 2014 Oct 21. Nat Rev Genet. 2014. PMID: 25331481 No abstract available. - Toward Whole-Transcriptome Editing with CRISPR-Cas9.
Heckl D, Charpentier E. Heckl D, et al. Mol Cell. 2015 May 21;58(4):560-2. doi: 10.1016/j.molcel.2015.05.016. Mol Cell. 2015. PMID: 26000839
Similar articles
- Targeted Modulation of Chicken Genes In Vitro Using CRISPRa and CRISPRi Toolkit.
Chapman B, Han JH, Lee HJ, Ruud I, Kim TH. Chapman B, et al. Genes (Basel). 2023 Apr 13;14(4):906. doi: 10.3390/genes14040906. Genes (Basel). 2023. PMID: 37107664 Free PMC article. - Optimized libraries for CRISPR-Cas9 genetic screens with multiple modalities.
Sanson KR, Hanna RE, Hegde M, Donovan KF, Strand C, Sullender ME, Vaimberg EW, Goodale A, Root DE, Piccioni F, Doench JG. Sanson KR, et al. Nat Commun. 2018 Dec 21;9(1):5416. doi: 10.1038/s41467-018-07901-8. Nat Commun. 2018. PMID: 30575746 Free PMC article. - CRISPR-Cas-mediated transcriptional modulation: The therapeutic promises of CRISPRa and CRISPRi.
Bendixen L, Jensen TI, Bak RO. Bendixen L, et al. Mol Ther. 2023 Jul 5;31(7):1920-1937. doi: 10.1016/j.ymthe.2023.03.024. Epub 2023 Mar 24. Mol Ther. 2023. PMID: 36964659 Free PMC article. Review. - CRISPRi and CRISPRa Screens in Mammalian Cells for Precision Biology and Medicine.
Kampmann M. Kampmann M. ACS Chem Biol. 2018 Feb 16;13(2):406-416. doi: 10.1021/acschembio.7b00657. Epub 2017 Oct 24. ACS Chem Biol. 2018. PMID: 29035510 Free PMC article. Review. - Complementary information derived from CRISPR Cas9 mediated gene deletion and suppression.
Rosenbluh J, Xu H, Harrington W, Gill S, Wang X, Vazquez F, Root DE, Tsherniak A, Hahn WC. Rosenbluh J, et al. Nat Commun. 2017 May 23;8:15403. doi: 10.1038/ncomms15403. Nat Commun. 2017. PMID: 28534478 Free PMC article.
Cited by
- A non-canonical role for a small nucleolar RNA in ribosome biogenesis and senescence.
Cheng Y, Wang S, Zhang H, Lee JS, Ni C, Guo J, Chen E, Wang S, Acharya A, Chang TC, Buszczak M, Zhu H, Mendell JT. Cheng Y, et al. Cell. 2024 Aug 22;187(17):4770-4789.e23. doi: 10.1016/j.cell.2024.06.019. Epub 2024 Jul 8. Cell. 2024. PMID: 38981482 - Genome-wide CRISPRi screening identifies OCIAD1 as a prohibitin client and regulatory determinant of mitochondrial Complex III assembly in human cells.
Le Vasseur M, Friedman J, Jost M, Xu J, Yamada J, Kampmann M, Horlbeck MA, Salemi MR, Phinney BS, Weissman JS, Nunnari J. Le Vasseur M, et al. Elife. 2021 May 26;10:e67624. doi: 10.7554/eLife.67624. Elife. 2021. PMID: 34034859 Free PMC article. - Pharmaceutical-Grade Rigosertib Is a Microtubule-Destabilizing Agent.
Jost M, Chen Y, Gilbert LA, Horlbeck MA, Krenning L, Menchon G, Rai A, Cho MY, Stern JJ, Prota AE, Kampmann M, Akhmanova A, Steinmetz MO, Tanenbaum ME, Weissman JS. Jost M, et al. Mol Cell. 2020 Jul 2;79(1):191-198.e3. doi: 10.1016/j.molcel.2020.06.008. Mol Cell. 2020. PMID: 32619469 Free PMC article. - Gaucher disease provides a unique window into Parkinson disease pathogenesis.
Hertz E, Chen Y, Sidransky E. Hertz E, et al. Nat Rev Neurol. 2024 Sep;20(9):526-540. doi: 10.1038/s41582-024-00999-z. Epub 2024 Aug 6. Nat Rev Neurol. 2024. PMID: 39107435 Review. - TSSC1 is novel component of the endosomal retrieval machinery.
Gershlick DC, Schindler C, Chen Y, Bonifacino JS. Gershlick DC, et al. Mol Biol Cell. 2016 Sep 15;27(18):2867-78. doi: 10.1091/mbc.E16-04-0209. Epub 2016 Jul 20. Mol Biol Cell. 2016. PMID: 27440922 Free PMC article.
References
Publication types
MeSH terms
Substances
Grants and funding
- DP2 HD084069/HD/NICHD NIH HHS/United States
- R01 GM100341/GM/NIGMS NIH HHS/United States
- T32 GM008284/GM/NIGMS NIH HHS/United States
- P01 AG010770/AG/NIA NIH HHS/United States
- P50 GM081879/GM/NIGMS NIH HHS/United States
- T32 EB009383/EB/NIBIB NIH HHS/United States
- DP5 OD017887/OD/NIH HHS/United States
- U01CA168370/CA/NCI NIH HHS/United States
- K99CA181494/CA/NCI NIH HHS/United States
- R01 GM100518/GM/NIGMS NIH HHS/United States
- U01 CA168370/CA/NCI NIH HHS/United States
- K99 CA181494/CA/NCI NIH HHS/United States
- P50 GM102706/GM/NIGMS NIH HHS/United States
- R01 DA036858/DA/NIDA NIH HHS/United States
- P50GM102706/GM/NIGMS NIH HHS/United States
- HHMI_/Howard Hughes Medical Institute/United States
LinkOut - more resources
Full Text Sources
Other Literature Sources
Molecular Biology Databases
Research Materials
