The window period of NEUROGENIN3 during human gestation - PubMed (original) (raw)
The window period of NEUROGENIN3 during human gestation
Rachel J Salisbury et al. Islets. 2014.
Abstract
The basic helix-loop-helix transcription factor, NEUROG3, is critical in causing endocrine commitment from a progenitor cell population in the developing pancreas. In human, NEUROG3 has been detected from 8 weeks post-conception (wpc). However, the profile of its production and when it ceases to be detected is unknown. In this study we have defined the profile of NEUROG3 detection in the developing pancreas to give insight into when NEUROG3-dependent endocrine commitment is possible in the human fetus. Immunohistochemistry allowed counting of cells with positively stained nuclei from 7 wpc through to term. mRNA was also isolated from sections of human fetal pancreas and NEUROG3 transcription analyzed by quantitative reverse transcription and polymerase chain reaction. NEUROG3 was detected as expected at 8 wpc. The number of NEUROG3-positive cells increased to peak levels between 10 wpc and 14 wpc. It declined at and after 18 wpc such that it was not detected in human fetal pancreas at 35-41 wpc. Analysis of NEUROG3 transcription corroborated this profile by demonstrating very low levels of transcript at 35-41 wpc, more than 10-fold lower than levels at 12-16 wpc. These data define the appearance, peak and subsequent disappearance of the critical transcription factor, NEUROG3, in human fetal pancreas for the first time. By inference, the window for pancreatic endocrine differentiation via NEUROG3 action opens at 8 wpc and closes between 21 and 35 wpc.
Keywords: NEUROG3, Neurogenin-3; Neurogenin-3 (NEUROG3); SOX9, Sex-determining region Y-box 9; development; dpc, dayspost-conception; endocrine; fetal; human; pancreas; sex-determining region Y-box 9 (SOX9); wpc, weeks post-conception.
Figures
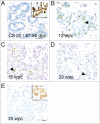
Figure 1.
Profile of immunohistochemistry for NEUROG3 during human development. (A–E) Brightfield images show NEUROG3 in brown counterstained with toluidine blue. Insets (A) and (E) show brown SOX9 staining in nearby sections from the same fetus. Arrowheads exemplify positively stained cells. Scale bar represents 50 μm in all panels.
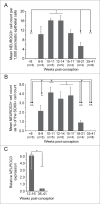
Figure 2.
Quantification of NEUROG3 by cell-counting and mRNA analysis during human fetal development. (A) and (B) The NEUROG3 count was quantified relative to the total pancreatic epithelial cell population (A) and the SOX9-positive cell population (B). By either approach the NEUROG3 count at 10-11 wpc and at 12–14 wpc were statistically greater than at <8 wpc, 18–21 wpc and 35–41 wpc. When quantified relative to the SOX9-positive cell population, 10-11 wpc, 12–14 wpc and 15–17 wpc emerged as the period of peak NEUROG3 detection. In neither (A) nor (B), was there a significant difference between counts at 10–11, 12–14 and 15–17 wpc. *P < 0.05, **P < 0.01, ^P < 0.005, ^^P < 0.0001 by one-way ANOVA with post-hoc Tukey's test. The number of specimens in each group (n) is shown in parentheses. (C). Relative NEUROG3 expression by qRT-PCR demonstrated higher levels in samples from 12–16 wpc than at 35–41 wpc. *P < 0 .01 by 2-tailed unpaired Student's t-test.
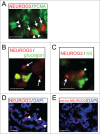
Figure 3.
Immunofluoresence for NEUROG3 in human fetal pancreas. (A–E) Immunofluorescence for NEUROG3 at 14 wpc. (A) Arrowheads point to green PCNA-positive cells while arrows point to separate red NEUROG3-positive cells. (B) and (C) Arrows point to hormone-negative NEUROG3-positive cells. Arrowhead points to a very rare NEUROG3-positive cell with faint somatostatin (SS) staining. (D) and (E) Arrowheads point to NEUROG3-positive nuclei visible in (D) but not (E) following pre-incubation with full-length human NEUROG3 protein. Amplification of the red gain with DAPI counterstaining to investigate the loss of nuclear staining has introduced some background cytoplasmic staining. Scale bar represents 50 μm.
Similar articles
- Neurog3 gene dosage regulates allocation of endocrine and exocrine cell fates in the developing mouse pancreas.
Wang S, Yan J, Anderson DA, Xu Y, Kanal MC, Cao Z, Wright CV, Gu G. Wang S, et al. Dev Biol. 2010 Mar 1;339(1):26-37. doi: 10.1016/j.ydbio.2009.12.009. Epub 2009 Dec 16. Dev Biol. 2010. PMID: 20025861 Free PMC article. - Identification of the bHLH factor Math6 as a novel component of the embryonic pancreas transcriptional network.
Lynn FC, Sanchez L, Gomis R, German MS, Gasa R. Lynn FC, et al. PLoS One. 2008 Jun 18;3(6):e2430. doi: 10.1371/journal.pone.0002430. PLoS One. 2008. PMID: 18560595 Free PMC article. - Revisiting the immunocytochemical detection of Neurogenin 3 expression in mouse and man.
Honoré C, Rescan C, Hald J, McGrath PS, Petersen MB, Hansson M, Klein T, Østergaard S, Wells JM, Madsen OD. Honoré C, et al. Diabetes Obes Metab. 2016 Sep;18 Suppl 1:10-22. doi: 10.1111/dom.12718. Diabetes Obes Metab. 2016. PMID: 27615127 Review. - Ectopic expression of neurogenin 3 in neonatal pig pancreatic precursor cells induces (trans)differentiation to functional alpha cells.
Harb G, Heremans Y, Heimberg H, Korbutt GS. Harb G, et al. Diabetologia. 2006 Aug;49(8):1855-63. doi: 10.1007/s00125-006-0299-z. Epub 2006 May 31. Diabetologia. 2006. PMID: 16736130 - PDX1, Neurogenin-3, and MAFA: critical transcription regulators for beta cell development and regeneration.
Zhu Y, Liu Q, Zhou Z, Ikeda Y. Zhu Y, et al. Stem Cell Res Ther. 2017 Nov 2;8(1):240. doi: 10.1186/s13287-017-0694-z. Stem Cell Res Ther. 2017. PMID: 29096722 Free PMC article. Review.
Cited by
- Endocrine Pancreas Development and Dysfunction Through the Lens of Single-Cell RNA-Sequencing.
Szlachcic WJ, Ziojla N, Kizewska DK, Kempa M, Borowiak M. Szlachcic WJ, et al. Front Cell Dev Biol. 2021 Apr 29;9:629212. doi: 10.3389/fcell.2021.629212. eCollection 2021. Front Cell Dev Biol. 2021. PMID: 33996792 Free PMC article. Review. - Engineering islets from stem cells for advanced therapies of diabetes.
Siehler J, Blöchinger AK, Meier M, Lickert H. Siehler J, et al. Nat Rev Drug Discov. 2021 Dec;20(12):920-940. doi: 10.1038/s41573-021-00262-w. Epub 2021 Aug 10. Nat Rev Drug Discov. 2021. PMID: 34376833 Review. - Sequential progenitor states mark the generation of pancreatic endocrine lineages in mice and humans.
Yu XX, Qiu WL, Yang L, Wang YC, He MY, Wang D, Zhang Y, Li LC, Zhang J, Wang Y, Xu CR. Yu XX, et al. Cell Res. 2021 Aug;31(8):886-903. doi: 10.1038/s41422-021-00486-w. Epub 2021 Mar 10. Cell Res. 2021. PMID: 33692492 Free PMC article. - Stepwise differentiation of functional pancreatic β cells from human pluripotent stem cells.
Jin W, Jiang W. Jin W, et al. Cell Regen. 2022 Aug 1;11(1):24. doi: 10.1186/s13619-022-00125-8. Cell Regen. 2022. PMID: 35909206 Free PMC article. Review. - Human pluripotent stem cell differentiation to functional pancreatic cells for diabetes therapies: Innovations, challenges and future directions.
Jacobson EF, Tzanakakis ES. Jacobson EF, et al. J Biol Eng. 2017 Jul 3;11:21. doi: 10.1186/s13036-017-0066-3. eCollection 2017. J Biol Eng. 2017. PMID: 28680477 Free PMC article. Review.
References
- Kulkarni RN, Mizrachi EB, Ocana AG, Stewart AF. Human beta-cell proliferation and intracellular signaling: driving in the dark without a road map. Diabetes 2012; 61:2205-13; PMID:22751699; http://dx.doi.org/10.2337/db12-0018 - DOI - PMC - PubMed
- Bernal-Mizrachi E, Kulkarni RN, Scott DK, Mauvais-Jarvis F, Stewart AF, Garcia-Ocana A. Human beta-cell proliferation and intracellular signaling part 2: still driving in the dark without a road map. Diabetes 2014; 63:819-31; PMID:24556859; http://dx.doi.org/10.2337/db13-1146 - DOI - PMC - PubMed
- Gittes GK. Developmental biology of the pancreas: a comprehensive review. Dev Biol 2009; 326:4-35; PMID:19013144; http://dx.doi.org/10.1016/j.ydbio.2008.10.024 - DOI - PubMed
- Murtaugh LC. Pancreas and beta-cell development: from the actual to the possible. Development 2007; 134:427-38; PMID:17185316; http://dx.doi.org/10.1242/dev.02770 - DOI - PubMed
- Villasenor A, Chong DC, Cleaver O. Biphasic Ngn3 expression in the developing pancreas. Dev Dyn 2008; 237:3270-9; PMID:18924236; http://dx.doi.org/10.1002/dvdy.21740 - DOI - PMC - PubMed
Publication types
MeSH terms
Substances
Grants and funding
- MR/J003352/1/MRC_/Medical Research Council/United Kingdom
- 088566/WT_/Wellcome Trust/United Kingdom
- WT088566MA/WT_/Wellcome Trust/United Kingdom
- WT097820MF/WT_/Wellcome Trust/United Kingdom
- G1100420/MRC_/Medical Research Council/United Kingdom
LinkOut - more resources
Full Text Sources
Other Literature Sources
Research Materials


