Genome-wide association study of breast cancer in Latinas identifies novel protective variants on 6q25 - PubMed (original) (raw)
Nasim Ahmadiyeh 2, Donglei Hu 1, Scott Huntsman 1, Kenneth B Beckman 3, Jennifer L Caswell 1, Karen Tsung 2, Esther M John 4, Gabriela Torres-Mejia 5, Luis Carvajal-Carmona 6, María Magdalena Echeverry 7, Anna Marie D Tuazon 7, Carolina Ramirez 8; COLUMBUS Consortium; Christopher R Gignoux 9, Celeste Eng 10, Esteban Gonzalez-Burchard 10, Brian Henderson 11, Loic Le Marchand 12, Charles Kooperberg 13, Lifang Hou 14, Ilir Agalliu 15, Peter Kraft 16, Sara Lindström 16, Eliseo J Perez-Stable 1, Christopher A Haiman 11, Elad Ziv 1
Collaborators, Affiliations
- PMID: 25327703
- PMCID: PMC4204111
- DOI: 10.1038/ncomms6260
Genome-wide association study of breast cancer in Latinas identifies novel protective variants on 6q25
Laura Fejerman et al. Nat Commun. 2014.
Abstract
The genetic contributions to breast cancer development among Latinas are not well understood. Here we carry out a genome-wide association study of breast cancer in Latinas and identify a genome-wide significant risk variant, located 5' of the Estrogen Receptor 1 gene (ESR1; 6q25 region). The minor allele for this variant is strongly protective (rs140068132: odds ratio (OR) 0.60, 95% confidence interval (CI) 0.53-0.67, P=9 × 10(-18)), originates from Indigenous Americans and is uncorrelated with previously reported risk variants at 6q25. The association is stronger for oestrogen receptor-negative disease (OR 0.34, 95% CI 0.21-0.54) than oestrogen receptor-positive disease (OR 0.63, 95% CI 0.49-0.80; P heterogeneity=0.01) and is also associated with mammographic breast density, a strong risk factor for breast cancer (P=0.001). rs140068132 is located within several transcription factor-binding sites and electrophoretic mobility shift assays with MCF-7 nuclear protein demonstrate differential binding of the G/A alleles at this locus. These results highlight the importance of conducting research in diverse populations.
Figures
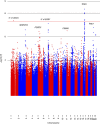
Figure 1. Manhattan plot of GWAS for breast cancer in 1,497 Latina cases and 3,213 controls.
On the x axis are genomic positions by chromosome. On the y axis are the negative log10 P values for the association between the genetic variants and breast cancer risk. LMO4, LIM domain only 4; MARCH4, membrane-associated ring finger (C3HC4) 4, E3 ubiquitin protein ligase; PDZD2, PDZ domain containing 2; ESR1, oestrogen receptor 1; PSMA1, proteasome (prosome, macropain) subunit, alpha type, 1; TOX3, TOX high-mobility group box family member 3; RALY, RALY heterogeneous nuclear ribonucleoprotein.
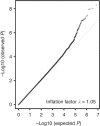
Figure 2. Quantile–quantile plot for GWAS of breast cancer in Latinas.
The gray line represents a perfect match between the expected distribution of –log10 P under the uniform and those observed in the present analysis.
Figure 3. A regional plot of the −log10 P values for SNPs at 6q25.1.
The SNP with the highest −log10 P value is coloured purple and identified by its rs no. on top of the graph. The two SNPs that were replicated in multiple independent samples are circle-shaped, updated −log10 P values after meta-analysis are X-shaped, and previously reported risk SNPs are triangle-shaped. All other SNPs are represented by crosses and the colours reflect the level of correlation with the SNP with highest −log10 P value. The LD is estimated using data from 1,000 Genomes Project Amerindian populations. In addition, shown are the SNP Build 37 coordinates in megabases (Mb), recombination rates in centimorgans (cM) per megabase (Mb) and the name and location of genes in the UCSC Genome Browser (below).
Figure 4. Box plot of percent mammographic breast density by genotypes for SNP rs140068132 at 6q25 in 1,113 women (304 cases and 809 controls) from the Mexican study.
The boxes represent the median (black middle line) limited by the 25th (Q1) and 75th (Q3) percentiles. The whiskers are the upper and lower adjacent values, which are the most extreme values within Q3+1.5(Q3−Q1) and Q1−1.5(Q3−Q1), respectively. The black dots represent outliers. N defines the number of individuals within each genotype category.
Figure 5. Replication of previously reported associations in Latinas.
Scatter plot of odds ratios previously published (x axis) and in Latinas (y axis). Red dots represent SNPs that were associated at ≤0.05 level of significance in Latinas.
Similar articles
- Identification of novel common breast cancer risk variants at the 6q25 locus among Latinas.
Hoffman J, Fejerman L, Hu D, Huntsman S, Li M, John EM, Torres-Mejia G, Kushi L, Ding YC, Weitzel J, Neuhausen SL, Lott P; COLUMBUS Consortium; Echeverry M, Carvajal-Carmona L, Burchard E, Eng C, Long J, Zheng W, Olopade O, Huo D, Haiman C, Ziv E. Hoffman J, et al. Breast Cancer Res. 2019 Jan 14;21(1):3. doi: 10.1186/s13058-018-1085-9. Breast Cancer Res. 2019. PMID: 30642363 Free PMC article. - Admixture mapping identifies a locus on 6q25 associated with breast cancer risk in US Latinas.
Fejerman L, Chen GK, Eng C, Huntsman S, Hu D, Williams A, Pasaniuc B, John EM, Via M, Gignoux C, Ingles S, Monroe KR, Kolonel LN, Torres-Mejía G, Pérez-Stable EJ, Burchard EG, Henderson BE, Haiman CA, Ziv E. Fejerman L, et al. Hum Mol Genet. 2012 Apr 15;21(8):1907-17. doi: 10.1093/hmg/ddr617. Epub 2012 Jan 6. Hum Mol Genet. 2012. PMID: 22228098 Free PMC article. - Evaluation of functional genetic variants at 6q25.1 and risk of breast cancer in a Chinese population.
Wang Y, He Y, Qin Z, Jiang Y, Jin G, Ma H, Dai J, Chen J, Hu Z, Guan X, Shen H. Wang Y, et al. Breast Cancer Res. 2014 Aug 14;16(4):422. doi: 10.1186/s13058-014-0422-x. Breast Cancer Res. 2014. PMID: 25116933 Free PMC article. - Novel breast cancer susceptibility locus at 9q31.2: results of a genome-wide association study.
Fletcher O, Johnson N, Orr N, Hosking FJ, Gibson LJ, Walker K, Zelenika D, Gut I, Heath S, Palles C, Coupland B, Broderick P, Schoemaker M, Jones M, Williamson J, Chilcott-Burns S, Tomczyk K, Simpson G, Jacobs KB, Chanock SJ, Hunter DJ, Tomlinson IP, Swerdlow A, Ashworth A, Ross G, dos Santos Silva I, Lathrop M, Houlston RS, Peto J. Fletcher O, et al. J Natl Cancer Inst. 2011 Mar 2;103(5):425-35. doi: 10.1093/jnci/djq563. Epub 2011 Jan 24. J Natl Cancer Inst. 2011. PMID: 21263130 - Association between Ancestry-Specific 6q25 Variants and Breast Cancer Subtypes in Peruvian Women.
Zavala VA, Casavilca-Zambrano S, Navarro-Vásquez J, Castañeda CA, Valencia G, Morante Z, Calderón M, Abugattas JE, Gómez H, Fuentes HA, Liendo-Picoaga R, Cotrina JM, Monge C, Neciosup SP, Huntsman S, Hu D, Sánchez SE, Williams MA, Núñez-Marrero A, Godoy L, Hechmer A, Olshen AB, Dutil J, Ziv E, Zabaleta J, Gelaye B, Vásquez J, Gálvez-Nino M, Enriquez-Vera D, Vidaurre T, Fejerman L. Zavala VA, et al. Cancer Epidemiol Biomarkers Prev. 2022 Aug 2;31(8):1602-1609. doi: 10.1158/1055-9965.EPI-22-0069. Cancer Epidemiol Biomarkers Prev. 2022. PMID: 35654312 Free PMC article.
Cited by
- Cancer Epidemiology in Hispanic Populations: What Have We Learned and Where Do We Need to Make Progress?
Fejerman L, Ramirez AG, Nápoles AM, Gomez SL, Stern MC. Fejerman L, et al. Cancer Epidemiol Biomarkers Prev. 2022 May 4;31(5):932-941. doi: 10.1158/1055-9965.EPI-21-1303. Cancer Epidemiol Biomarkers Prev. 2022. PMID: 35247883 Free PMC article. Review. - Breast Cancer Risk Associated with Genotype Polymorphisms of the Aurora Kinase a Gene (AURKA): a Case-Control Study in a High Altitude Ecuadorian Mestizo Population.
López-Cortés A, Cabrera-Andrade A, Oña-Cisneros F, Echeverría C, Rosales F, Ortiz M, Tejera E, Paz-Y-Miño C. López-Cortés A, et al. Pathol Oncol Res. 2018 Jul;24(3):457-465. doi: 10.1007/s12253-017-0267-6. Epub 2017 Jun 24. Pathol Oncol Res. 2018. PMID: 28647900 - Five NUCLEAR FACTOR-Y subunit B genes in rapeseed (Brassica napus) promote flowering and root elongation in Arabidopsis.
Fu R, Wang J, Zhou M, Ren X, Hua J, Liang M. Fu R, et al. Planta. 2022 Nov 12;256(6):115. doi: 10.1007/s00425-022-04030-x. Planta. 2022. PMID: 36371542 - BRAF and TERT mutations in papillary thyroid cancer patients of Latino ancestry.
Estrada-Flórez AP, Bohórquez ME, Vélez A, Duque CS, Donado JH, Mateus G, Panqueba-Tarazona C, Polanco-Echeverry G, Sahasrabudhe R, Echeverry M, Carvajal-Carmona LG. Estrada-Flórez AP, et al. Endocr Connect. 2019 Sep;8(9):1310-1317. doi: 10.1530/EC-19-0376. Endocr Connect. 2019. PMID: 31454788 Free PMC article. - On the Protective Effects of Gene SNPs Against Human Cancer.
Tan H. Tan H. EBioMedicine. 2018 Jul;33:4-5. doi: 10.1016/j.ebiom.2018.06.027. Epub 2018 Jun 27. EBioMedicine. 2018. PMID: 29954716 Free PMC article. No abstract available.
References
- Howlader N. N. A.et al.. (ed.)SEER Cancer Statistics Review 1975–2010National Cancer Institute (2013).
Publication types
MeSH terms
Substances
Grants and funding
- HHSN268201100001I/HL/NHLBI NIH HHS/United States
- UM1 CA164920/CA/NCI NIH HHS/United States
- HHSN268201100046C/HL/NHLBI NIH HHS/United States
- HHMI/Howard Hughes Medical Institute/United States
- U01CA86117/CA/NCI NIH HHS/United States
- P30-AG15272/AG/NIA NIH HHS/United States
- HL078885/HL/NHLBI NIH HHS/United States
- R01 CA063446/CA/NCI NIH HHS/United States
- R01 CA132839/CA/NCI NIH HHS/United States
- T32 GM007377/GM/NIGMS NIH HHS/United States
- HHSN268201100003I/HL/NHLBI NIH HHS/United States
- K01 CA160607/CA/NCI NIH HHS/United States
- R25 GM056765/GM/NIGMS NIH HHS/United States
- CA77305/CA/NCI NIH HHS/United States
- UM1 CA164973/CA/NCI NIH HHS/United States
- AI077439/AI/NIAID NIH HHS/United States
- 5UM1CA164973/CA/NCI NIH HHS/United States
- P30 CA015704/CA/NCI NIH HHS/United States
- HHSN268201100004I/HL/NHLBI NIH HHS/United States
- HHSN268201100003C/WH/WHI NIH HHS/United States
- R01 HL078885/HL/NHLBI NIH HHS/United States
- R37 CA54281/CA/NCI NIH HHS/United States
- P30 AG015272/AG/NIA NIH HHS/United States
- U19 AI077439/AI/NIAID NIH HHS/United States
- HHSN271201100004C/AG/NIA NIH HHS/United States
- R01 CA063464/CA/NCI NIH HHS/United States
- U01 CA086117/CA/NCI NIH HHS/United States
- HHSN268201100002C/WH/WHI NIH HHS/United States
- K12 CA138464/CA/NCI NIH HHS/United States
- HHSN268201100002I/HL/NHLBI NIH HHS/United States
- R01 CA63464/CA/NCI NIH HHS/United States
- P30 CA013330/CA/NCI NIH HHS/United States
- R01 HL088133/HL/NHLBI NIH HHS/United States
- R37 CA054281/CA/NCI NIH HHS/United States
- R01 CA120120/CA/NCI NIH HHS/United States
- HHSN268201100001C/WH/WHI NIH HHS/United States
- K24 CA169004/CA/NCI NIH HHS/United States
- HL088133/HL/NHLBI NIH HHS/United States
- HHSN268201100004C/WH/WHI NIH HHS/United States
LinkOut - more resources
Full Text Sources
Other Literature Sources
Medical
Molecular Biology Databases
Miscellaneous


