Increased serum levels of circulating exosomal microRNA-373 in receptor-negative breast cancer patients - PubMed (original) (raw)
Increased serum levels of circulating exosomal microRNA-373 in receptor-negative breast cancer patients
Corinna Eichelser et al. Oncotarget. 2014.
Abstract
In this study, we compared the blood serum levels of circulating cell-free and exosomal microRNAs, and their involvement in the molecular subtypes of breast cancer patients. Our analyses on cell-free miR-101, miR-372 and miR-373 were performed in preoperative blood serum of 168 patients with invasive breast cancer, 19 patients with benign breast diseases and 28 healthy women. MicroRNAs were additionally quantified in exosomes of 50 cancer patients and 12 healthy women from the same cohort. Relative concentrations were measured by quantitative TaqMan MicroRNA assays and correlated to clinicopathological risk factors. The concentrations of cell-free miR-101 (p=0.013) and miR-373 (p=0.024) were significantly different between patients with breast cancer and benign tumors. A prevalence of miR-101, miR-372 and miR-373 were found in exosomes. The levels of circulating exosomal (but not cell-free) miR-373 were higher in triple negative than luminal carcinomas (p=0.027). Also, estrogen-negative (p=0.021) and progesterone-negative (p=0.01) tumors displayed higher concentrations of exosomal miR-373 than patients with hormone-receptor positive tumors. Overexpression of miR-373 by transfection of MCF-7 cells showed downregulated protein expression of the estrogen receptor, and inhibition of apoptosis induced by camptothecin. Our data indicate that serum levels of exosomal miR-373 are linked to triple negative and more aggressive breast carcinomas.
Conflict of interest statement
Disclosure of potential conflicts of interest
No potential conflicts of interest were disclosed.
Figures
Figure 1. Quantification of cell-free miR-101, miR-372 and miR-373 in the serum of patients with invasive breast cancer and benign breast diseases, and healthy women
(A) The box plot compares the miR concentrations in the serum of healthy women (n=28) with patients with benign breast disease (n=19) and breast cancer patients (n=168). (B) Additionally, the concentrations of miR-101, miR-372 and miR-373 in the serum of healthy women (n=28) and patients with benign breast disease (n=19) were compared with the luminal (n=119), HER2+ (n=5) and triple negative (n=33) subtype. The relative expression levels were determined by the low cycle threshold (Ct) values. As determined by the Mann-Whitney-U test, the significant p-values of the statistical evaluations are indicated.
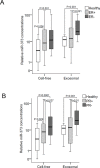
Figure 2. Quantification of cell-free and exosomal miR-101, miR-372 and miR-373 in the serum of patients with invasive breast cancer and healthy women
(A) The box plot compares the relative values of cell-free and exosomal miR-101, miR-372 and miR-373 in the serum of healthy women (n=12) and breast cancer patients (n=50). (B) Additionally, the concentrations of exosomal miR-101, miR-372 and miR-373 in the serum of healthy women (n=12) were compared with the luminal (n=29), HER2+ (n=3) and triple negative (n=12) subtype. The statistically significant p-values, as determined by Mann-Whitney-U test, are indicated.
Figure 3. Quantification of cell-free and exosomal miR-373 in the serum of patients with different hormone receptor statuses
(A) The box plot compares the relative values of exosomal miR-373 in the serum of healthy individuals (n=12) with ER+ (n=35) and ER− (n=14) patients; and (B) with PR+ (n=28) and PR− (n=22) patients. The statistically significant p-values, as determined by Mann-Whitney-U test, are indicated.
Figure 4. Downregulation of ER protein levels by miR-373
(A) Comparison of the relative expression of ER mRNA (bar chart) and ER protein (Western blot) in non-invasive MCF-7 cells with those in invasive MDA-MB-231 cells and micrometastatic BC-M1 cells. (B) ER mRNA levels in MCF-7 cells were quantified by real-time PCR. The relative mRNA expression levels were determined by the low cycle threshold (Ct) values. (C) ER protein levels in MCF-7 cells were analyzed by Western blot. HSC70 signals served as a loading control. ER mRNA (B) and protein levels (C) in cells non-transfected (basal), transfected with the empty expression plasmid or plasmid encoding for miR-373, with mimics or inhibitors of miR-373. (D) Luciferase activity of the reporter plasmid containing the 3′UTR of ER with three binding sites of miR-373 in MCF-7 and MDA-MB-231 cells which were transiently co-transfected with the empty expression plasmid or plasmid encoding for miR-373, with mimics or inhibitors of miR-373. The basal activity was set to 100%. The activities derived from the reference plasmid encoding for the Renilla luciferase were used to normalize the variability in transfection efficiency. The significant p-values as determined by the one-way ANOVA test and standard deviations from triplicate experiments are indicated.
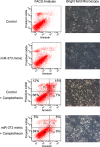
Figure 5. Inhibition of camptothecin mediated apoptosis by miR-373 overexpression
MCF-7 cells transfected with miR-373 mimic and treated with the topoisomerase I inhibitor camptothecin were analyzed on a FACS CantoII device (left) and by a bright field microscopy (right). A 10x magnification of the Axiovert 200 microscope was performed. Cells were labeled with Annexin-V-FITC and propidium iodide for FACS analyses. Cell fragments only positive for propidium iodide can be found in the upper left corner (Q1). Late apoptotic as well as necrotic cells can be found in the upper right corner (Q2), since they are positive for Annexin and propidium iodide. Living cells are negative for Annexin and propidium iodide, and therefore, can be found in the lower left corner (Q3). Only early apoptotic cells are positive for Annexin, and located in the lower right corner (Q4). The size for each population (%) is given in the corresponding area.
Similar articles
- Identification of Specific miRNA Signature in Paired Sera and Tissue Samples of Indian Women with Triple Negative Breast Cancer.
Thakur S, Grover RK, Gupta S, Yadav AK, Das BC. Thakur S, et al. PLoS One. 2016 Jul 12;11(7):e0158946. doi: 10.1371/journal.pone.0158946. eCollection 2016. PLoS One. 2016. PMID: 27404381 Free PMC article. - Different signatures of miR-16, miR-30b and miR-93 in exosomes from breast cancer and DCIS patients.
Ni Q, Stevic I, Pan C, Müller V, Oliveira-Ferrer L, Pantel K, Schwarzenbach H. Ni Q, et al. Sci Rep. 2018 Aug 28;8(1):12974. doi: 10.1038/s41598-018-31108-y. Sci Rep. 2018. PMID: 30154547 Free PMC article. - Deregulated serum concentrations of circulating cell-free microRNAs miR-17, miR-34a, miR-155, and miR-373 in human breast cancer development and progression.
Eichelser C, Flesch-Janys D, Chang-Claude J, Pantel K, Schwarzenbach H. Eichelser C, et al. Clin Chem. 2013 Oct;59(10):1489-96. doi: 10.1373/clinchem.2013.205161. Epub 2013 Jun 7. Clin Chem. 2013. PMID: 23748853 - Exploring research progress in studying serum exosomal miRNA-21 as a molecular diagnostic marker for breast cancer.
Li H, Tie XJ. Li H, et al. Clin Transl Oncol. 2024 Sep;26(9):2166-2171. doi: 10.1007/s12094-024-03454-z. Epub 2024 Apr 11. Clin Transl Oncol. 2024. PMID: 38602645 Review.
Cited by
- The roles of small extracellular vesicles as prognostic biomarkers and treatment approaches in triple-negative breast cancer.
Zhou Y, Xiao Z, Zhu W. Zhou Y, et al. Front Oncol. 2022 Sep 23;12:998964. doi: 10.3389/fonc.2022.998964. eCollection 2022. Front Oncol. 2022. PMID: 36212432 Free PMC article. Review. - Extracellular Vesicles, Circadian Rhythms, and Cancer: A Comprehensive Review with Emphasis on Hepatocellular Carcinoma.
Fekry B, Ugartemendia L, Esnaola NF, Goetzl L. Fekry B, et al. Cancers (Basel). 2024 Jul 16;16(14):2552. doi: 10.3390/cancers16142552. Cancers (Basel). 2024. PMID: 39061191 Free PMC article. Review. - From pathogenesis to clinical application: insights into exosomes as transfer vectors in cancer.
Xu W, Yang Z, Lu N. Xu W, et al. J Exp Clin Cancer Res. 2016 Sep 29;35(1):156. doi: 10.1186/s13046-016-0429-5. J Exp Clin Cancer Res. 2016. PMID: 27686593 Free PMC article. Review. - Trastuzumab-induced upregulation of a protein set in extracellular vesicles emitted by ErbB2-positive breast cancer cells correlates with their trastuzumab sensitivity.
Drucker A, Yoo BH, Khan IA, Choi D, Montermini L, Liu X, Jovanovic S, Younis T, Rosen KV. Drucker A, et al. Breast Cancer Res. 2020 Oct 6;22(1):105. doi: 10.1186/s13058-020-01342-2. Breast Cancer Res. 2020. PMID: 33023655 Free PMC article. - The Role of Exosomal MicroRNAs in the Tumor Microenvironment of Breast Cancer.
Liu Q, Peng F, Chen J. Liu Q, et al. Int J Mol Sci. 2019 Aug 9;20(16):3884. doi: 10.3390/ijms20163884. Int J Mol Sci. 2019. PMID: 31395836 Free PMC article. Review.
References
- Perou CM, Sorlie T, Eisen MB, van de Rijn M, Jeffrey SS, Rees CA, Pollack JR, Ross DT, Johnsen H, Akslen LA, Fluge O, Pergamenschikov A, Williams C, Zhu SX, Lonning PE, Borresen-Dale AL. et al. Molecular portraits of human breast tumours. Nature. 2000;406:747–752. - PubMed
Publication types
MeSH terms
Substances
LinkOut - more resources
Full Text Sources
Other Literature Sources
Research Materials


