A mutation in the mouse ttc26 gene leads to impaired hedgehog signaling - PubMed (original) (raw)
A mutation in the mouse ttc26 gene leads to impaired hedgehog signaling
Ruth E Swiderski et al. PLoS Genet. 2014.
Abstract
The phenotype of the spontaneous mutant mouse hop-sterile (hop) is characterized by a hopping gait, polydactyly, hydrocephalus, and male sterility. Previous analyses of the hop mouse revealed a deficiency of inner dynein arms in motile cilia and a lack of sperm flagella, potentially accounting for the hydrocephalus and male sterility. The etiology of the other phenotypes and the location of the hop mutation remained unexplored. Here we show that the hop mutation is located in the Ttc26 gene and impairs Hedgehog (Hh) signaling. Expression analysis showed that this mutation led to dramatically reduced levels of the Ttc26 protein, and protein-protein interaction assays demonstrated that wild-type Ttc26 binds directly to the Ift46 subunit of Intraflagellar Transport (IFT) complex B. Although IFT is required for ciliogenesis, the Ttc26 defect did not result in a decrease in the number or length of primary cilia. Nevertheless, Hh signaling was reduced in the hop mouse, as revealed by impaired activation of Gli transcription factors in embryonic fibroblasts and abnormal patterning of the neural tube. Unlike the previously characterized mutations that affect IFT complex B, hop did not interfere with Hh-induced accumulation of Gli at the tip of the primary cilium, but rather with the subsequent dissociation of Gli from its negative regulator, Sufu. Our analysis of the hop mouse line provides novel insights into Hh signaling, demonstrating that Ttc26 is necessary for efficient coupling between the accumulation of Gli at the ciliary tip and its dissociation from Sufu.
Conflict of interest statement
The authors have declared that no competing interests exist.
Figures
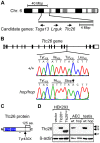
Figure 1. The Ttc26 gene of the hop mouse contains a nonsense mutation.
(A) Schematic representation of genomic positions of genes that both fall within the 16-mega base pair (Mbp) interval to which the hop mutation was mapped and had a known association with the ciliome. (B) Comparison of the 15th exon of the Ttc26 gene in wild-type and hop/hop mice. Horizontal lines represent introns, and black and white rectangles represent the coding and non-coding regions of exons, respectively. A deoxycytidine nucleotide (C) of wild-type Ttc26 (upper chromatogram) is replaced with a deoxyadenosine (A) in the hop mouse, as indicated by an arrow in the lower chromatogram. The point mutation changes the tyrosine (Tyr) at position 430 of Ttc26 to a stop codon (Stop), as shown in the amino-acid sequence lines. (C) Schematic representation of the Ttc26 protein. Blue boxes indicate the predicted TPR motifs. The bracket indicates the C-terminal 125-amino acid region of the protein that is predicted to be missing in hop/hop cells. The asterisk indicates the position of the epitope that is recognized by the anti-Ttc26 antibody. (D) Immunoblot analysis of Ttc26 expression in transfected HEK293 cells, airway epithelial cells (AEC) and testis of wild type (wt) and hop/hop (hop) mice. HEK293 cells were transfected with the indicated Ttc26-encoding construct or an empty expression vector. Arrowheads indicate the positions of the 64, 49, and 37 kDa standards. The antibodies used for immunoblotting are indicated next to the upper and lower panels.
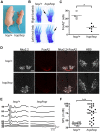
Figure 2. The hop mouse exhibits patterning defects and hearing impairment.
(A) Representative images of hop/+ and hop/hop mice at postnatal day 4. (B) Comparison of Alcian Blue-stained fore and hind limbs of hop/+ and hop/hop mice. Extra digits are indicated by arrows. (C) Statistical analysis of FoxA2-positive cells in the lumbar neural tubes of hop/+ and hop/hop mice (E10.5). Each symbol represents the average number of FoxA2+ cells per focal plane in a single embryo (for each embryo, 12 focal planes in 4 sections were analyzed, Mann-Whitney test: *P = 0.01). (D) Immunostaining of the lumbar neural tube of hop/+ and hop/hop mice (E10.5) with antibodies against the V3 progenitor marker Nkx2.2 (white contrast), the floor plate marker FoxA2 (red), and the motor neuron protein HB9 (white contrast). The hop/hop genotype is associated with reduced FoxA2 expression and ventralization of the Nkx2.2- and HB9-expressing cells. Scale bar: 50 µm. (E) Representative ABR waveforms for 3–4 week-old hop/+ and hop/hop mice. Broadband click stimuli were applied at the indicated sound pressure levels (in dB). (F) Statistical analysis of ABR thresholds measured in 3–4 week-old hop/+ and hop/hop mice. Broadband click stimuli between 30 and 90 dB sound pressure level (SPL) were used. Each symbol represents the value for a single mouse (Mann-Whitney test: ***P<0.0001).
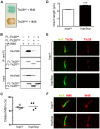
Figure 3. The hop mutation does not impair ciliogenesis or ciliary localization of the Ttc26-interacting protein Ift46.
(A) Color test of protein-protein interactions in yeast transformed with the indicated combination of Ift46 and Ttc26wt or Ttc26hop. Blue staining of the yeast colony (upper patch) is indicative of a protein-protein interaction; a lack thereof indicates the absence of a protein-protein interaction (lower patch). (B) Immunoprecipitation analysis of the Ttc26wt-Ift46 interaction. HEK293 cells were transfected with the indicated combinations of HA-tagged Ift46 and flag (FL)-tagged Ttc26wt or Ttc26hop. The two upper panels show immunoblot analysis of tagged proteins pulled down with an anti-flag antibody, and the two lower panels show immunoblot analysis of input controls. (C) Percentages of ciliated hop/+ and hop/hop MEFs following 2 days of serum starvation. MEFs were isolated from 4 embryos per genotype, and 150 MEFs per embryo were analyzed. (D) Statistical analysis of cilium length in the primary cultures of serum-starved hop/+ and hop/hop MEFs (mean ± SEM, n = 200 cilia per genotype, unpaired _t_-test with Welch correction, ***P<0.0001). (E,F) Immunofluorescence analysis of (E) Ttc26 and (F) Ift46 expression in the cilia of hop/+ and hop/hop MEFs. The axoneme was visualized by immunolabeling of acetylated-α-tubulin (AαT).
Figure 4. The Ttc26 mutation in the hop mouse impairs Shh signaling.
(A) Induction of an adenovirus-delivered Glix8-luciferase reporter gene in wild-type (+/+) and hop/hop MEFs following 2-day incubation with DMSO (0.02%), Shh-conditioned medium, or SAG (400 nM) as indicated (mean ± SEM, n = 3–7). The increase in luciferase expression is shown relative to that in the DMSO control. Constitutive GFP expression from the Glix8-luciferase-encoding viral vector was used for normalization. (B) SAG-dependent induction of the Glix8-luciferase gene in hop/hop MEFs following adenoviral delivery of Ttc26hop or Ttc26wt (mean ± SEM, n = 3–7). The control group of MEFs was not transduced with a Ttc26-encoding virus (no Ttc26). The luciferase signal was normalized to GFP expression as described in panel A. (C) Immunoblot analyses of expression of Gli3-F and Gli3-R in wild-type and hop/hop MEFs, following SAG treatment (400 nM) for the indicated times. ß-actin serves as a loading control (lower panel). (D) Statistical analysis of Gli3-F band intensities in the immunoblot experiments described in panel C (mean ± SEM, n = 3; two-way ANOVA, P<0.006 for the genotype variable; post-hoc Bonferroni test, **P<0.01). (E) Statistical analysis of the ratio of the Gli3-F and Gli3-R bands at the 0 time point in the experiments described in panel C (mean ± SEM, n = 3; unpaired _t_-test, *P = 0.014).
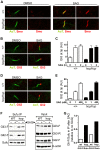
Figure 5. The hop mutation inhibits Gli-Sufu dissociation without altering Gli accumulation at the ciliary tip.
(A) Immunofluorescence analysis of Smo (red) localization to primary cilium (AαT-labeled, green) in wild-type (+/+) and hop/hop MEFs following 4-h treatment with DMSO (0.02%) or SAG (400 nM) as indicated. (B) Immunofluorescence analysis of Gli3 (red) localization to primary cilium tip in wild-type (+/+) and hop/hop MEFs following 2-h treatment with DMSO (0.02%) or SAG (400 nM). (C) Quantitative analysis of Gli3 immunofluorescence signal intensities at the primary cilium tip in +/+ and hop/hop MEFs following SAG treatment (400 nM) for the indicated times (mean ± SEM, n = 40–50). AU: arbitrary units. (D) Immunofluorescence analysis of Gli2 (red) localization to primary cilium tip in +/+ and hop/hop MEFs following 2-day treatment with DMSO (0.02%) or SAG (400 nM). (E) Quantitative analysis of Gli2 immunofluorescence signal intensities at the primary cilium tip in +/+ and hop/hop MEFs following 2-day treatment with the indicated concentrations of SAG (mean ± SEM, n = 45–55). AU: arbitrary units. (F) Gli-Sufu dissociation in +/+ and hop/hop MEFs following 5-h incubation with SAG (400 nM) and the proteasome inhibitor bortezomib (2 µM) or with DMSO (0.02% negative control). Left panels show the relative amounts of Gli3-F, Gli2-F, and Sufu pulled down from the cell lysates using an anti-Sufu antibody. Right panels show the relative amounts of Gli3-F, Gli3-R, Gli2-F, Sufu and ß-actin (loading control) in the total cell lysates. (G) Ratios of band intensities of Gli-F and Sufu were calculated based on the immunoprecipitation results in the left column of panel F, and the Gli-F/Sufu ratios in the immunoprecipitated fractions of SAG-treated +/+ (wt) and hop/hop (hop) cells are shown relative to the Gli-F/Sufu ratios in the immunoprecipitated fractions of non-treated cells.
Similar articles
- Mouse intraflagellar transport proteins regulate both the activator and repressor functions of Gli transcription factors.
Liu A, Wang B, Niswander LA. Liu A, et al. Development. 2005 Jul;132(13):3103-11. doi: 10.1242/dev.01894. Epub 2005 Jun 1. Development. 2005. PMID: 15930098 - A mechanism for vertebrate Hedgehog signaling: recruitment to cilia and dissociation of SuFu-Gli protein complexes.
Tukachinsky H, Lopez LV, Salic A. Tukachinsky H, et al. J Cell Biol. 2010 Oct 18;191(2):415-28. doi: 10.1083/jcb.201004108. J Cell Biol. 2010. PMID: 20956384 Free PMC article. - Stabilization of speckle-type POZ protein (Spop) by Daz interacting protein 1 (Dzip1) is essential for Gli turnover and the proper output of Hedgehog signaling.
Schwend T, Jin Z, Jiang K, Mitchell BJ, Jia J, Yang J. Schwend T, et al. J Biol Chem. 2013 Nov 8;288(45):32809-32820. doi: 10.1074/jbc.M113.512962. Epub 2013 Sep 26. J Biol Chem. 2013. PMID: 24072710 Free PMC article. - Cilia and developmental signaling.
Eggenschwiler JT, Anderson KV. Eggenschwiler JT, et al. Annu Rev Cell Dev Biol. 2007;23:345-73. doi: 10.1146/annurev.cellbio.23.090506.123249. Annu Rev Cell Dev Biol. 2007. PMID: 17506691 Free PMC article. Review. - Developmental and regenerative paradigms of cilia regulated hedgehog signaling.
Kopinke D, Norris AM, Mukhopadhyay S. Kopinke D, et al. Semin Cell Dev Biol. 2021 Feb;110:89-103. doi: 10.1016/j.semcdb.2020.05.029. Epub 2020 Jun 12. Semin Cell Dev Biol. 2021. PMID: 32540122 Free PMC article. Review.
Cited by
- Inhibition of a transcriptional repressor rescues hearing in a splicing factor-deficient mouse.
Nakano Y, Wiechert S, Fritzsch B, Bánfi B. Nakano Y, et al. Life Sci Alliance. 2020 Oct 21;3(12):e202000841. doi: 10.26508/lsa.202000841. Print 2020 Dec. Life Sci Alliance. 2020. PMID: 33087486 Free PMC article. - Overlap between Central and Peripheral Transcriptomes in Parkinson's Disease but Not Alzheimer's Disease.
Hooshmand K, Halliday GM, Pineda SS, Sutherland GT, Guennewig B. Hooshmand K, et al. Int J Mol Sci. 2022 May 6;23(9):5200. doi: 10.3390/ijms23095200. Int J Mol Sci. 2022. PMID: 35563596 Free PMC article. - Overall Architecture of the Intraflagellar Transport (IFT)-B Complex Containing Cluap1/IFT38 as an Essential Component of the IFT-B Peripheral Subcomplex.
Katoh Y, Terada M, Nishijima Y, Takei R, Nozaki S, Hamada H, Nakayama K. Katoh Y, et al. J Biol Chem. 2016 May 20;291(21):10962-75. doi: 10.1074/jbc.M116.713883. Epub 2016 Mar 15. J Biol Chem. 2016. PMID: 26980730 Free PMC article. - Biochemically validated structural model of the 15-subunit intraflagellar transport complex IFT-B.
Petriman NA, Loureiro-López M, Taschner M, Zacharia NK, Georgieva MM, Boegholm N, Wang J, Mourão A, Russell RB, Andersen JS, Lorentzen E. Petriman NA, et al. EMBO J. 2022 Dec 15;41(24):e112440. doi: 10.15252/embj.2022112440. Epub 2022 Nov 10. EMBO J. 2022. PMID: 36354106 Free PMC article. - Cytoneme signaling provides essential contributions to mammalian tissue patterning.
Hall ET, Dillard ME, Cleverdon ER, Zhang Y, Daly CA, Ansari SS, Wakefield R, Stewart DP, Pruett-Miller SM, Lavado A, Carisey AF, Johnson A, Wang YD, Selner E, Tanes M, Ryu YS, Robinson CG, Steinberg J, Ogden SK. Hall ET, et al. Cell. 2024 Jan 18;187(2):276-293.e23. doi: 10.1016/j.cell.2023.12.003. Epub 2024 Jan 2. Cell. 2024. PMID: 38171360 Free PMC article.
References
- Hui CC, Angers S (2011) Gli proteins in development and disease. Annu Rev Cell Dev Biol 27: 513–537. - PubMed
- Ingham PW, McMahon AP (2001) Hedgehog signaling in animal development: paradigms and principles. Genes Dev 15: 3059–3087. - PubMed
- Taipale J, Beachy PA (2001) The Hedgehog and Wnt signalling pathways in cancer. Nature 411: 349–354. - PubMed
- Briscoe J, Thérond PP (2013) The mechanisms of Hedgehog signalling and its roles in development and disease. Nat Rev Mol Cell Biol 14: 416–429. - PubMed
Publication types
MeSH terms
Substances
Grants and funding
- P30 DK-54759/DK/NIDDK NIH HHS/United States
- P30 ES005605/ES/NIEHS NIH HHS/United States
- P30 DC010362/DC/NIDCD NIH HHS/United States
- R01 DC010152/DC/NIDCD NIH HHS/United States
- P30 DK054759/DK/NIDDK NIH HHS/United States
LinkOut - more resources
Full Text Sources
Other Literature Sources
Molecular Biology Databases
Miscellaneous


