Histone hyperacetylation up-regulates protein kinase Cδ in dopaminergic neurons to induce cell death: relevance to epigenetic mechanisms of neurodegeneration in Parkinson disease - PubMed (original) (raw)
Histone hyperacetylation up-regulates protein kinase Cδ in dopaminergic neurons to induce cell death: relevance to epigenetic mechanisms of neurodegeneration in Parkinson disease
Huajun Jin et al. J Biol Chem. 2014.
Abstract
The oxidative stress-sensitive protein kinase Cδ (PKCδ) has been implicated in dopaminergic neuronal cell death. However, little is known about the epigenetic mechanisms regulating PKCδ expression in neurons. Here, we report a novel mechanism by which the PKCδ gene can be regulated by histone acetylation. Treatment with histone deacetylase (HDAC) inhibitor sodium butyrate (NaBu) induced PKCδ expression in cultured neurons, brain slices, and animal models. Several other HDAC inhibitors also mimicked NaBu. The chromatin immunoprecipitation analysis revealed that hyperacetylation of histone H4 by NaBu is associated with the PKCδ promoter. Deletion analysis of the PKCδ promoter mapped the NaBu-responsive element to an 81-bp minimal promoter region. Detailed mutagenesis studies within this region revealed that four GC boxes conferred hyperacetylation-induced PKCδ promoter activation. Cotransfection experiments and Sp inhibitor studies demonstrated that Sp1, Sp3, and Sp4 regulated NaBu-induced PKCδ up-regulation. However, NaBu did not alter the DNA binding activities of Sp proteins or their expression. Interestingly, a one-hybrid analysis revealed that NaBu enhanced transcriptional activity of Sp1/Sp3. Overexpression of the p300/cAMP-response element-binding protein-binding protein (CBP) potentiated the NaBu-mediated transactivation potential of Sp1/Sp3, but expressing several HDACs attenuated this effect, suggesting that p300/CBP and HDACs act as coactivators or corepressors in histone acetylation-induced PKCδ up-regulation. Finally, using genetic and pharmacological approaches, we showed that NaBu up-regulation of PKCδ sensitizes neurons to cell death in a human dopaminergic cell model and brain slice cultures. Together, these results indicate that histone acetylation regulates PKCδ expression to augment nigrostriatal dopaminergic cell death, which could contribute to the progressive neuropathogenesis of Parkinson disease.
Keywords: Epigenetics; Histone Acetylation; Histone Deacetylase Inhibitor (HDAC Inhibitor); Neurodegeneration; Oxidative Stress; PKCδ; Parkinson Disease.
© 2014 by The American Society for Biochemistry and Molecular Biology, Inc.
Figures
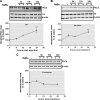
FIGURE 1.
Exposure to HDAC inhibitors increases PKCδ protein expression in primary neurons and cell lines. A, primary mouse nigral (left panel) and striatal (right panel) neurons were exposed to 1 m
m
NaBu for 24 or 48 h, after which whole protein lysates were prepared and subjected to Western blot analysis of PKCδ and actin expression. Representative immunoblots are shown. B–E, primary mouse striatal neurons were exposed to the designated concentrations of HDAC inhibitors VPA (B), Scriptaid (C), TSA (D), or apicidin (E) for 48 h, after which protein lysates were prepared and analyzed for PKCδ and actin expression by immunoblot. Representative immunoblots are shown. F, left panel, mouse neuroblastoma NIE115 cells were treated with 1 m
m
NaBu for 24 or 48 h, lysed, and analyzed by immunoblot for levels of PKCδ and actin. Right panel, densitometric analysis. PKCδ bands were quantified and normalized to that of β-actin. Values are shown as means ± S.E. of two independent experiments. G, mouse dopaminergic MN9D cells were treated with 1 m
m
NaBu for 24 or 48 h and analyzed for levels of PKC isoforms (δ, α, η, ϵ, and ζ) and actin. Representative immunoblots are shown. *, p < 0.05; control (con) versus butyrate-treated samples.
FIGURE 2.
HDAC inhibition increases PKCδ mRNA expression. A–B, primary mouse nigral (left panel) and striatal (right panel) neurons were exposed to 1 m
m
NaBu for 24 or 48 h (A) or to different concentrations of NaBu for 48 h (B). Real time RT-PCR analysis of PKCδ mRNA level was performed. β-Actin mRNA level served as internal control. C, NIE115 (left panel) and MN9D (right panel) cells were exposed to 1 m
m
NaBu for 24 or 48 h, and PKCδ mRNA expression was evaluated by real time RT-PCR analysis. β-Actin mRNA level served as internal control. All values are expressed as a percentage of the activity of controls and represented as means ± S.E. of three independent experiments performed in triplicate. *, p < 0.05; **, p < 0.01; ***, p < 0.001; control (con) versus butyrate-treated samples.
FIGURE 3.
Effects of in vivo sodium butyrate injection on PKCδ protein level. A and B, C57 black mice were administered 1.2 g/kg NaBu or an equivalent volume of saline via intraperitoneal injection for 6–24 h. Substantia nigra (A), striatum (B), and cerebrum (C) tissues from each mouse were harvested and prepared and analyzed for PKCδ, tyrosine hydroxylase (TH), and actin expression by immunoblot. Top panel, representative immunoblots are shown. Bottom panel, quantitation data. The results are normalized to β-actin and expressed as a percentage of the untreated mice. All data are represented as means ± S.E. from four mice per group. **, p < 0.01; saline-treated versus butyrate-treated.
FIGURE 4.
Sodium butyrate increases levels of total histone acetylation and histone acetylation of _PKC_δ promoter-associated chromatin. A, NIE115 cells were exposed to 1 m
m
NaBu for 24 h. Total histones were prepared for blotting with specific anti-acetyl-lysine and anti-H3 antibodies. A representative immunoblot is shown. B, ChIP analysis of hyperacetylated histone H4 on _PKC_δ promoter. NIE115 cells were treated with 1 m
m
NaBu for 24 h, after which chromatin was prepared and sheared by enzymatic digestion. The sheared DNA was then immunoprecipitated with antibody against pan-acetylated histone H4, normal mouse IgG, or without antibody (No Ab). After reversal of cross-linking, immunoprecipitated DNA fragments were analyzed by PCR amplification with primers specific for the _PKC_δ promoter region generating a 312-bp fragment. A representative gel electrophoresis is shown. con, control.
FIGURE 5.
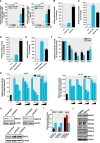
Regulation of _PKC_δ promoter activity by sodium butyrate treatment and ectopic expression of HDACs. A, _PKC_δ promoter activity is activated after treatment with NaBu. The _PKC_δ promoter reporter construct pGL3−1694/+289 or empty vector pGL3-Basic was transfected into MN9D (left panel) and NIE115 (right panel) cells. After 24 h of transfection, the cells were incubated with or without NaBu at concentrations ranging from 0.2 to 1 m
m
for 24 h. Cells were then harvested, and luciferase activities were determined and normalized by total cellular protein. Values are expressed as a percentage of the activity of the pGL3−1694/+289-transfected control and represented as means ± S.E. of three independent experiments performed in triplicate. **, p < 0.01; ***, p < 0.001; control versus NaBu-treated samples. B–E, other HDAC inhibitors stimulate _PKC_δ promoter activity in MN9D cells. The _PKC_δ promoter reporter construct pGL3−1694/+289 was transfected into MN9D cells. After 24 h of transfection, the cells were incubated with VPA (B), TSA (C), apicidin (D), or scriptaid (E) at the designated concentrations for 24 h. Cells were then harvested, and luciferase activities were determined and normalized by total cellular protein. Values are expressed as a percentage of the activity of untreated control (con) and represent the mean ± S.E. of three independent experiments performed in triplicate. ***, p < 0.001; control versus treated samples. F, _PKC_δ promoter activity is repressed by forced expression of HDAC proteins in NIE115 (black bar) and MN9D (blue bar) cells. Cells were cotransfected with pGL3−1694/+289 and 8 μg of HDAC1, HDAC4, HDAC5, or HDAC7 expression vector or the empty vector (EV) control. Luciferase activity was measured after 24 h of transfection and normalized by total cellular protein. Values are expressed as a percentage of the luciferase activity obtained from cells transfected with 8 μg of empty vector (EV) and represented as means ± S.E. of three independent experiments performed in triplicate. **, p < 0.01; ***, p < 0.001; EV- versus HDAC-transfected samples. G, effects of ectopic expression of HDAC proteins on butyrate-induced _PKC_δ promoter activation. MN9D (left panel) and NIE115 (right panel) cells were cotransfected with pGL3−1694/+289 and increasing concentrations of HDAC1, HDAC4, HDAC5, or HDAC7 expression vector (from 2 to 8 μg) or the empty vector (EV) control. After 24 h of transfection, the cells were incubated with or without NaBu (1 m
m
) for 24 h. Cells were then harvested, and luciferase activities were determined and normalized by total cellular protein. Values are expressed as a percentage of the luciferase activity obtained from NaBu-treated cells transfected with 8 μg of empty vector (EV) and are represented as means ± S.E. of three independent experiments performed in triplicate. Variations in the amount of total DNA were compensated with the corresponding empty vector. H, silencing of class I HDAC (HDAC1 and -2) up-regulated PKCδ protein expression in MN9D cells. MN9D cells were transiently transfected with siRNA-HDAC1, siRNA-HDAC2, and scrambled siRNA. Cells were collected 96 h after the initial transfection and then subjected to Western blot analysis. I, densitometric analysis. HDAC1, HDAC2, and PKCδ bands were quantified and normalized to that of β-actin. Values are shown as means ± S.E. of two independent experiments. *, p < 0.05; **, p < 0.01; ***, p < 0.001. J, multiple class I and IIa HDACs are expressed in MN9D and NIE115 cells. MN9D and NIE115 cell lysates were prepared and subjected to immunoblot for various HDACs and β-actin. Representative immunoblots are shown.
FIGURE 6.
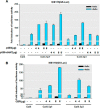
Mapping of sodium butyrate-responsive elements on the _PKC_δ promoter. A, schematic representation of _PKC_δ promoter deletion/luciferase reporter constructs. A series of _PKC_δ promoter deletion derivatives was generated by PCR methods and inserted into the pGL3-Basic luciferase vector. The 5′ and 3′ positions of the constructs with respect to the transcription start site are depicted. B and C, each construct as shown in A was transiently transfected into MN9D (B) and NIE115 (C) cells. After 24 h of transfection, the cells were incubated with (blue bar) or without (black bar) 1 m
m
NaBu for 24 h and then analyzed for luciferase activities. Values are expressed as a percentage of the activity of pGL3−1694/+289-transfected control and represented as means ± S.E. of three independent experiments performed in triplicate. Above each blue bar is the fold change in activation following NaBu exposure in cells transfected with individual promoter construct.
FIGURE 7.
Sodium butyrate activates _PKC_δ promoter through the GC box elements. MN9D and NIE115 cells were transfected with either the wild-type or mutated _PKC_δ promoter and Sp1 site-driven promoter constructs for 24 h. Cells were then incubated with or without NaBu (1 m
m
) for 24 h, and the luciferase activities were measured and normalized by total cellular protein. Luciferase activity following transfection of the wild-type construct (pGL3−147/+209, pGL3+165/+289, or Sp1-luc) was arbitrarily set to 100, and all other data are expressed as a percentage thereof. The results are represented as means ± S.E. of three independent experiments performed in triplicate. Above each blue bar is the fold change in activation following NaBu exposure in cells transfected with the individual promoter construct. A, schematic representation of the wild-type _PKC_δ promoter reporter constructs pGL3−147/+209 and pGL3+165/+289. The multiple Sp sites are depicted by either a circle or square. B, MN9D (left panel) and NIE115 (right panel) cells were transfected with 4 μg of either wild-type (pGL3−147/+209) or mCACCC-mutated luciferase reporter constructs. C, MN9D cells were transfected with either the wild-type (pGL3+165/+289) or single mutated luciferase reporter constructs. D, wild-type (pGL3+165/+289) or triple mutated luciferase reporter constructs, as indicated, were transfected into MN9D (left panel) and NIE115 (right panel) cells. E, Sp1 consensus site-driven luciferase reporter plasmid (Sp1-luc) or its mutant construct (mSp1-luc) was individually transfected into MN9D (left panel) and NIE115 (right panel) cells.
FIGURE 8.
Sp family transcriptional factors mediate responsiveness to sodium butyrate. A, overexpression of Sp1, Sp3, and Sp4 synergistically activated the NaBu induction of _PKC_δ promoter activity in NIE115 cells. NIE115 cells were cotransfected with pGL3−147/+289 and 8 μg of pN3-Sp1, pN3-Sp3, pN3-Sp4, or empty vector (EV) pN3. After 24 h of transfection, the cells were incubated with or without 1 m
m
NaBu for 24 h. Luciferase activities were then assayed and normalized by total cellular protein. Luciferase activity following transfection of empty vector without NaBu treatment was assigned the value 1, and all other data are expressed as a fold induction thereof. The results are represented as means ± S.E. of three independent experiments performed in triplicate. B, overexpression of the dominant-negative mutant Sp1 or Sp3 protein (left panel, pN3-DN-Sp1; right panel, pN3-DN-Sp3) lacking the transactivation domains did not enhance the NaBu induction of _PKC_δ promoter activity in NIE115 cells. NIE115 cells were cotransfected with pGL3−147/+289 and varying concentrations (4–8 μg) of pN3-Sp1, pN3-DN-Sp1, pN3-Sp3, or pN3-DN-Sp3 for 24 h. Cells were then exposed to 1 m
m
NaBu for 24 h, and luciferase activities were determined and normalized. The results are represented as means ± S.E. of three independent experiments performed in triplicate. Variations in total DNA were compensated with the corresponding empty vector pN3. C and D, mithramycin A (C) and tolfenamic acid (D) inhibited the response to NaBu. NIE115 cells were transfected with the _PKC_δ promoter reporter construct pGL3−147/+289 for 24 h. After pretreatment with different doses of mithramycin A and tolfenamic acid for 1 h, the cells were incubated with or without NaBu (1 m
m
) for 24 h. Cells were then harvested, and luciferase activities were determined and normalized by total cellular protein. Values are expressed as a percentage of the activity obtained from control samples without NaBu and mithramycin A or tolfenamic acid treatment and are represented as means ± S.E. of three independent experiments performed in triplicate. **, p < 0.01; ***, p < 0.001; mithramycin A or tolfenamic acid-treated versus untreated samples.
FIGURE 9.
NaBu increases Sp1/3 transcriptional activity. A, Sp3 and Sp4 expression was unaffected by NaBu treatment. NIE115 cells were incubated with or without 1 m
m
NaBu for 24 h. Whole cell lysates were prepared and immunoblotted for Sp3, Sp4, or β-actin (loading control). Both short Sp3 (sSp3) and long Sp3 (lSp3) isoforms are shown. B, NaBu treatment did not lead to increased Sp3 DNA binding. NIE115 cells were treated with or without 1 m
m
NaBu for 24 h, and nuclear extracts from harvested cells were incubated with biotinylated _PKC_δ promoter probe spanning the GC(1) and GC(2) sites. The presence of Sp3 was detected by immunoblotting analysis. A representative immunoblot is shown. C, stimulation by NaBu of the Sp1/3 transactivational potential. The reporter plasmid pG5-luc, which contains five Gal4-binding sites upstream of a minimal TATA box, and the effector plasmids for Gal4 (pM), Gal4-Sp3 (pM-Sp3), Gal4-Sp3DBD (pM-Sp3DBD), Gal4-Sp1 (pM-Sp1), Gal4-Sp1DBD (pM-Sp1DBD) were cotransfected into NIE115 (left panel) and MN9D (right panel) cells and incubated with or without 1 m
m
NaBu for 24 h. Luciferase activities were then determined and normalized by cellular protein. Values are expressed as the fold induction of luciferase activity following transfection of the pG5-luc alone without NaBu treatment and are represented as means ± S.E. of three independent experiments performed in triplicate. Above each blue bar is the fold change in activity in the presence of NaBu over that observed in the absence of NaBu. D, effects of overexpression of HDAC isoforms on the NaBu-induced Gal4-Sp1 (left panel) and Gal4-Sp3 (right panel) transactivation. NIE115 cells were cotransfected with reporter plasmid pG5-luc and 8 μg of Gal4-Sp1 or Gal4-Sp3 in combination with 4 μg of HDAC1, HDAC4, HDAC5, or HDAC7 expression plasmids or empty vector control (pcDNA3.1). The cells were then treated with or without NaBu (1 m
m
) for 24 h, and luciferase activities were determined. Values are expressed as fold induction over the activity obtained following transfection of the Gal4 without NaBu treatment and are represented as means ± S.E. of three independent experiments performed in triplicate. ***, p < 0.001; pCDNA3.1-transfected versus HDACs-transfected samples.
FIGURE 10.
Localization of the domains of Sp1 and Sp3 that are activated in response to NaBu stimulation. A and C, schematic diagram of the expression constructs carrying Gal4-Sp1 (A) and Gal4-Sp3 (C) fusion proteins with each of the indicated portions of Sp1 or Sp3. Amino acid positions demarcating each domain are indicated. AS/T, serine/threonine-rich subdomain within the A box; AQ, glutamine-rich subdomain within the A box; BS/T, serine/threonine-rich subdomain within the B box; BQ, glutamine-rich subdomain within the B box; C, C box, ID, inhibitory domain; D, D box. B and D, expression plasmids as shown in A and C were cotransfected into NIE115 cells with the pG5-luc reporter plasmid. Gal4 (pM) is the empty vector control plasmid. At 24 h post-transfection, cells were treated with or without NaBu (1 m
m
) for 24 h. Luciferase activities were then determined and normalized by cellular protein. Values are expressed as fold induction by NaBu for each transfected sample and are represented as means ± S.E. of three independent experiments performed in triplicate.
FIGURE 11.
Expression of CBP/p300 stimulates NaBu-induced transactivation of Sp1 and Sp3. A and B, NIE115 cells were cotransfected with Gal4-Sp1 or Gal4-Sp3 expression constructs, the luciferase reporter plasmid pG5-luc, and the indicated amounts of CMV-driven expression vectors for p300, p300dHAT (A), or CBP (B). The cells were then treated with or without NaBu (1 m
m
) for 24 h. Luciferase activities were determined. Values are expressed as the fold induction over the activity obtained following transfection of the Gal4 without NaBu treatment and are represented as means ± S.E. of three independent experiments performed in triplicate.
FIGURE 12.
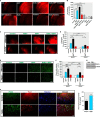
Increased PKCδ potentiates 6-OHDA-induced oxidative damage in differentiated human dopaminergic LUHMES cells. A and B, differentiated LUHMES cells were treated with 1 m
m
NaBu, and PKCδ expression was analyzed by immunoblot (A) and immunocytochemistry (B). For immunoblot, densitometric quantitation of the ratio of band intensity of PKCδ and β-actin from three independent experiments (means ± S.E.; *, p < 0.05) is shown on the bottom panel. For immunocytochemistry, cells were immunostained for PKCδ (green) and neuron-specific marker β-III tubulin (TuJ1, red), and the nuclei were counterstained by Hoechst 33342 (blue). Images were taken using a Nikon TE2000 fluorescence microscope. Magnification, ×40. Scale bar, 20 μm. Representative immunofluorescence images are shown. C and D, differentiated LUHMES cells were pretreated with or without 1 m
m
NaBu or 0.3 μ
m
rottlerin for 1 h and then cotreated with 30 μ
m
6-OHDA for 24 h. After treatment, 6-OHDA-induced oxidative toxicity was measured using the dopamine assay (C) and MTS assay (D). E, LUHMES cells were pre-differentiated for 2 days followed by 2 days of transduction with shRNA lentivirus targeting against human PKCδ (_sh-PKC_δ) or scrambled lentivirus (sh-Scr). Real time RT-PCR analysis of PKCδ mRNA level was performed. 18 S rRNA level served as internal control. F, left panel, LUHMES cells infected with sh-PKCδ #1 or scrambled lentivirus were pretreated with or without 1 m
m
NaBu for 1 h and then cotreated with 30 μ
m
6-OHDA for 24 h. Cell viability was analyzed by MTS assay. All data are expressed as the mean ± S.E. of three independent experiments and are shown as a percentage of control or scrambled shRNA-infected control cultures. Right panel, LUHMES cells infected with sh-PKCδ #1 or scrambled lentivirus for 48 or 96 h were analyzed for PKCδ expression. Representative immunoblots are shown. *, p < 0.05; **, p < 0.01; ***, p < 0.001.
FIGURE 13.
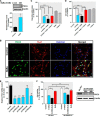
Increased PKCδ sensitizes organotypic corticostriatal slice cultures to MPP+-induced neurodegeneration. A, organotypic corticostriatal slice cultures from wild-type adult C57 black mice were preincubated in the presence or absence of 1 m
m
NaBu and/or 5 μ
m
rottlerin for 3 h followed by a 24-h incubation with 300 μ
m
MPP+. Cell death was measured using PI uptake assay. Representative PI uptake fluorescent images are shown. Images were obtained using a Nikon TE2000 fluorescence microscope. Magnification, ×2. Scale bar, 500 μm. B, quantification of PI fluorescence intensity. PI fluorescence was measured in each group using ImageJ software. C, organotypic corticostriatal slice cultures from wild-type and PKCδ knock-out (PKCδ−/−) C57 black mice were pretreated with or without 1 m
m
NaBu for 3 h and then cotreated with 300 μ
m
MPP+ for 24 h, and cell death was measured using PI uptake assay. Representative PI uptake fluorescent images are shown. Magnification, ×2. Scale bar, 500 μm. D, quantification of PI fluorescence intensity. E, organotypic corticostriatal slice cultures from 9- to 12-day-old wild-type and PKCδ−/− pups were pretreated with or without 1 m
m
NaBu for 3 h and then cotreated with 300 μ
m
MPP+ for 24 h, and cell death was measured using Fluoro-Jade staining assay. Representative Fluoro-Jade fluorescent images are shown. Magnification, ×20. Scale bar, 100 μm. F, quantification of Fluoro-Jade fluorescence intensity. G, organotypic corticostriatal slice cultures from adult C57 black mice were treated with 1 m
m
NaBu for 24 h, and levels of PKCδ were analyzed by immunoblot. H, exposure of organotypic corticostriatal slices to 1 m
m
NaBu increased PKCδ immunoreactivity. After treatment, cultures were immunostained for PKCδ (green) and neuron-specific marker β-III tubulin (red), and the nuclei were counterstained by Hoechst 33342 (blue). Images were taken using a Nikon TE2000 fluorescence microscope. Magnification, ×20. Scale bar, 50 μm. Representative immunofluorescence images are shown. Quantification of normalized PKCδ (PKCδ/TuJ1) immunoreactivity is shown in the right panel. Fluorescence immunoreactivity of PKCδ and TuJ1 was measured in each group using ImageJ software. All data expressed as percent of wild-type control (con) group are mean ± S.E. and representative for results obtained from three separate experiments. ns, not significant. *, p < 0.05; **, p < 0.01; ***, p < 0.001.
Similar articles
- Transcriptional regulation of pro-apoptotic protein kinase Cdelta: implications for oxidative stress-induced neuronal cell death.
Jin H, Kanthasamy A, Anantharam V, Rana A, Kanthasamy AG. Jin H, et al. J Biol Chem. 2011 Jun 3;286(22):19840-59. doi: 10.1074/jbc.M110.203687. Epub 2011 Apr 5. J Biol Chem. 2011. PMID: 21467032 Free PMC article. - α-Synuclein negatively regulates protein kinase Cδ expression to suppress apoptosis in dopaminergic neurons by reducing p300 histone acetyltransferase activity.
Jin H, Kanthasamy A, Ghosh A, Yang Y, Anantharam V, Kanthasamy AG. Jin H, et al. J Neurosci. 2011 Feb 9;31(6):2035-51. doi: 10.1523/JNEUROSCI.5634-10.2011. J Neurosci. 2011. PMID: 21307242 Free PMC article. - Epigenetic targeting of histone deacetylase: therapeutic potential in Parkinson's disease?
Harrison IF, Dexter DT. Harrison IF, et al. Pharmacol Ther. 2013 Oct;140(1):34-52. doi: 10.1016/j.pharmthera.2013.05.010. Epub 2013 May 24. Pharmacol Ther. 2013. PMID: 23711791 Review. - Epigenetic Regulation of Multidrug Resistance Protein 1 and Breast Cancer Resistance Protein Transporters by Histone Deacetylase Inhibition.
You D, Richardson JR, Aleksunes LM. You D, et al. Drug Metab Dispos. 2020 Jun;48(6):459-480. doi: 10.1124/dmd.119.089953. Epub 2020 Mar 19. Drug Metab Dispos. 2020. PMID: 32193359 Free PMC article. Review.
Cited by
- α-Tocopherol at Nanomolar Concentration Protects Cortical Neurons against Oxidative Stress.
Zakharova IO, Sokolova TV, Vlasova YA, Bayunova LV, Rychkova MP, Avrova NF. Zakharova IO, et al. Int J Mol Sci. 2017 Jan 21;18(1):216. doi: 10.3390/ijms18010216. Int J Mol Sci. 2017. PMID: 28117722 Free PMC article. - PKC Delta Activation Promotes Endoplasmic Reticulum Stress (ERS) and NLR Family Pyrin Domain-Containing 3 (NLRP3) Inflammasome Activation Subsequent to Asynuclein-Induced Microglial Activation: Involvement of Thioredoxin-Interacting Protein (TXNIP)/Thioredoxin (Trx) Redoxisome Pathway.
Samidurai M, Palanisamy BN, Bargues-Carot A, Hepker M, Kondru N, Manne S, Zenitsky G, Jin H, Anantharam V, Kanthasamy AG, Kanthasamy A. Samidurai M, et al. Front Aging Neurosci. 2021 Jul 2;13:661505. doi: 10.3389/fnagi.2021.661505. eCollection 2021. Front Aging Neurosci. 2021. PMID: 34276337 Free PMC article. - Alterations in mitochondrial dynamics induced by tebufenpyrad and pyridaben in a dopaminergic neuronal cell culture model.
Charli A, Jin H, Anantharam V, Kanthasamy A, Kanthasamy AG. Charli A, et al. Neurotoxicology. 2016 Mar;53:302-313. doi: 10.1016/j.neuro.2015.06.007. Epub 2015 Jul 2. Neurotoxicology. 2016. PMID: 26141520 Free PMC article. - Environmental neurotoxicant manganese regulates exosome-mediated extracellular miRNAs in cell culture model of Parkinson's disease: Relevance to α-synuclein misfolding in metal neurotoxicity.
Harischandra DS, Ghaisas S, Rokad D, Zamanian M, Jin H, Anantharam V, Kimber M, Kanthasamy A, Kanthasamy AG. Harischandra DS, et al. Neurotoxicology. 2018 Jan;64:267-277. doi: 10.1016/j.neuro.2017.04.007. Epub 2017 Apr 24. Neurotoxicology. 2018. PMID: 28450057 Free PMC article.
References
- Dempsey E. C., Newton A. C., Mochly-Rosen D., Fields A. P., Reyland M. E., Insel P. A., Messing R. O. (2000) Protein kinase C isozymes and the regulation of diverse cell responses. Am. J. Physiol. Lung Cell Mol. Physiol 279, L429–L438 - PubMed
- Brodie C., Blumberg P. M. (2003) Regulation of cell apoptosis by protein kinase Cδ. Apoptosis 8, 19–27 - PubMed
- Anantharam V., Kitazawa M., Wagner J., Kaul S., Kanthasamy A. G. (2002) Caspase-3-dependent proteolytic cleavage of protein kinase Cδ is essential for oxidative stress-mediated dopaminergic cell death after exposure to methylcyclopentadienyl manganese tricarbonyl. J. Neurosci. 22, 1738–1751 - PMC - PubMed
- Kaul S., Kanthasamy A., Kitazawa M., Anantharam V., Kanthasamy A. G. (2003) Caspase-3-dependent proteolytic activation of protein kinase Cδ mediates and regulates 1-methyl-4-phenylpyridinium (MPP+)-induced apoptotic cell death in dopaminergic cells: relevance to oxidative stress in dopaminergic degeneration. Eur. J. Neurosci. 18, 1387–1401 - PubMed
Publication types
MeSH terms
Substances
Grants and funding
- R01 ES10586/ES/NIEHS NIH HHS/United States
- NS65167/NS/NINDS NIH HHS/United States
- R01 NS065167/NS/NINDS NIH HHS/United States
- R01 NS074443/NS/NINDS NIH HHS/United States
- GM055835/GM/NIGMS NIH HHS/United States
- R01 GM055835/GM/NIGMS NIH HHS/United States
- R01 ES010586/ES/NIEHS NIH HHS/United States
LinkOut - more resources
Full Text Sources
Other Literature Sources
Medical
Molecular Biology Databases
Miscellaneous


