The Mouse Genome Database (MGD): facilitating mouse as a model for human biology and disease - PubMed (original) (raw)
. 2015 Jan;43(Database issue):D726-36.
doi: 10.1093/nar/gku967. Epub 2014 Oct 27.
Collaborators, Affiliations
- PMID: 25348401
- PMCID: PMC4384027
- DOI: 10.1093/nar/gku967
The Mouse Genome Database (MGD): facilitating mouse as a model for human biology and disease
Janan T Eppig et al. Nucleic Acids Res. 2015 Jan.
Abstract
The Mouse Genome Database (MGD, http://www.informatics.jax.org) serves the international biomedical research community as the central resource for integrated genomic, genetic and biological data on the laboratory mouse. To facilitate use of mouse as a model in translational studies, MGD maintains a core of high-quality curated data and integrates experimentally and computationally generated data sets. MGD maintains a unified catalog of genes and genome features, including functional RNAs, QTL and phenotypic loci. MGD curates and provides functional and phenotype annotations for mouse genes using the Gene Ontology and Mammalian Phenotype Ontology. MGD integrates phenotype data and associates mouse genotypes to human diseases, providing critical mouse-human relationships and access to repositories holding mouse models. MGD is the authoritative source of nomenclature for genes, genome features, alleles and strains following guidelines of the International Committee on Standardized Genetic Nomenclature for Mice. A new addition to MGD, the Human-Mouse: Disease Connection, allows users to explore gene-phenotype-disease relationships between human and mouse. MGD has also updated search paradigms for phenotypic allele attributes, incorporated incidental mutation data, added a module for display and exploration of genes and microRNA interactions and adopted the JBrowse genome browser. MGD resources are freely available to the scientific community.
© The Author(s) 2014. Published by Oxford University Press on behalf of Nucleic Acids Research.
Figures
Figure 1.
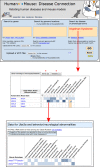
Human–Mouse: Disease Connection (HMDC). The top panel shows the upper portion of the HMDC homepage. Searches can be initiated using human or mouse gene(s), location(s) or disease/phenotype terms. Alternatively VCF files or files of gene symbols or IDs can be submitted as search parameters. The disease/phenotype search box has an autocomplete feature allowing the user to choose the exact term desired. In this example Angelman Syndrome was selected. The results (middle panel) are presented in grid format, listing genes associated with Angelman Syndrome in human or mouse in the left-most columns. Grid colors representing mouse data are blue and human data are orange, with color intensity being darker for more annotations. Phenotype and disease terms are indicated in the columns on the right-hand side of the grid. Note that both human and mouse homologs (UBE3A and Ube3a, respectively) are associated with the disease. In addition, human CDKL5 and MECP2 are associated human genes and Snrpn is an associated mouse gene. This might suggest additional mouse models could be created by mutating mouse genes Cdkl5 or Mecp2; and that other potential human mutations in SNRPN might be examined as an Angelman Syndrome candidate gene. For genes that have known models in mice (Snrpn and Ube3a) a phenotype profile is provided. The red asterisk (*) indicate tabs that display data in a tabular format by genes or by diseases. Each colored cell within the grid is interactive and clicking on a cell leads to further details (bottom panel).
Figure 2.
Mouse genome annotation browser implemented in JBrowse. Example of the allele and phenotype annotations for mouse Cav2 and Cav1 genes. The MGI track displays unified mouse gene catalog contents. Tracks from external genome annotation groups such as NCBI provide details regarding transcriptional isoforms of mouse genes. Track controls allow users to customize aspects of the display and to download data from the JBrowse tracks.
Figure 3.
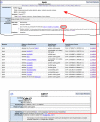
Genome feature–genome feature cluster relationship. Top panel shows the upper portion of the homeobox A cluster detail page. Cluster members are now indicated, with a link to the full list of genes in the cluster membership. Each cluster member gene page (bottom panel) shows what cluster that gene is a member of, with a link to the cluster's detail page.
Figure 4.
Interaction Explorer. On the Bmp4 gene detail page (top panel), a new ‘Interactions’ ribbon has been added. The initial sets of interaction data incorporated by MGD are interactions of genes with microRNAs. The Bmp4 gene interacts with 50 genome features that can be viewed by selecting the ‘View All’ button. The Interaction Explorer page (bottom panel) graphically and dynamically displays interactions on the left and provides a tabular view on the right. By using the filtering and sorting options, users can limit the number of interactions shown. The graphical view changes in response to such filtering and can be made larger or smaller to aid viewing. The selected marker (here, Bmp4) is shown in the center of the graph display with blue lines connecting validated interactions and red lines connecting predicted interactions.
Figure 5.
Gene–allele relationships. MGD now represents the components of complex mutations. For a given complex mutation (here, bpck), the individual genes or genome features mutated are viewable, along with the type of change that each has undergone (top and middle panels). Conversely, any gene detail page for a single genome feature component of a complex mutation (here, Cdh17 is a component of the complex mutation bpck) indicates the existence of its participation in ‘genomic mutations’ that include that particular gene.
Figure 6.
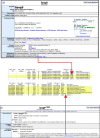
Incidental Mutations from ENU experiments. Incidental mutations are accessed from the Gene Detail Page or Allele Detail Page. The top panel shows the Spag9 gene page with a link to two incidental mutations in this gene from the Mutagenetix mutation collection. Spag9 mutations were discovered in two mutant stocks from this collection. The bottom panel shows the Spag9m1Btlr allele detail page. Six incidental mutations were detected in the stock carrying this mutation.
Figure 7.
Allele attributes and project collections. Screen shot of the Categories ribbon from the Phenotypes, Alleles & Disease Models Query Form (
http://www.informatics.jax.org/allele/
). When searching for alleles with specific characteristics a generation method may be selected, one or more allele attributes may be selected, and membership of an allele in a project collection may be selected. For example, one might select the generation method ‘Chemically induced (ENU)’ and attribute ‘Hypomorph’ to find those ENU mutations that show partial function. A selection from the project collections attribute would further restrict one's query to those alleles generated in the project(s) selected.
Similar articles
- The mouse genome database (MGD): new features facilitating a model system.
Eppig JT, Blake JA, Bult CJ, Kadin JA, Richardson JE; Mouse Genome Database Group. Eppig JT, et al. Nucleic Acids Res. 2007 Jan;35(Database issue):D630-7. doi: 10.1093/nar/gkl940. Epub 2006 Nov 29. Nucleic Acids Res. 2007. PMID: 17135206 Free PMC article. - The Mouse Genome Database (MGD): comprehensive resource for genetics and genomics of the laboratory mouse.
Eppig JT, Blake JA, Bult CJ, Kadin JA, Richardson JE; Mouse Genome Database Group. Eppig JT, et al. Nucleic Acids Res. 2012 Jan;40(Database issue):D881-6. doi: 10.1093/nar/gkr974. Epub 2011 Nov 10. Nucleic Acids Res. 2012. PMID: 22075990 Free PMC article. - The Mouse Genome Database genotypes::phenotypes.
Blake JA, Bult CJ, Eppig JT, Kadin JA, Richardson JE; Mouse Genome Database Group. Blake JA, et al. Nucleic Acids Res. 2009 Jan;37(Database issue):D712-9. doi: 10.1093/nar/gkn886. Epub 2008 Nov 3. Nucleic Acids Res. 2009. PMID: 18981050 Free PMC article. - Mouse Genome Database: From sequence to phenotypes and disease models.
Eppig JT, Richardson JE, Kadin JA, Smith CL, Blake JA, Bult CJ; MGD Team. Eppig JT, et al. Genesis. 2015 Aug;53(8):458-73. doi: 10.1002/dvg.22874. Epub 2015 Jul 27. Genesis. 2015. PMID: 26150326 Free PMC article. Review. - Mouse Genome Informatics (MGI) Is the International Resource for Information on the Laboratory Mouse.
Law M, Shaw DR. Law M, et al. Methods Mol Biol. 2018;1757:141-161. doi: 10.1007/978-1-4939-7737-6_7. Methods Mol Biol. 2018. PMID: 29761459 Review.
Cited by
- Interactions between microbiota and uterine corpus endometrial cancer: A bioinformatic investigation of potential immunotherapy.
Alkhalil SS, Almanaa TN, Altamimi RA, Abdalla M, El-Arabey AA. Alkhalil SS, et al. PLoS One. 2024 Oct 30;19(10):e0312590. doi: 10.1371/journal.pone.0312590. eCollection 2024. PLoS One. 2024. PMID: 39475915 Free PMC article. - Evolution of ion channels in cetaceans: a natural experiment in the tree of life.
Uribe C, Nery MF, Zavala K, Mardones GA, Riadi G, Opazo JC. Uribe C, et al. Sci Rep. 2024 Jul 23;14(1):17024. doi: 10.1038/s41598-024-66082-1. Sci Rep. 2024. PMID: 39043711 Free PMC article. - SingleCellGGM enables gene expression program identification from single-cell transcriptomes and facilitates universal cell label transfer.
Xu Y, Wang Y, Ma S. Xu Y, et al. Cell Rep Methods. 2024 Jul 15;4(7):100813. doi: 10.1016/j.crmeth.2024.100813. Epub 2024 Jul 5. Cell Rep Methods. 2024. PMID: 38971150 Free PMC article. - Sequence-based machine learning reveals 3D genome differences between bonobos and chimpanzees.
Brand CM, Kuang S, Gilbertson EN, McArthur E, Pollard KS, Webster TH, Capra JA. Brand CM, et al. bioRxiv [Preprint]. 2023 Oct 26:2023.10.26.564272. doi: 10.1101/2023.10.26.564272. bioRxiv. 2023. PMID: 37961120 Free PMC article. Updated. Preprint. - Developmental coordination disorder: What can we learn from RI mice using motor learning tasks and QTL analysis.
Gill K, Rajan JRS, Chow E, Ashbrook DG, Williams RW, Zwicker JG, Goldowitz D. Gill K, et al. Genes Brain Behav. 2023 Dec;22(6):e12859. doi: 10.1111/gbb.12859. Epub 2023 Aug 8. Genes Brain Behav. 2023. PMID: 37553802 Free PMC article.
References
Publication types
MeSH terms
LinkOut - more resources
Full Text Sources
Other Literature Sources


