Development of gonadotropin-releasing hormone secretion and pituitary response - PubMed (original) (raw)
Development of gonadotropin-releasing hormone secretion and pituitary response
Katarzyna M Glanowska et al. J Neurosci. 2014.
Abstract
Acquisition of a mature pattern of gonadotropin-releasing hormone (GnRH) secretion from the CNS is a hallmark of the pubertal process. Little is known about GnRH release during sexual maturation, but it is assumed to be minimal before later stages of puberty. We studied spontaneous GnRH secretion in brain slices from male mice during perinatal and postnatal development using fast-scan cyclic voltammetry (FSCV) to detect directly the oxidation of secreted GnRH. There was good correspondence between the frequency of GnRH release detected by FSCV in the median eminence of slices from adults with previous reports of in vivo luteinizing hormone (LH) pulse frequency. The frequency of GnRH release in the late embryonic stage was surprisingly high, reaching a maximum in newborns and remaining elevated in 1-week-old animals despite low LH levels. Early high-frequency GnRH release was similar in wild-type and kisspeptin knock-out mice indicating that this release is independent of kisspeptin-mediated excitation. In vivo treatment with testosterone or in vitro treatment with gonadotropin-inhibitory hormone (GnIH) reduced GnRH release frequency in slices from 1-week-old mice. RF9, a putative GnIH antagonist, restored GnRH release in slices from testosterone-treated mice, suggesting that testosterone inhibition may be GnIH-dependent. At 2-3 weeks, GnRH release is suppressed before attaining adult patterns. Reduction in early life spontaneous GnRH release frequency coincides with the onset of the ability of exogenous GnRH to induce pituitary LH secretion. These findings suggest that lack of pituitary secretory response, not lack of GnRH release, initially blocks downstream activation of the reproductive system.
Keywords: cyclic voltammetry; gonadotropin inhibitory hormone; gonadotropin releasing hormone; puberty; testosterone.
Copyright © 2014 the authors 0270-6474/14/3415060-10$15.00/0.
Figures
Figure 1.
Pattern of GnRH release detected in the ME of brain slices in adults. A, FSCV waveform;holding potential 0.5 V, switching potential 1.45 V, scan rate −400 V/s (adapted from (Glanowska et al., 2012). B, Pseudo-color representation of current changes (color scale) as a function of time (_x_-axis) and potential (_y_-axis) for representative spontaneous GnRH release in the ME of a brain slice from an adult male mouse. C, Background-subtracted cyclic voltammogram for the spontaneous event shown in B. D, Two representative examples of the pattern of spontaneous GnRH release in adults. Summary data are shown in Figure 2 for ease of comparison with other developmental stages. E, Application of dopamine (DA, 10 μ
m
, black bar) did not produce a current signal with the waveform used to detect GnRH. Left, Pseudo-color representation of current changes; right, background-subtracted cyclic voltammogram. Dotted line indicates voltage value for stereotypical dopamine oxidation peak.
Figure 2.
Developmental changes in spontaneous GnRH release. A, Two representative examples of the pattern of spontaneous GnRH release at each developmental age studied in wild-type mice and in kisspeptin KO mice (kiss1 −/−) at 1 week. Each vertical bar represents an individual GnRH release event. B, Two representative examples of spontaneous GnRH release in 1-wk-old mice in low calcium solution; light gray: low calcium (0.5 m
m
) buffer present in the recording chamber; dark gray: high KCl (20 m
m
) normal calcium ACSF in the recording chamber to evoke GnRH secretion. C, Mean ± SEM frequency of GnRH release in normal (con) and low calcium ACSF; p < 0.05, paired t test. D–G, Mean ± SEM characteristics of spontaneous GnRH release; numbers within/above bars represent sample size. D, Frequency of GnRH secretion expressed as number of release events per hour; different letters represent statistical significance; p < 0.0001, one-way ANOVA followed by Tukey's multiple-comparison test. E, Amplitude of GnRH release; *p < 0.05, one-way ANOVA followed by Tukey's multiple-comparison test. F, Duration of individual events; different letters represent statistical significance; p < 0.0001, one-way ANOVA followed by Tukey's multiple-comparison test. G, Responsiveness to 10 n
m
kisspeptin; different letters represent statistical significance; p < 0.01, χ2 test.
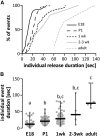
Figure 3.
GnRH release events appear to consolidate with age, resulting in lower-frequency, longer duration release. A, Cumulative distribution function of duration of all individual GnRH events in different age groups. Data for 2- and 3-week-old mice were combined attributable to paucity of events. B, Duration for all individual GnRH events (gray circles), same groups as in A; horizontal lines, data median; vertical lines, data range; different letters represent statistical significance; p < 0.0001, Kruskal–Wallis test followed by Dunn's multiple-comparison test.
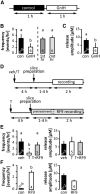
Figure 4.
GnIH and testosterone inhibition of spontaneous GnRH secretion. A, Experimental design for the effect of GnIH on GnRH release in 1-week-old animals; 1 h of control recording (white block) followed by 1 h of recording in the presence of 1 μ
m
GnIH. B, Left, Frequency of spontaneous GnRH release under control conditions and incubation with 1 μ
m
GnIH. Right, Frequency of spontaneous GnRH release during the first versus second hours of recording under conditions (data from Fig. 2); p < 0.05 paired t test. C, Amplitude of spontaneous GnRH release under control conditions and incubation with 1 μ
m
GnIH, p < 0.05 paired t test. D, Experimental design for the effect of peripheral testosterone (T) administration on GnRH release (top); black arrows, timing of T/vehicle (veh) injection or slice preparation; white bar, timing of recording. Experimental design for the effect of 5 μ
m
RF9 on T-induced decrease of GnRH release (bottom); black arrows, timing of T administration or slice preparation; gray bar, 1–4 h of slice pretreatment with RF9 followed by 2 h of recording in the presence of RF9. E, Effects of in vivo testosterone injection with and without in vitro RF9 incubation on frequency (left) and amplitude (right) of spontaneous GnRH secretion, p < 0.01, one-way ANOVA followed by Tukey's multiple-comparison test. F, Frequency and amplitude of spontaneous GnRH release in slices from 2-week-old males incubated in RF9, p < 0.05, t test. Values are mean ± SEM; numbers within/above bars represent sample size, different letters represent statistical significance.
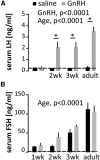
Figure 5.
Failure of pituitary secretory response to exogenous GnRH at ages exhibiting high spontaneous GnRH release frequency. GnRH-induced LH (A) and FSH (B) release in males. Data are represented as mean ± SEM, two-way ANOVA followed by Holms–Sidak multiple-comparison test (P1 animals were excluded from this analysis as no GnRH challenge was performed in this group); *p < 0.01. Dashed lines indicate assay sensitivity. Note the different _y_-axis scales in A and B.
Figure 6.
Effect of GnRH on expression of selected pituitary genes as a function of age. A–H, Normalized relative gene expressions for Gnrhr (A), Egr1 (B), Lhb PT (C), Lhb steady-state mRNA (D), Fshb PT (E), FSHb steady-state mRNA (F), GnIH receptors/GPR147/GPR74 (Npffr1/Npffr2); G), and Fst (H). Pituitary gene expression was normalized to ribosomal protein S29 mRNA (Rps29), which did not change with either age or GnRH treatment. Data are represented as mean ± SEM, two-way ANOVA followed by Holms–Sidak multiple-comparison test (P1 animals were excluded from this analysis).
Figure 7.
GnRH-induced intracellular signaling in mouse pituitaries, in vivo. A, Representative western blots of pituitary protein (20 μg/lane) from adult male mice injected with either saline or 150 ng/kg GnRH, intraperitoneally, and then killed 5, 15, or 30 min postinjection (n = 2–3 per group) or from αT3 cells treated with either saline or 200 n
m
GnRH for 10 min. Blots were immunostained for dually phosphorylated (phospho) ERK1/2, total ERK1/2, and α-tubulin. B, C, Changes in phosphorylated (A) and total (B) ERK1/2 were quantified by densitometry.
Similar articles
- Prenatal androgen excess enhances stimulation of the GNRH pulse in pubertal female rats.
Yan X, Yuan C, Zhao N, Cui Y, Liu J. Yan X, et al. J Endocrinol. 2014 Jul;222(1):73-85. doi: 10.1530/JOE-14-0021. Epub 2014 May 14. J Endocrinol. 2014. PMID: 24829217 - The effects of chronic subcutaneous administration of an investigational kisspeptin analog, TAK-683, on gonadotropin-releasing hormone pulse generator activity in goats.
Yamamura T, Wakabayashi Y, Sakamoto K, Matsui H, Kusaka M, Tanaka T, Ohkura S, Okamura H. Yamamura T, et al. Neuroendocrinology. 2014;100(2-3):250-64. doi: 10.1159/000369819. Epub 2014 Nov 18. Neuroendocrinology. 2014. PMID: 25428554 - Effects of testosterone on gonadotropin subunit messenger ribonucleic acids in the presence or absence of gonadotropin-releasing hormone.
Winters SJ, Ishizaka K, Kitahara S, Troen P, Attardi B. Winters SJ, et al. Endocrinology. 1992 Feb;130(2):726-34. doi: 10.1210/endo.130.2.1370794. Endocrinology. 1992. PMID: 1370794 - The role of kisspeptin and gonadotropin inhibitory hormone in the seasonal regulation of reproduction in sheep.
Smith JT. Smith JT. Domest Anim Endocrinol. 2012 Aug;43(2):75-84. doi: 10.1016/j.domaniend.2011.11.003. Epub 2011 Nov 27. Domest Anim Endocrinol. 2012. PMID: 22177698 Review. - Changes in the control of gonadotrophin secretion by neurotransmitters during sexual development in rats.
Moguilevsky JA, Wuttke W. Moguilevsky JA, et al. Exp Clin Endocrinol Diabetes. 2001;109(4):188-95. doi: 10.1055/s-2001-15105. Exp Clin Endocrinol Diabetes. 2001. PMID: 11453030 Review.
Cited by
- Kisspeptin Neuron-Specific and Self-Sustained Calcium Oscillation in the Hypothalamic Arcuate Nucleus of Neonatal Mice: Regulatory Factors of its Synchronization.
Kim D, Jang S, Kim J, Park I, Ku K, Choi M, Lee S, Heo WD, Son GH, Choe HK, Kim K. Kim D, et al. Neuroendocrinology. 2020;110(11-12):1010-1027. doi: 10.1159/000505922. Epub 2020 Jan 15. Neuroendocrinology. 2020. PMID: 31935735 Free PMC article. - Long-Term Recordings of Arcuate Nucleus Kisspeptin Neurons Reveal Patterned Activity That Is Modulated by Gonadal Steroids in Male Mice.
Vanacker C, Moya MR, DeFazio RA, Johnson ML, Moenter SM. Vanacker C, et al. Endocrinology. 2017 Oct 1;158(10):3553-3564. doi: 10.1210/en.2017-00382. Endocrinology. 2017. PMID: 28938398 Free PMC article. - GnRH Neuron Activity and Pituitary Response in Estradiol-Induced vs Proestrous Luteinizing Hormone Surges in Female Mice.
Silveira MA, Burger LL, DeFazio RA, Wagenmaker ER, Moenter SM. Silveira MA, et al. Endocrinology. 2017 Feb 1;158(2):356-366. doi: 10.1210/en.2016-1771. Endocrinology. 2017. PMID: 27911605 Free PMC article. - Ovarian Androgens Maintain High GnRH Neuron Firing Rate in Adult Prenatally-Androgenized Female Mice.
Dulka EA, Burger LL, Moenter SM. Dulka EA, et al. Endocrinology. 2020 Jan 1;161(1):bqz038. doi: 10.1210/endocr/bqz038. Endocrinology. 2020. PMID: 31875912 Free PMC article. - Genetic dissection of the different roles of hypothalamic kisspeptin neurons in regulating female reproduction.
Wang L, Vanacker C, Burger LL, Barnes T, Shah YM, Myers MG, Moenter SM. Wang L, et al. Elife. 2019 Apr 4;8:e43999. doi: 10.7554/eLife.43999. Elife. 2019. PMID: 30946012 Free PMC article.
References
- Burger LL, Dalkin AC, Aylor KW, Haisenleder DJ, Marshall JC. GnRH pulse frequency modulation of gonadotropin subunit gene transcription in normal gonadotropes-assessment by primary transcript assay provides evidence for roles of GnRH and follistatin. Endocrinology. 2002;143:3243–3249. doi: 10.1210/en.2002-220216. - DOI - PubMed
- Burger LL, Haisenleder DJ, Aylor KW, Marshall JC. Regulation of Lhb and Egr1 gene expression by GNRH pulses in rat pituitaries is both c-Jun N-terminal kinase (JNK)- and extracellular signal-regulated kinase (ERK)-dependent. Biol Reprod. 2009;81:1206–1215. doi: 10.1095/biolreprod.109.079426. - DOI - PMC - PubMed
Publication types
MeSH terms
Substances
Grants and funding
- U54 HD028934/HD/NICHD NIH HHS/United States
- U54-HD28934/HD/NICHD NIH HHS/United States
- P50 HD028934/HD/NICHD NIH HHS/United States
- R01 HD034860/HD/NICHD NIH HHS/United States
- P30 DK020572/DK/NIDDK NIH HHS/United States
- R01 HD34860/HD/NICHD NIH HHS/United States
LinkOut - more resources
Full Text Sources
Other Literature Sources
Molecular Biology Databases


