Prediction of resistance development against drug combinations by collateral responses to component drugs - PubMed (original) (raw)
Prediction of resistance development against drug combinations by collateral responses to component drugs
Christian Munck et al. Sci Transl Med. 2014.
Abstract
Resistance arises quickly during chemotherapeutic selection and is particularly problematic during long-term treatment regimens such as those for tuberculosis, HIV infections, or cancer. Although drug combination therapy reduces the evolution of drug resistance, drug pairs vary in their ability to do so. Thus, predictive models are needed to rationally design resistance-limiting therapeutic regimens. Using adaptive evolution, we studied the resistance response of the common pathogen Escherichia coli to 5 different single antibiotics and all 10 different antibiotic drug pairs. By analyzing the genomes of all evolved E. coli lineages, we identified the mutational events that drive the differences in drug resistance levels and found that the degree of resistance development against drug combinations can be understood in terms of collateral sensitivity and resistance that occurred during adaptation to the component drugs. Then, using engineered E. coli strains, we confirmed that drug resistance mutations that imposed collateral sensitivity were suppressed in a drug pair growth environment. These results provide a framework for rationally selecting drug combinations that limit resistance evolution.
Copyright © 2014, American Association for the Advancement of Science.
Conflict of interest statement
Competing interests: The authors declare that they have no competing interests.
Figures
Fig. 1. Experimental setup
The in vitro evolution experiment was conducted in 24-well plates with drug gradients across the columns. The last column contained positive and negative controls. Every 20 hours, cells from the wells with the highest drug concentrations that displayed an OD600 >0.25 were diluted 1:40 into a freshly prepared drug gradient. Parallel-evolved lineages were inoculated across rows and labeled with the letters A, B, and C.
Fig. 2. Relative increases in IC90 values
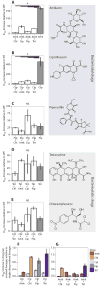
IC90 (means ± SEM, n = 3 biological replicates) of the evolved lineages relative to IC90 of the ancestral E. coli MG1655. (A to E) Data for lineages evolved to the single drugs Amk, Cip, Pip, Tet, and Chl, as well as lineages evolved to each of the 10 possible pairwise combinations. Only combinations containing either Amk (A) or Cip (B) showed significantly reduced relative increases in IC90 compared to the corresponding single-drug evolved lineages (*P < 0.05, ANOVA, followed by Tukey test). WT, wild type; NS, not significant. (F and G) Relative increase in IC90 for the individual components in Cip-containing combinations (F) and Amk-containing combinations (G) measured as relative increases in IC90 of the individual components in the drug pair evolved lineages divided by the relative IC90 increase in the single-drug evolved lineages (means ± SEM, n = 3 biological replicates). Only Amk-containing combinations limit resistance increase of both drugs in the drug pair.
Fig. 3. Increase in IC90 for drug pairs compared to individual components
(A to C) Drug pair IC90 increases relative to the IC90 increases of the slowest-evolving component (A), the fastest-evolving component (B), and the average of the two (C). Error bars depict SEMs. The IC90 increases for the drug pairs are not correlated to the increases for the component drugs (P > 0.05, Bonferroni-corrected Spearman correlation; n = 10).
Fig. 4. Drug interactions and evolution of resistance
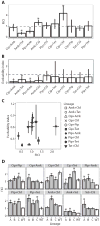
(A) Mean FICI of the various drug pairs tested against WT E. coli MG1655 (Materials and Methods). Error bars depict a 95% confidence interval (CI) (n = 3 biological replicates). Asterisks indicate a FICI significantly different from additivity (FICI = 1). (B) Evolvability index of the various drug pairs calculated as the average of the fold increase in IC90 for the individual drugs in a drug pair evolved lineage relative to the single-drug evolved lineages (Materials and Methods). Error bars depict 95% CI (n = 3 biological replicates). Asterisks indicate a significantly different level of resistance evolution relative to single-drug evolved lineages (evolvability index = 1). (C) Evolvability as a function of FICI. The plot shows that the evolvability index does not correlate with the FICI (P > 0.05, Spearman correlation; error bars depict SEMs). (D) Change in FICI during resistance evolution. Comparison of FICI for the WT MG1655 strain (white) and the three parallel evolved lineages (A, B, and C) for each drug pair (gray). Error bars depict SEMs. Asterisks indicate significant changes in FICI in the evolved lineages compared to the WT FICI (Student’s t test).
Fig. 5. Correlation between collateral IC90 change and evolvability
(A) Collateral resistance or sensitivity for the single-drug evolved lineages tested against the four drugs to which they had not been evolved. The figure shows the relative IC90 change calculated as IC90[drug A]drug B evolved/IC90[A]WT. Error bars depict SEMs (n = 3 biological replicates). For most lineages, collateral resistance is observed; however, the Amk-evolved lineages display a high degree of collateral sensitivity. (B) Correlation between the collateral IC90 changes in the single-drug evolved lineages and the evolvability indices of the drug pair evolved lineages. The mean collateral IC90 changes in the single-drug evolved lineages were calculated as {IC90[drug A]drug B evolved/IC90[drug A]WT + IC90[drug B]drug A evolved/IC90[drug B]WT}/2 (Materials and Methods). The evolvability index was calculated as {IC90[drug A]drug AB evolved/IC90[drug A]drug A evolved + IC90[drug B]drug AB evolved/IC90[drug B]drug B evolved}/2 (Materials and Methods). Triangles represent combinations that contained Amk, and circles represent combinations without Amk. Error bars depict SEMs (n = 3 biological replicates). (C) Mean evolvability indices of drug pairs containing Amk and drug pairs not containing Amk. Error bars represent SEMs across the various lineages. Amk-containing drug pairs evolve significantly less resistance than drug pairs without Amk, relative to their component drugs (*P < 0.05, Mann-Whitney test). (D) Average collateral IC90 changes for each pairwise combination of the single-drug evolved lineages, stratified by pairs with and without the Amk. Error bars represent SEMs (n = 3 biological replicates). The degree of collateral IC90 changes was significantly lower for combinations of single-drug evolved lineages that contained Amk (*P < 0.05, Mann-Whitney test).
Fig. 6. Sequencing the evolved lineages
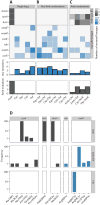
(A to C) Heat map depicting mutations (SNPs and INDELs) in the 45-endpoint sequenced lineages known to be involved in Amk and mar resistance. Mutations in the single-drug evolved lineages (A), mutations found in lineages evolved to drug pairs without Amk (B), and lineages evolved to drug pairs with Amk (C). The three parallel-evolved lineages are collapsed by drug condition. The gene targets are grouped by the phenotypic characteristics (gray, Amk-specific mutations; blue, mutations known to confer the mar phenotype). The legend indicates the number of parallel lineages that contained a mutation in the specific target. The bars below each drug condition summarizes the mar- and Amk-specific mutations, respectively. (D) Population frequency sequencing. Total DNA from the populations evolved to Amk, Chl, and Amk + Chl (drug conditions are noted in the vertical strip text) was sequenced, and frequencies of the individual SNPs/INDELs were calculated (loci are noted in the horizontal strip text). SNPs/INDELs in genes linked to Amk resistance (fusA, sbmA, and cpxA) were fixed in the Amk-evolved population but could not be fixed when Chl was present. In contrast, SNPs in marR were observed in both the Chl and Amk + Chl evolved lineages. These findings corroborate the single-isolate sequencing results.
Fig. 7. Competition experiment
(A to E) Competition assays between mutant and WT alleles. For each competition experiment, the ratios of mutant to WT alleles after competitive growth in subinhibitory concentrations of either single drugs or drug pairs (listed below each panel) are reported relative to the ratio in antibiotic-free growth medium (means ± SEM, n = 3 biological replicates). Alleles are cpxA, fusA, sbmA, gyrA, and marR, for (A) to (E), respectively. Gray fill indicates mutations found to give Amk resistance. Blue fill indicates mutations known to confer the mar phenotype. White fill indicates mutations that confer Cip resistance.
Fig. 8. Impact of collateral IC90 changes on the evolution of drug resistance
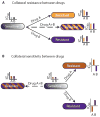
(A) If two drugs display collateral resistance (such as Tet and Chl), a combination of the two drugs will not effectively reduce resistance development, because they both will select for the same mutational profile. (B) In contrast, if the two drugs display collateral sensitivity (such as Amk and Chl), a combination of the two will be effective at reducing evolution of resistance because of suppressed fixation of resistance mutations in the population.
Similar articles
- Quantifying the Determinants of Evolutionary Dynamics Leading to Drug Resistance.
Chevereau G, Dravecká M, Batur T, Guvenek A, Ayhan DH, Toprak E, Bollenbach T. Chevereau G, et al. PLoS Biol. 2015 Nov 18;13(11):e1002299. doi: 10.1371/journal.pbio.1002299. eCollection 2015. PLoS Biol. 2015. PMID: 26581035 Free PMC article. - Acceleration and suppression of resistance development by antibiotic combinations.
Suzuki S, Horinouchi T, Furusawa C. Suzuki S, et al. BMC Genomics. 2017 Apr 26;18(1):328. doi: 10.1186/s12864-017-3718-2. BMC Genomics. 2017. PMID: 28446153 Free PMC article. - Use of collateral sensitivity networks to design drug cycling protocols that avoid resistance development.
Imamovic L, Sommer MO. Imamovic L, et al. Sci Transl Med. 2013 Sep 25;5(204):204ra132. doi: 10.1126/scitranslmed.3006609. Sci Transl Med. 2013. PMID: 24068739 - [Analysis of Drug Resistance Using Experimental Evolution].
Furusawa C. Furusawa C. Yakugaku Zasshi. 2017;137(4):373-376. doi: 10.1248/yakushi.16-00235-1. Yakugaku Zasshi. 2017. PMID: 28381708 Review. Japanese. - Allogenous Selection of Mutational Collateral Resistance: Old Drugs Select for New Resistance Within Antibiotic Families.
Baquero F, Martínez JL, Novais Â, Rodríguez-Beltrán J, Martínez-García L, Coque TM, Galán JC. Baquero F, et al. Front Microbiol. 2021 Oct 22;12:757833. doi: 10.3389/fmicb.2021.757833. eCollection 2021. Front Microbiol. 2021. PMID: 34745065 Free PMC article. Review.
Cited by
- Collateral sensitivity of antibiotic-resistant microbes.
Pál C, Papp B, Lázár V. Pál C, et al. Trends Microbiol. 2015 Jul;23(7):401-7. doi: 10.1016/j.tim.2015.02.009. Epub 2015 Mar 25. Trends Microbiol. 2015. PMID: 25818802 Free PMC article. Review. - The evolution of antibiotic resistance is associated with collateral drug phenotypes in Mycobacterium tuberculosis.
Waller NJE, Cheung CY, Cook GM, McNeil MB. Waller NJE, et al. Nat Commun. 2023 Mar 18;14(1):1517. doi: 10.1038/s41467-023-37184-7. Nat Commun. 2023. PMID: 36934122 Free PMC article. - Dominant resistance and negative epistasis can limit the co-selection of de novo resistance mutations and antibiotic resistance genes.
Porse A, Jahn LJ, Ellabaan MMH, Sommer MOA. Porse A, et al. Nat Commun. 2020 Mar 5;11(1):1199. doi: 10.1038/s41467-020-15080-8. Nat Commun. 2020. PMID: 32139686 Free PMC article. - Convergent phenotypic evolution towards fosfomycin collateral sensitivity of Pseudomonas aeruginosa antibiotic-resistant mutants.
Laborda P, Martínez JL, Hernando-Amado S. Laborda P, et al. Microb Biotechnol. 2022 Feb;15(2):613-629. doi: 10.1111/1751-7915.13817. Epub 2021 May 7. Microb Biotechnol. 2022. PMID: 33960651 Free PMC article. - Interaction Tolerance Detection Test for Understanding the Killing Efficacy of Directional Antibiotic Combinations.
Liu JF, Gefen O, Zhang ZY, Liu MM, Bar-Meir M, Balaban NQ. Liu JF, et al. mBio. 2021 Feb 22;13(1):e0000422. doi: 10.1128/mbio.00004-22. Epub 2022 Feb 15. mBio. 2021. PMID: 35164563 Free PMC article.
References
- Nordmann P, Cuzon G, Naas T. The real threat of Klebsiella pneumoniae carbapenemase-producing bacteria. Lancet Infect Dis. 2009;9:228–236. - PubMed
- Donald PR, van Helden PD. The global burden of tuberculosis—Combating drug resistance in difficult times. N Engl J Med. 2009;360:2393–2395. - PubMed
- Mitchison DA. How drug resistance emerges as a result of poor compliance during short course chemotherapy for tuberculosis. Int J Tuberc Lung Dis. 1998;2:10–15. - PubMed
- Clavel F, Hance AJ. HIV drug resistance. N Engl J Med. 2004;350:1023–1035. - PubMed
Publication types
MeSH terms
Substances
LinkOut - more resources
Full Text Sources
Other Literature Sources
Medical


