Global disease monitoring and forecasting with Wikipedia - PubMed (original) (raw)
Global disease monitoring and forecasting with Wikipedia
Nicholas Generous et al. PLoS Comput Biol. 2014.
Abstract
Infectious disease is a leading threat to public health, economic stability, and other key social structures. Efforts to mitigate these impacts depend on accurate and timely monitoring to measure the risk and progress of disease. Traditional, biologically-focused monitoring techniques are accurate but costly and slow; in response, new techniques based on social internet data, such as social media and search queries, are emerging. These efforts are promising, but important challenges in the areas of scientific peer review, breadth of diseases and countries, and forecasting hamper their operational usefulness. We examine a freely available, open data source for this use: access logs from the online encyclopedia Wikipedia. Using linear models, language as a proxy for location, and a systematic yet simple article selection procedure, we tested 14 location-disease combinations and demonstrate that these data feasibly support an approach that overcomes these challenges. Specifically, our proof-of-concept yields models with r2 up to 0.92, forecasting value up to the 28 days tested, and several pairs of models similar enough to suggest that transferring models from one location to another without re-training is feasible. Based on these preliminary results, we close with a research agenda designed to overcome these challenges and produce a disease monitoring and forecasting system that is significantly more effective, robust, and globally comprehensive than the current state of the art.
Conflict of interest statement
The authors have declared that no competing interests exist.
Figures
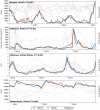
Figure 1. Selected successful model nowcasts.
These graphs show official epidemiological data and nowcast model estimate (left Y axis) with traffic to the five most-correlated Wikipedia articles (right Y axis) over the 3 year study periods. The Wikipedia time series are individually self-normalized. Graphs for the four remaining successful contexts (dengue in Thailand, influenza in Japan, influenza in Thailand, and tuberculosis in Thailand) are included in the supplemental data file S1.
Figure 2. Forecasting effectiveness for selected successful models.
This figure shows model r 2 compared to temporal offset in days: positive offsets are forecasting, zero is nowcasting (marked with a dotted line), and negative offsets are anti-forecasting. As above, figures for the four successful contexts not included here are in the supplemental data S1.
Figure 3. Nowcast attempts where the model was unable to capture a meaningful pattern in official data.
Figure 4. Nowcast attempts with poor performance due to unfavorable signal-to-noise ratio.
Similar articles
- Data-model fusion to better understand emerging pathogens and improve infectious disease forecasting.
LaDeau SL, Glass GE, Hobbs NT, Latimer A, Ostfeld RS. LaDeau SL, et al. Ecol Appl. 2011 Jul;21(5):1443-60. doi: 10.1890/09-1409.1. Ecol Appl. 2011. PMID: 21830694 Free PMC article. - Forecasting the 2013-2014 influenza season using Wikipedia.
Hickmann KS, Fairchild G, Priedhorsky R, Generous N, Hyman JM, Deshpande A, Del Valle SY. Hickmann KS, et al. PLoS Comput Biol. 2015 May 14;11(5):e1004239. doi: 10.1371/journal.pcbi.1004239. eCollection 2015 May. PLoS Comput Biol. 2015. PMID: 25974758 Free PMC article. - Epidemic Forecasting is Messier Than Weather Forecasting: The Role of Human Behavior and Internet Data Streams in Epidemic Forecast.
Moran KR, Fairchild G, Generous N, Hickmann K, Osthus D, Priedhorsky R, Hyman J, Del Valle SY. Moran KR, et al. J Infect Dis. 2016 Dec 1;214(suppl_4):S404-S408. doi: 10.1093/infdis/jiw375. J Infect Dis. 2016. PMID: 28830111 Free PMC article. Review. - Digital disease detection: A systematic review of event-based internet biosurveillance systems.
O'Shea J. O'Shea J. Int J Med Inform. 2017 May;101:15-22. doi: 10.1016/j.ijmedinf.2017.01.019. Epub 2017 Feb 8. Int J Med Inform. 2017. PMID: 28347443 Free PMC article. Review.
Cited by
- Using digital surveillance tools for near real-time mapping of the risk of infectious disease spread.
Bhatia S, Lassmann B, Cohn E, Desai AN, Carrion M, Kraemer MUG, Herringer M, Brownstein J, Madoff L, Cori A, Nouvellet P. Bhatia S, et al. NPJ Digit Med. 2021 Apr 16;4(1):73. doi: 10.1038/s41746-021-00442-3. NPJ Digit Med. 2021. PMID: 33864009 Free PMC article. - Inclusion of environmentally themed search terms improves Elastic net regression nowcasts of regional Lyme disease rates.
Kontowicz E, Brown G, Torner J, Carrel M, Baker KK, Petersen CA. Kontowicz E, et al. PLoS One. 2022 Mar 10;17(3):e0251165. doi: 10.1371/journal.pone.0251165. eCollection 2022. PLoS One. 2022. PMID: 35271589 Free PMC article. - Optimal multi-source forecasting of seasonal influenza.
Ertem Z, Raymond D, Meyers LA. Ertem Z, et al. PLoS Comput Biol. 2018 Sep 4;14(9):e1006236. doi: 10.1371/journal.pcbi.1006236. eCollection 2018 Sep. PLoS Comput Biol. 2018. PMID: 30180212 Free PMC article. - Identifying Protective Health Behaviors on Twitter: Observational Study of Travel Advisories and Zika Virus.
Daughton AR, Paul MJ. Daughton AR, et al. J Med Internet Res. 2019 May 13;21(5):e13090. doi: 10.2196/13090. J Med Internet Res. 2019. PMID: 31094347 Free PMC article. - Disease surveillance based on Internet-based linear models: an Australian case study of previously unmodeled infection diseases.
Rohart F, Milinovich GJ, Avril SM, Lê Cao KA, Tong S, Hu W. Rohart F, et al. Sci Rep. 2016 Dec 20;6:38522. doi: 10.1038/srep38522. Sci Rep. 2016. PMID: 27994231 Free PMC article.
References
- Lopez AD, Mathers CD, Ezzati M, Jamison DT, Murray CJ (2006) Global and regional burden of disease and risk factors, 2001: Systematic analysis of population health data. The Lancet 367: 1747–1757. - PubMed
- Thompson M, Shay D, Zhou H, Bridges C, Cheng P, et al. (2010) Estimates of deaths associated with seasonal influenza — United States, 1976–2007. Morbidity and Mortality Weekly Report 59 - PubMed
- Molinari NAM, Ortega-Sanchez IR, Messonnier ML, Thompson WW, Wortley PM, et al. (2007) The annual impact of seasonal influenza in the US: Measuring disease burden and costs. Vaccine 25: 5086–5096. - PubMed
- Centers for Disease Control and Prevention (CDC) (2012). Overview of influenza surveillance in the United States. URL http://www.cdc.gov/flu/pdf/weekly/overview.pdf.
Publication types
MeSH terms
LinkOut - more resources
Full Text Sources
Other Literature Sources
Medical


