Comparative analysis of discrete exosome fractions obtained by differential centrifugation - PubMed (original) (raw)
Comparative analysis of discrete exosome fractions obtained by differential centrifugation
Dennis K Jeppesen et al. J Extracell Vesicles. 2014.
Abstract
Background: Cells release a mixture of extracellular vesicles, amongst these exosomes, that differ in size, density and composition. The standard isolation method for exosomes is centrifugation of fluid samples, typically at 100,000×g or above. Knowledge of the effect of discrete ultracentrifugation speeds on the purification from different cell types, however, is limited.
Methods: We examined the effect of applying differential centrifugation g-forces ranging from 33,000×g to 200,000×g on exosome yield and purity, using 2 unrelated human cell lines, embryonic kidney HEK293 cells and bladder carcinoma FL3 cells. The fractions were evaluated by nanoparticle tracking analysis (NTA), total protein quantification and immunoblotting for CD81, TSG101, syntenin, VDAC1 and calreticulin.
Results: NTA revealed the lowest background particle count in Dulbecco's Modified Eagle's Medium media devoid of phenol red and cleared by 200,000×g overnight centrifugation. The centrifugation tube fill level impacted the sedimentation efficacy. Comparative analysis by NTA, protein quantification, and detection of exosomal and contamination markers identified differences in vesicle size, concentration and composition of the obtained fractions. In addition, HEK293 and FL3 vesicles displayed marked differences in sedimentation characteristics. Exosomes were pelleted already at 33,000×g, a g-force which also removed most contaminating microsomes. Optimal vesicle-to-protein yield was obtained at 67,000×g for HEK293 cells but 100,000×g for FL3 cells. Relative expression of exosomal markers (TSG101, CD81, syntenin) suggested presence of exosome subpopulations with variable sedimentation characteristics.
Conclusions: Specific g-force/k factor usage during differential centrifugation greatly influences the purity and yield of exosomes. The vesicle sedimentation profile differed between the 2 cell lines.
Keywords: differential centrifugation; exosomes; extracellular vesicles; k factor; microvesicles; nanoparticle tracking analysis.
Figures
Fig. 1
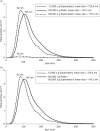
Size profile of comparison of FL3 particles in supernatants and pellet. FL3 cells were cultured in DMEM without phenol red but with serum depleted for bovine exosomes by 200,000×g ultracentrifugation for 16 hours. (a) FL3 cell-conditioned media (CCM) was harvested and first pre-cleared by 400–15,000×g centrifugation steps and then subjected to a single ultracentrifugation step at 100,000×g. Supernatants and pellet were diluted in particle-free PBS and the particles present measured using the NanoSight NTA system. Average plots of the overall size distribution of particles are based on 5 repeat measurements. (b) Plots of size distribution of the input 15,000×g supernatant and the sum of the 100,000×g pellet and supernatant output.
Fig. 2
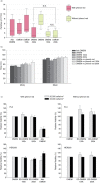
Analysis of particles present in different media types and effect on viability of cell growth. (a) Media samples of DMEM with either 8% foetal bovine serum or 8% serum depleted for bovine exosomes (100k and 200k, serum-containing medium cleared of bovine exosomes by 16 hours ultracentrifugation at 100,000×g or 200,000×g of 20% serum solutions, respectively) with and without addition of phenol red, as well as Advanced DMEM, were analysed using NTA. All media types were centrifuged at 15,000×g before analysis. Measurements of particle concentration were made in triplicate for each of the samples. Data are expressed as mean±s.e.m. (n=12 per group generated from 3 independent experiments). P-value for difference between groups was determined by the Friedman test while p-values between pairs of groups were determined by Wilcoxon signed rank tests and corrected for multiple comparisons by the Holm–Bonferroni procedure. N.S., not significant. (b) The mode and mean size of particle in media measured by NTA. (c) The viability of FL3 cells and HEK293 cells grown in various types of DMEM media with (left) or without (right) phenol red at seeding densities of 20,000 or 33,000 cells/cm2 were examined by MTT assays. Data are expressed as mean±s.e.m. (for FL3 n=3 and for HEK293 n=4 per group generated from 3 independent experiments).
Fig. 3
Differential ultracentrifugation experimental schemes. (a) Parallel differential ultracentrifugation. Harvested FL3 and HEK293 CCM was subjected first to a series of pre-clearing centrifugation steps of increasing relative centrifugal force (RCF) (0.4–15k, Table 1) with the resulting supernatant in each step being used as the input for next step while the pellets were subjected to lysis before protein determination and immunoblot analysis. The pre-cleared CCM was split into aliquots of 6 equal volumes and each aliquot subjected to ultracentrifugation at a RCF ranging from 33k to 200k (Table 1). Samples of supernatant were taken for NTA measurements while the pellets were either resuspended in particle free-PBS or subjected to lysis before protein determination and immunoblot analysis. (b) Serial differential ultracentrifugation. Pre-cleared CCM was subjected to a series of ultracentrifugation steps of increasing RCF from 33k to 200k (Table 1) with the resulting supernatant in each step being used as the input for next step. Samples of supernatant were taken for NTA measurements while the pellets were subjected to lysis before protein determination and immunoblot analysis.
Fig. 4
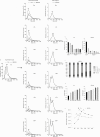
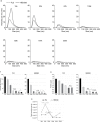
Parallel differential ultracentrifugation. (a) Pre-cleared FL3 and HEK293 CCM supernatants (15k), and supernatants and pellets generated by ultracentrifugation steps (33–200k) were diluted in particle-free PBS and the particles present measured using the NanoSight NTA system. Average plots of the overall size distribution of particles are based on 5 repeat measurements and represent the profile of particles present in the supernatant after the indicated ultracentrifugation step (supernatant, left) or in the resulting sedimentation pellet (Pellet, right). (b) Quantification by NTA of particles present in supernatants generated from pre-cleared CCM harvested from FL3 (left) and HEK293 (right) cells, and subjected to parallel ultracentrifugation steps. Data are expressed as mean±s.e.m. (n=5 per group), p-value for overall difference between groups was determined by repeated measures ANOVA (Greenhouse-Geisser corrected) and p-values between pairs of groups were determined by Student's paired t-tests with correction for multiple comparisons by the Holm–Bonferroni procedure. *p<0.05; **p<0.0001; N.S., not significant. (c) Population of particles of defined size ranges after depletion of HEK293 CCM by ultracentrifugation. The size of particles was measured by NTA in sedimentation pellets after ultracentrifugation steps of relative centrifugal force (RCF) from 33k to 200k. The fraction of the total population in the size ranges 1–100nm, 101–200 nm, 201–300 nm and 301+ nm was plotted. (d) Quantification of protein in sedimentation pellets generated by 33k to 200k parallel ultracentrifugation steps and solubilization in equal volumes of lysis buffer. Data are expressed as mean±s.e.m. (n=12 per group), p-value for overall difference between groups was determined by repeated measures ANOVA (Greenhouse–Geisser corrected) and p-values between pairs of groups were determined by Student's paired t-tests with correction for multiple comparisons by the Holm–Bonferroni procedure. *p<0.05; N.S., not significant. (e) The number of pelleted particles was calculated from the input and output supernatants, and the ratio of particles per µg of protein pelleted after parallel ultracentrifugation (33–200k) was plotted. Data are expressed as mean±s.e.m. (n=6 per group), p-value for overall difference between groups was determined by repeated measures ANOVA (Greenhouse–Geisser corrected) and p-values between pairs of groups were determined by Student's paired t-tests with correction for multiple comparisons by the Holm–Bonferroni procedure. *p<0.05. Reported statistical significance is relative to the maxima (67k for HEK293 and 100k for FL3).
Fig. 5
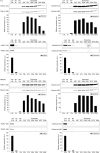
Immunoblot analysis of TSG101, syntenin, calreticulin and VDAC1 expression in sedimentation pellets after centrifugation at speeds from 0.4k to 200k. An equal amount of total protein (10 µg) was loaded in each well of the gel. Membranes were subjected to long exposures (LE) and short exposures (SE), and the relative levels of expression were assessed by densitometry quantification of the SE blots using Image J software. Because equal amounts of total protein were loaded in each lane, the intensity of the TSG101 and syntenin signals are proportional to the enrichment of exosomal protein in the sample while the intensity of VDAC1 and calreticulin are proportional to the purity of the samples in regard to mitochondrial and ER/microsome contamination, respectively. AB, apoptotic bleb; MV, microvesicle; a.u., arbitrary units.
Fig. 6
Serial differential ultracentrifugation. (a) Pre-cleared FL3 and HEK293 CCM supernatants (15k) and supernatants generated by a series of 33–200k ultracentrifugation steps (Table 1) were diluted in particle-free PBS and the particles present measured using the NanoSight NTA system. Data from 2 separate experiments with 5 repeat measurements each for both cell lines was used to generate average plots of the overall size distribution of particles. (b) Quantification by NTA of particles present in supernatants generated from CCM harvested from FL3 (left) and HEK293 (right) cells and subjected to serial centrifugation steps. Data are expressed as mean±s.e.m. (n=10 per group), p-value for overall difference between groups was determined by repeated measures ANOVA (Greenhouse–Geisser corrected) and p-values between pairs of groups were determined by Student's paired t-tests with correction for multiple comparisons by the Holm–Bonferroni procedure. *p<0.05; **p<0.0001; N.S., not significant. (c) Quantification of protein in sedimentation pellets generated by serial centrifugation steps and solubilization in equal volumes of lysis buffer. Data are expressed as mean±s.e.m. (n=12 per group), p-value for overall difference between groups was determined by repeated measures ANOVA (Greenhouse–Geisser corrected) and p-values between pairs of groups were determined by Student's paired t-tests with correction for multiple comparisons by the Holm–Bonferroni procedure. *p<0.05; N.S., not significant. (d) The number of pelleted particles was calculated from the input and output supernatants, and the ratio of particles per µg of protein pelleted after serial depletion of pre-cleared FL3 and HEK293 CCM by ultracentrifugation (33–200k) was plotted. Data are expressed as mean±s.e.m. (n=6 per group), p-value for overall difference between groups was determined by repeated measures ANOVA (Greenhouse–Geisser corrected) and p-values between pairs of groups were determined by Student's paired t-tests with correction for multiple comparisons by the Holm–Bonferroni procedure. *p<0.05. Reported statistical significance is relative to the maxima (67k for HEK293 and 100k for FL3).
Fig. 7
Immunoblot analysis of CD81, TSG101, syntenin and calreticulin expression after ultracentrifugation of serially depleted CCM. Equal volumes of sample was loaded in each lane corresponding to equivalent fractions of the total samples. Membranes were subjected to long exposures (LE) and short exposures (SE), and the relative levels of expression were assessed by densitometry quantification of the SE blots using Image J software with or without normalization to the quantity of protein in each lane. The relative levels of expression for the 33k centrifugation step were set as 100. Note that for syntenin the LE reveals the presence of the protein after the 167k and 200k steps but complete saturation of the bands for the lower speed centrifugation steps prevents accurate densitometry. a.u., arbitrary units.
Similar articles
- Isolation of syncytiotrophoblast microvesicles and exosomes and their characterisation by multicolour flow cytometry and fluorescence Nanoparticle Tracking Analysis.
Dragovic RA, Collett GP, Hole P, Ferguson DJ, Redman CW, Sargent IL, Tannetta DS. Dragovic RA, et al. Methods. 2015 Oct 1;87:64-74. doi: 10.1016/j.ymeth.2015.03.028. Epub 2015 Apr 3. Methods. 2015. PMID: 25843788 Free PMC article. - Microvesicles preparation from mesenchymal stem cells.
Rad F, Pourfathollah AA, Yari F, Mohammadi S, Kheirandish M. Rad F, et al. Med J Islam Repub Iran. 2016 Jul 16;30:398. eCollection 2016. Med J Islam Repub Iran. 2016. PMID: 27579288 Free PMC article. - A novel population of extracellular vesicles smaller than exosomes promotes cell proliferation.
Lee SS, Won JH, Lim GJ, Han J, Lee JY, Cho KO, Bae YK. Lee SS, et al. Cell Commun Signal. 2019 Aug 15;17(1):95. doi: 10.1186/s12964-019-0401-z. Cell Commun Signal. 2019. PMID: 31416445 Free PMC article. - Caco-2 cells infected with rotavirus release extracellular vesicles that express markers of apoptotic bodies and exosomes.
Bautista D, Rodríguez LS, Franco MA, Angel J, Barreto A. Bautista D, et al. Cell Stress Chaperones. 2015 Jul;20(4):697-708. doi: 10.1007/s12192-015-0597-9. Epub 2015 May 15. Cell Stress Chaperones. 2015. PMID: 25975376 Free PMC article. - An improvised one-step sucrose cushion ultracentrifugation method for exosome isolation from culture supernatants of mesenchymal stem cells.
Gupta S, Rawat S, Arora V, Kottarath SK, Dinda AK, Vaishnav PK, Nayak B, Mohanty S. Gupta S, et al. Stem Cell Res Ther. 2018 Jul 4;9(1):180. doi: 10.1186/s13287-018-0923-0. Stem Cell Res Ther. 2018. PMID: 29973270 Free PMC article.
Cited by
- Exosomes: New Insights into the Pathogenesis of Metabolic Syndrome.
Wang N, Li J, Hu Z, Ngowi EE, Yan B, Qiao A. Wang N, et al. Biology (Basel). 2023 Dec 1;12(12):1480. doi: 10.3390/biology12121480. Biology (Basel). 2023. PMID: 38132306 Free PMC article. Review. - Recent advances and challenges in the recovery and purification of cellular exosomes.
Ayala-Mar S, Donoso-Quezada J, Gallo-Villanueva RC, Perez-Gonzalez VH, González-Valdez J. Ayala-Mar S, et al. Electrophoresis. 2019 Dec;40(23-24):3036-3049. doi: 10.1002/elps.201800526. Epub 2019 Aug 12. Electrophoresis. 2019. PMID: 31373715 Free PMC article. Review. - The role of extracellular vesicles in animal reproduction and diseases.
Gurunathan S, Kang MH, Song H, Kim NH, Kim JH. Gurunathan S, et al. J Anim Sci Biotechnol. 2022 Jun 10;13(1):62. doi: 10.1186/s40104-022-00715-1. J Anim Sci Biotechnol. 2022. PMID: 35681164 Free PMC article. Review. - Review on Strategies and Technologies for Exosome Isolation and Purification.
Chen J, Li P, Zhang T, Xu Z, Huang X, Wang R, Du L. Chen J, et al. Front Bioeng Biotechnol. 2022 Jan 5;9:811971. doi: 10.3389/fbioe.2021.811971. eCollection 2021. Front Bioeng Biotechnol. 2022. PMID: 35071216 Free PMC article. Review. - Affinity-based isolation of extracellular vesicles and the effects on downstream molecular analysis.
Ströhle G, Gan J, Li H. Ströhle G, et al. Anal Bioanal Chem. 2022 Oct;414(24):7051-7067. doi: 10.1007/s00216-022-04178-1. Epub 2022 Jun 23. Anal Bioanal Chem. 2022. PMID: 35732746 Review.
References
- Cocucci E, Racchetti G, Meldolesi J. Shedding microvesicles: artefacts no more. Trends Cell Biol. 2009;19:43–51. - PubMed
- Thery C, Ostrowski M, Segura E. Membrane vesicles as conveyors of immune responses. Nat Rev Immunol. 2009;9:581–93. - PubMed
- Simpson RJ, Lim JW, Moritz RL, Mathivanan S. Exosomes: proteomic insights and diagnostic potential. Expert Rev Proteomics. 2009;6:267–83. - PubMed
- Vlassov AV, Magdaleno S, Setterquist R, Conrad R. Exosomes: current knowledge of their composition, biological functions, and diagnostic and therapeutic potentials. Biochim Biophys Acta. 2012;1820:940–8. - PubMed
- Ostenfeld MS. Cellular disposal of miR23b by RAB27-dependent exosome release is linked to acquisition of metastatic properties. Cancer Res. 2014;74:5758–71. - PubMed
LinkOut - more resources
Full Text Sources
Other Literature Sources
Research Materials
