Integrated genomic characterization of papillary thyroid carcinoma - PubMed (original) (raw)
Integrated genomic characterization of papillary thyroid carcinoma
Cancer Genome Atlas Research Network. Cell. 2014.
Abstract
Papillary thyroid carcinoma (PTC) is the most common type of thyroid cancer. Here, we describe the genomic landscape of 496 PTCs. We observed a low frequency of somatic alterations (relative to other carcinomas) and extended the set of known PTC driver alterations to include EIF1AX, PPM1D, and CHEK2 and diverse gene fusions. These discoveries reduced the fraction of PTC cases with unknown oncogenic driver from 25% to 3.5%. Combined analyses of genomic variants, gene expression, and methylation demonstrated that different driver groups lead to different pathologies with distinct signaling and differentiation characteristics. Similarly, we identified distinct molecular subgroups of BRAF-mutant tumors, and multidimensional analyses highlighted a potential involvement of oncomiRs in less-differentiated subgroups. Our results propose a reclassification of thyroid cancers into molecular subtypes that better reflect their underlying signaling and differentiation properties, which has the potential to improve their pathological classification and better inform the management of the disease.
Figures
Figure 1. Landscape of Genomic Alterations in 402 Papillary Thyroid Carcinomas
(A) Mutation density (mutations/Mb) across the cohort. (B) Tumor purity, patient age, gender, history of radiation exposure, risk of recurrence, MACIS score, histological type, and BRS score. (C) Number and frequency of recurrent mutations in genes (left) ranked by MutSig significance (right), gene-sample matrix of mutations (middle) with TERT promoter mutations (bottom). (D) Number and frequency of fusion events (left), gene-sample matrix of fusions across the cohort (middle). (E) Number and frequency of SCNAs (left), chromosome-sample matrix of SCNAs across the cohort (middle) with focal deletions in BRAF and PTEN (bottom), GISTIC2 significance (right). (F) Driving variant types across the cohort. Samples were sorted by driving variant type with dark matter on the left. See also Figures S1, S2, S3, S4 and Tables S1, S2, S3, S4A, and S5A,B,E.
Figure 2. TERT Promoter Mutations and Clonality Assessment of Driver Mutations
(A-C) Association of TERT promoter mutations with (A) risk of recurrence, (B) MACIS score, and (C) thyroid differentiation score (TDS). See also Table S2. (D) Mutation cancer cell fraction distribution. The majority of all mutations, including driver mutations BRAF, NRAS, HRAS, KRAS, and EIF1AX, have a calculated cancer cell fraction close to 1.0, indicating their presence all tumor cells.
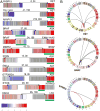
Figure 3. Candidate “Driver” Gene Fusions in Papillary Thyroid Carcinoma
(A) RNA expression fusion plots for representative novel candidate genes involving RET, BRAF, ALK, NTRK3 and LTK fusions. Each gene in the fusion plot is drawn 5′ to 3′, exon specific relative expression data is represented with low (blue) and high expression (red), and the kinase domain is mapped with a green box. The pairs of numbers across the links indicate the number of split reads and paired-end supporting reads from RNA-seq. (B) Circos plots (
) of RET, BRAF and NTRK3 fusions. Red links represent recurrent fusions, black non-recurrent. See also Figures S3F and Table S5B.
Figure 4. The _BRAF_V600E-RAS Score
(A) Thyroid samples (n=391) were ranked by _BRAF_V600E-RAS score (BRS), with _BRAF_V600E-like and _RAS_-like samples having negative (-1 to 0) and positive scores (0 to 1), respectively. The _BRAF_V600E-RAS score is strongly associated with: (B) driver mutation status; (C) thyroid differentiation score (TDS); (D) single data-type clusters and (E) histology and follicular fraction. The _RAS_-like samples (normalized score > 0, in red on the top bar) consistently emerged as a distinct subgroup characterized by a higher TDS. See also Figures S6 and S7A, B and Tables S2 and S4B.
Figure 5. Role of Thyroid Differentiation in Papillary Thyroid Carcinomas
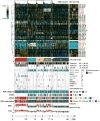
Thyroid Differentiation Score (TDS) across the cohort with tumors sorted by driver mutation and TDS. Below TDS are the _BRAF_V600E-RAS score (BRS), ERK signature, histological type, MACIS score, risk of recurrence, driver mutations, gene expression data for nine thyroid genes used to derive the TDS (TG, TPO, SLC26A4 (pendrin), SLC5A5 (Na/I symporter), SLC5A8 (apical iodide transporter), DIO1, DIO2, DUOX1, DUOX2), four selected mRNAs correlated to TDS, and three selected miRs correlated to TDS. Featured mRNA (except for 16 thyroid genes) and miRNA genes were selected based on Spearman correlation to TDS in the _BRAF_V600E cohort (*) and the full cohort (**) (see Supplement). See also Figures S7C-J and Table S5F.
Figure 6. Downstream Signaling of BVL and RL PTCs
(A) MAPK and PI3K pathways are differentially activated in the BVL and RL PTCs. (B) _BRAF_V600E-mutated cases show robust activation of MAPK signaling resulting in higher output of the ERK transcriptional program, represented in particular by DUSP (DUSP4, 5 and 6) mRNAs. This may be due to insensitivity of BRAFV600E to ERK inhibitory feedback. By contrast, _RAS_-like tumors activated both MAPK and PI3K/AKT signaling, as shown by higher pAKT levels in these tumors. The mechanism by which _RAS_-like tumors activated MAPK signaling was distinct from that of _BRAF_V600E tumors, as they had higher CRAF phosphorylation, consistent with engagement of RAF dimers. Paradoxically, RL-PTCs had higher phosphorylation of the ERK substrate p90RSK, which was associated with mTOR activation, likely through phosphorylation and consequent inhibition of TSC2. RL-PTCs also showed activation of an anti-apoptotic program, characterized by S112-BAD phosphorylation (a target of P90RSK) and BCL2 over-expression. See also Figures S8 and Tables S4B,F.
Figure 7. Unsupervised clusters for miRNA-seq data
Heatmap showing discriminatory miRs (5p or 3p mature strands) with the largest 6% of metagene matrix scores (see Supplement), as well as miR-204-5p, 221-3p and 222-3p, which were highlighted in correlations to BRS and TDS scores (see Figure S10D). The scalebar shows log2 normalized (reads-per-million, RPM), median-centered miR abundance. miR names in red are discussed in the text. Gray vertical lines in the clinical information tracks mark samples without clinical data, and in the mutation tracks gray lines identify samples without sequence data. See also Figures S9, S10 and Tables S4C,D,E, 5G, 6.
Comment in
- Genetics: The Cancer Genome Atlas maps papillary thyroid cancer.
Killock D. Killock D. Nat Rev Clin Oncol. 2014 Dec;11(12):681. doi: 10.1038/nrclinonc.2014.193. Epub 2014 Nov 11. Nat Rev Clin Oncol. 2014. PMID: 25384944 No abstract available. - Genetics: The genomic landscape of papillary thyroid carcinoma.
Santoro M, Melillo RM. Santoro M, et al. Nat Rev Endocrinol. 2015 Mar;11(3):133-4. doi: 10.1038/nrendo.2014.209. Epub 2014 Nov 25. Nat Rev Endocrinol. 2015. PMID: 25421371 No abstract available.
Similar articles
- New somatic mutations and WNK1-B4GALNT3 gene fusion in papillary thyroid carcinoma.
Costa V, Esposito R, Ziviello C, Sepe R, Bim LV, Cacciola NA, Decaussin-Petrucci M, Pallante P, Fusco A, Ciccodicola A. Costa V, et al. Oncotarget. 2015 May 10;6(13):11242-51. doi: 10.18632/oncotarget.3593. Oncotarget. 2015. PMID: 25803323 Free PMC article. - NTRK fusion oncogenes in pediatric papillary thyroid carcinoma in northeast United States.
Prasad ML, Vyas M, Horne MJ, Virk RK, Morotti R, Liu Z, Tallini G, Nikiforova MN, Christison-Lagay ER, Udelsman R, Dinauer CA, Nikiforov YE. Prasad ML, et al. Cancer. 2016 Apr 1;122(7):1097-107. doi: 10.1002/cncr.29887. Epub 2016 Jan 19. Cancer. 2016. PMID: 26784937 - A Comprehensive Characterization of Mitochondrial Genome in Papillary Thyroid Cancer.
Su X, Wang W, Ruan G, Liang M, Zheng J, Chen Y, Wu H, Fahey TJ, Guan M, Teng L. Su X, et al. Int J Mol Sci. 2016 Oct 10;17(10):1594. doi: 10.3390/ijms17101594. Int J Mol Sci. 2016. PMID: 27735863 Free PMC article. - The "next-generation" knowledge of papillary thyroid carcinoma.
Costa V, Esposito R, Pallante P, Ciccodicola A, Fusco A. Costa V, et al. Cell Cycle. 2015;14(13):2018-21. doi: 10.1080/15384101.2015.1049786. Cell Cycle. 2015. PMID: 26030480 Free PMC article. Review. - The RET oncogene in papillary thyroid carcinoma.
Prescott JD, Zeiger MA. Prescott JD, et al. Cancer. 2015 Jul 1;121(13):2137-46. doi: 10.1002/cncr.29044. Epub 2015 Mar 2. Cancer. 2015. PMID: 25731779 Review.
Cited by
- Clinicopathological and Radiological Correlation Among the Spectrum of Nodular Thyroid Lesions.
Rajyakodi K, Balasubramanian A, Sundaram S, Gnanavel H. Rajyakodi K, et al. Cureus. 2024 Oct 2;16(10):e70725. doi: 10.7759/cureus.70725. eCollection 2024 Oct. Cureus. 2024. PMID: 39493010 Free PMC article. - First-in-human, phase 1 dose-escalation and dose-expansion study of a RET inhibitor SY-5007 in patients with advanced RET-altered solid tumors.
Li W, Wang Y, Xiong A, Gao G, Song Z, Zhang Y, Huang D, Ye F, Wang Q, Li Z, Liu J, Xu C, Sun Y, Liu X, Zhou F, Zhou C. Li W, et al. Signal Transduct Target Ther. 2024 Nov 4;9(1):300. doi: 10.1038/s41392-024-02006-9. Signal Transduct Target Ther. 2024. PMID: 39489747 Free PMC article. Clinical Trial. - Statistical Significance of Clustering with Multidimensional Scaling.
Shen H, Bhamidi S, Liu Y. Shen H, et al. J Comput Graph Stat. 2024;33(1):219-230. doi: 10.1080/10618600.2023.2219708. Epub 2023 Jul 20. J Comput Graph Stat. 2024. PMID: 39483212 - Systemic treatments for radioiodine-refractory thyroid cancers.
Chen P, Yao Y, Tan H, Li J. Chen P, et al. Front Endocrinol (Lausanne). 2024 Oct 15;15:1346476. doi: 10.3389/fendo.2024.1346476. eCollection 2024. Front Endocrinol (Lausanne). 2024. PMID: 39473507 Free PMC article. Review. - The Application of microRNAs in Papillary Thyroid Cancer: A Bibliometric and Visualized Analysis.
Zhang T, Yuan B, Yu S. Zhang T, et al. Int J Gen Med. 2024 Oct 15;17:4681-4699. doi: 10.2147/IJGM.S487239. eCollection 2024. Int J Gen Med. 2024. PMID: 39429957 Free PMC article.
References
- Adeniran AJ, Zhu Z, Gandhi M, Steward DL, Fidler JP, Giordano TJ, Biddinger PW, Nikiforov YE. Correlation between genetic alterations and microscopic features, clinical manifestations, and prognostic characteristics of thyroid papillary carcinomas. The American journal of surgical pathology. 2006;30:216–222. - PubMed
- Alexander EK, Kennedy GC, Baloch ZW, Cibas ES, Chudova D, Diggans J, Friedman L, Kloos RT, LiVolsi VA, Mandel SJ, et al. Preoperative diagnosis of benign thyroid nodules with indeterminate cytology. The New England journal of medicine. 2012;367:705–715. - PubMed
- American Thyroid Association Guidelines Taskforce on Thyroid, N.,Differentiated Thyroid, C. Cooper DS, Doherty GM, Haugen BR, Kloos RT, Lee SL, Mandel SJ, Mazzaferri EL, McIver B, et al. Revised American Thyroid Association management guidelines for patients with thyroid nodules and differentiated thyroid cancer. Thyroid : official journal of the American Thyroid Association. 2009;19:1167–1214. - PubMed
- Bischoff LA, Curry J, Ahmed I, Pribitkin E, Miller JL. Is above age 45 appropriate for upstaging well-differentiated papillary thyroid cancer? Endocrine practice : official journal of the American College of Endocrinology and the American Association of Clinical Endocrinologists. 2013;19:995–997. - PubMed
Publication types
MeSH terms
Grants and funding
- P30CA16672/CA/NCI NIH HHS/United States
- UL1 TR000005/TR/NCATS NIH HHS/United States
- P30 CA016672/CA/NCI NIH HHS/United States
- 5U24CA143843/CA/NCI NIH HHS/United States
- U24 CA143882/CA/NCI NIH HHS/United States
- U54 HG003067/HG/NHGRI NIH HHS/United States
- U54HG003273/HG/NHGRI NIH HHS/United States
- U24 CA143835/CA/NCI NIH HHS/United States
- 5U24CA143840/CA/NCI NIH HHS/United States
- P30 CA046592/CA/NCI NIH HHS/United States
- 5U24CA143867/CA/NCI NIH HHS/United States
- R01 CA050706/CA/NCI NIH HHS/United States
- 5U24CA143866/CA/NCI NIH HHS/United States
- U24 CA143866/CA/NCI NIH HHS/United States
- K08 CA160658/CA/NCI NIH HHS/United States
- R01 HG007069/HG/NHGRI NIH HHS/United States
- U54HG003067/HG/NHGRI NIH HHS/United States
- U24 CA143845/CA/NCI NIH HHS/United States
- U24 CA143799/CA/NCI NIH HHS/United States
- 5U24CA144025/CA/NCI NIH HHS/United States
- U54 HG003273/HG/NHGRI NIH HHS/United States
- 5U24CA143835/CA/NCI NIH HHS/United States
- P30 CA008748/CA/NCI NIH HHS/United States
- U24 CA144025/CA/NCI NIH HHS/United States
- 5U24CA143848/CA/NCI NIH HHS/United States
- U54HG003079/HG/NHGRI NIH HHS/United States
- U24 CA180951/CA/NCI NIH HHS/United States
- U24 CA143840/CA/NCI NIH HHS/United States
- U24 CA143843/CA/NCI NIH HHS/United States
- U24 CA143858/CA/NCI NIH HHS/United States
- P30 CA177558/CA/NCI NIH HHS/United States
- R01 HG006272/HG/NHGRI NIH HHS/United States
- 5U24CA143858/CA/NCI NIH HHS/United States
- U24 CA143848/CA/NCI NIH HHS/United States
- 5U24CA143845/CA/NCI NIH HHS/United States
- U54 HG003079/HG/NHGRI NIH HHS/United States
- 5U24CA143883/CA/NCI NIH HHS/United States
- U24 CA143883/CA/NCI NIH HHS/United States
- U24 CA143867/CA/NCI NIH HHS/United States
- 5U24CA143882/CA/NCI NIH HHS/United States
- 5U24CA143799/CA/NCI NIH HHS/United States
LinkOut - more resources
Full Text Sources
Other Literature Sources
Medical
Research Materials


